I re-processed the salmon RRBS data implementing the following changes:
1. Trimming
- 10bp clipped off each end of the read
- see post: https://shellywanamaker.github.io/315th-post/
2. Alignment
- used alignment score threshold of L,0,-0.3.
-
exceprt from script shown below:
  #define genome folder

  genome_folder="/gscratch/srlab/strigg/data/Ssalar/GENOMES/chr1-29MT"

  #run bismark in PE mode on trimmed reads

  find /gscratch/scrubbed/strigg/analyses/20200612/*_R1_001_val_1.fq.gz |\
  xargs basename -s _R1_001_val_1.fq.gz| \
  xargs -I{} bismark \
  --score_min L,0,-0.3 \
  -p 4 \
  --non_directional \
  --genome ${genome_folder} \
  -1 /gscratch/scrubbed/strigg/analyses/20200612/{}_R1_001_val_1.fq.gz \
  -2 /gscratch/scrubbed/strigg/analyses/20200612/{}_R2_001_val_2.fq.gz \

  # deduplicate

  find *.bam | \
  xargs basename -s .bam | \
  xargs -I{} deduplicate_bismark \
  --bam \
  --paired \
  {}.bam

  #run methylation extractor
  bismark_methylation_extractor \
  --paired-end \
  --bedGraph \
  --comprehensive \
  --counts \
  --scaffolds \
  --multicore 14 \
  --buffer_size 75% \
  *.deduplicated.bam
3. Generate downstream files for calling DMRs
- Exceprt from script shown below.
-
Note tab files generated in last part contain a last field that is the total number of reads for each CpG loci, where in the past this field has been the number of reads for unmethylated CpGs. This is because this format is closer to the allc format required for input into the DMRfind program in MethylPywhich calls methylated regions.
# Sort files for methylkit and IGV find *.deduplicated.bam | \ xargs basename -s .bam | \ xargs -I{} samtools \ sort --threads 28 {}.bam \ -o {}.sorted.bam # Index sorted files for IGV # The "-@ 16" below specifies number of CPU threads to use. find *.sorted.bam | \ xargs basename -s .sorted.bam | \ xargs -I{} samtools \ index -@ 28 {}.sorted.bam # Run multiqc /gscratch/srlab/strigg/bin/anaconda3/bin/multiqc \ /gscratch/scrubbed/strigg/analyses/20200612/ \ /gscratch/scrubbed/strigg/analyses/20200613/ # create merged find *.deduplicated.bismark.cov.gz |\ xargs basename -s .deduplicated.bismark.cov.gz |\ xargs -I{} coverage2cytosine \ --genome_folder ${genome_folder} \ -o {} \ --merge_CpG \ --zero_based \ {}.deduplicated.bismark.cov.gz #creating tab files with % me, raw mCpG and total CpG counts for f in *merged_CpG_evidence.cov do STEM=$(basename "${f}" .CpG_report.merged_CpG_evidence.cov) cat "${f}" | awk -F $'\t' 'BEGIN {OFS = FS} {if ($5+$6 >= 5) {print $1, $2, $3, $4, $5, $5+$6}}' \ > "${STEM}"_5x.bed done- script: performs alignments, runs multiqc, and generates downstream files (merged cov files, sorted bams for IGV, tab files that can be converted to allc format for for input into DMRfind) 20200613_BmrkAln_Salmo.sh
- slurm file: slurm-2708939.out
- output: https://gannet.fish.washington.edu/metacarcinus/Salmo_Calig/analyses/20200613/
4. Assess genome coverage
I ran picard tools CollectWgsMetrics to get an idea of genome coverage across samples
- script: 20200616_PicardAllcDMRfind.sh
The results (files ending in .collect_wgs_metrics.txt) suggest low genome coverage (~0.5%), but that is expected given this is RRBS data.
A better way to assess this might be to look at CpG coverage as I did for the meth_compare project (see https://github.com/hputnam/Meth_Compare/blob/master/scripts/README.md)
5. Calling methylated regions
Optimizations:
1. exclude CTRL samples
I decided to not include the 2 uninfected control samples from 8C and 16C because:
- there are only uninfected controls for 26psu and not for 32psu
- 2 samples is not enough to calculate mean methylation
2. reduce false negatives by removing the sample-catagory parameter
I’m excluding the sample category parameter because this led to false negatives (see where I encountered this in the geoduck BS data here: https://shellywanamaker.github.io/232th-post/). This is different than what I had done in the past: past analysis summary 210th-post and past code 20191030_DMRfindMAPQ20_SalmoPt2.sh. Excerpt from past code shown below:
--min-cov 5 \
--output-prefix DMR250bp_MAPQ20_MCmax25_cov5x \
--dmr-max-dist 250 \
--mc-max-dist 25 \
--min-num-dms 3 \
--sample-category
STEP 1: Generate allc files
allc files were generated as follows
for f in ${input_files}*.merged_CpG_evidence.cov
do
awk -F"\t" '{print $1"\t"$3-1"\t""+""\t""CGA""\t"$5"\t"$5+$6"\t"1}' ${f} |\
gzip > $(basename ${f} _R1_001_val_1_bismark_bt2_pe.CpG_report.merged_CpG_evidence.cov)_allc.tsv.gz
done
- script: 20200702_AllcDMRfind_Salmo2.sh This script generates allc files from merged.cov files. It also ran DMRfind with 5x coverage thresholding BUT included CTRL samples so I did not use the DMRfind output from this script.
- slurm file: slurm-79754.out
- output: https://gannet.fish.washington.edu/metacarcinus/Salmo_Calig/analyses/20200702/
STEP 2: Run DMRfind
This step identifies genomic regions across samples that are statistically different than what would be expected from methylation resulting from genetic variation alone.
I first copied all input files from Gannet to Ostrich as follows:
rsync --archive --verbose --progress --exclude CTRL* /Volumes/web/metacarcinus/Salmo_Calig/analyses/20200702/*_allc.tsv.gz ~/Desktop/20200811
I next ran methylpy DMRfind locally on Ostrich.
methylpy DMRfind \
--allc-files \
16C_26psu_1_S13_allc.tsv.gz \
16C_26psu_2_S14_allc.tsv.gz \
16C_26psu_3_S15_allc.tsv.gz \
16C_26psu_4_S16_allc.tsv.gz \
16C_32psu_1_S1_allc.tsv.gz \
16C_32psu_2_S2_allc.tsv.gz \
16C_32psu_3_S3_allc.tsv.gz \
16C_32psu_4_S4_allc.tsv.gz \
8C_26psu_1_S9_allc.tsv.gz \
8C_26psu_2_S10_allc.tsv.gz \
8C_26psu_3_S11_allc.tsv.gz \
8C_26psu_4_S12_allc.tsv.gz \
8C_32psu_1_S5_allc.tsv.gz \
8C_32psu_2_S6_allc.tsv.gz \
8C_32psu_3_S7_allc.tsv.gz \
8C_32psu_4_S8_allc.tsv.gz \
--samples 16C_26psu_1 16C_26psu_2 16C_26psu_3 16C_26psu_4 16C_32psu_1 16C_32psu_2 16C_32psu_3 16C_32psu_4 8C_26psu_1 8C_ ^M26psu_2 8C_26psu_3 8C_26psu_4 8C_32psu_1 8C_32psu_2 8C_32psu_3 8C_32psu_4 \
--mc-type "CGN" \
--num-procs 8 \
--min-cov 5 \
--output-prefix DMR250bp_MCmax25_cov5x \
--dmr-max-dist 250 \
--mc-max-dist 25 \
--min-num-dms 3
- log file: screenlog.0
- output: https://gannet.fish.washington.edu/metacarcinus/Salmo_Calig/analyses/20200811/
- DMR250bp_MCmax25_cov5x_rms_results_collapsed.tsv
- These results contain 1,720 methylated regions which is very much in line with the DMRfind output from geoduck BS data.
- DMR250bp_MCmax25_cov5x_rms_results_collapsed.tsv
Alternate DMRfind analyses I tried that didn’t give optimal results:
- 20200616
- here is used the following parameters and the results file contained 8 regions when I was expecting > 1000 regions based on the geoduck results
--output-prefix DMR250bp_cov5x --dmr-max-dist 250 --min-num-dms 3 - 20200701
- I thought my results may not be correct because I didn’t employ the min_clust parameter so I tried the following
--output-prefix DMR250bp_cov5x_minClust1 --dmr-max-dist 250 --min-num-dms 3 --sample-category 0 0 0 0 1 1 1 1 2 2 2 2 3 3 3 3 4 4 5 5 --min-cluster 1- script: 20200701_DMRfind_Salmo.sh
- The results file DMR250bp_cov5x_minClust1_rms_results_collapsed.tsv contained no regions this time.
- 20200702
- I realized when I generated the DMRfind input files I mistakenly added fields 5 and 6 of the tab files again, when already field 6 of the tab files contained the total mC and umC counts.
(base) [strigg@mox1 20200613]$ head CTRL_8C_26psu_2_S18_R1_001_val_1_bismark_bt2_pe.CpG_report.merged_CpG_evidence.cov NC_001960.1 106 108 0.000000 0 3 NC_001960.1 200 202 0.000000 0 419 NC_001960.1 231 233 0.947867 4 418 NC_001960.1 267 269 0.000000 0 337 NC_001960.1 274 276 0.419287 2 475 NC_001960.1 301 303 0.620347 5 801 NC_001960.1 326 328 0.459418 3 650 NC_001960.1 333 335 0.469484 3 636 NC_001960.1 379 381 0.190476 1 524 NC_001960.1 396 398 0.451467 2 441 (base) [strigg@mox1 20200613]$ head CTRL_8C_26psu_2_S18_R1_001_val_1_bismark_bt2_pe_5x.bed NC_001960.1 200 202 0.000000 0 419 NC_001960.1 231 233 0.947867 4 422 NC_001960.1 267 269 0.000000 0 337 NC_001960.1 274 276 0.419287 2 477 NC_001960.1 301 303 0.620347 5 806 NC_001960.1 326 328 0.459418 3 653 NC_001960.1 333 335 0.469484 3 639 NC_001960.1 379 381 0.190476 1 525 NC_001960.1 396 398 0.451467 2 443 NC_001960.1 463 465 0.966184 4 414 (base) [strigg@mox1 20200613]$ cat *5x.bed | awk -F"\t" '{if($6<$5)print $0}' | wc -l 0 (base) [strigg@mox1 20200613]$ zcat ../20200616/CTRL_8C_26psu_2_S18_allc_5x.tsv.gz | head NC_001960.1 201 + CGA 0 419 1 NC_001960.1 232 + CGA 4 426 1 NC_001960.1 268 + CGA 0 337 1 NC_001960.1 275 + CGA 2 479 1 NC_001960.1 302 + CGA 5 811 1 NC_001960.1 327 + CGA 3 656 1 NC_001960.1 334 + CGA 3 642 1 NC_001960.1 380 + CGA 1 526 1 NC_001960.1 397 + CGA 2 445 1 NC_001960.1 464 + CGA 4 418 1- I remade the input files as follows
for f in ${input_files}*_5x.bed do awk -F"\t" '{print $1"\t"$3-1"\t""+""\t""CGA""\t"$5"\t"$6"\t"1}' ${f} |\ gzip > $(basename ${f} _R1_001_val_1_bismark_bt2_pe_5x.bed)_allc_5x.tsv.gz done- I ran DMRfind with the following parameters
--output-prefix DMR250bp_cov5x \ --dmr-max-dist 250 \ --min-num-dms 3-
The results file (DMR250bp_cov5x_rms_results_collapsed.tsv) contained 100 regions which seemed better, but still not the > 1000 regions that I was expecting.
- script: 20200702_AllcDMRfind_Salmo.sh
- FINALLY I realized in the past that I employed the following parameters, so I included these as well as re-made the allc files from .cov files to include all loci at any coverage so that DMRfind can apply the thresholding. See script first mentioned in the beginning of this section.
- –min-cov 5
- –mc-max-dist 25
- here the CTRL samples were included when regions were called:
- script: 20200702_AllcDMRfind_Salmo2.sh This script generates allc files from merged.cov files. It also ran DMRfind with 5x coverage thresholding BUT included CTRL samples so I did not use the DMRfind output from this script.
- slurm file: slurm-79754.out
- output: https://gannet.fish.washington.edu/metacarcinus/Salmo_Calig/analyses/20200702/
6. Calling DMRs
- R Script: 20200812_groupStats.Rmd
- this script performs the following:
- filters methylated regions for coverage in at least 3 out of 4 samples
- performs arcsin square root transformation of % methylation data (DMR250bp_MCmax25_cov5x_rms_results_collapsed.tsv) for each region
- performs 2-way ANOVA to identify DMRs
- generates heatmaps for significant DMRs (p< 0.05)
- generates ANOVA results table
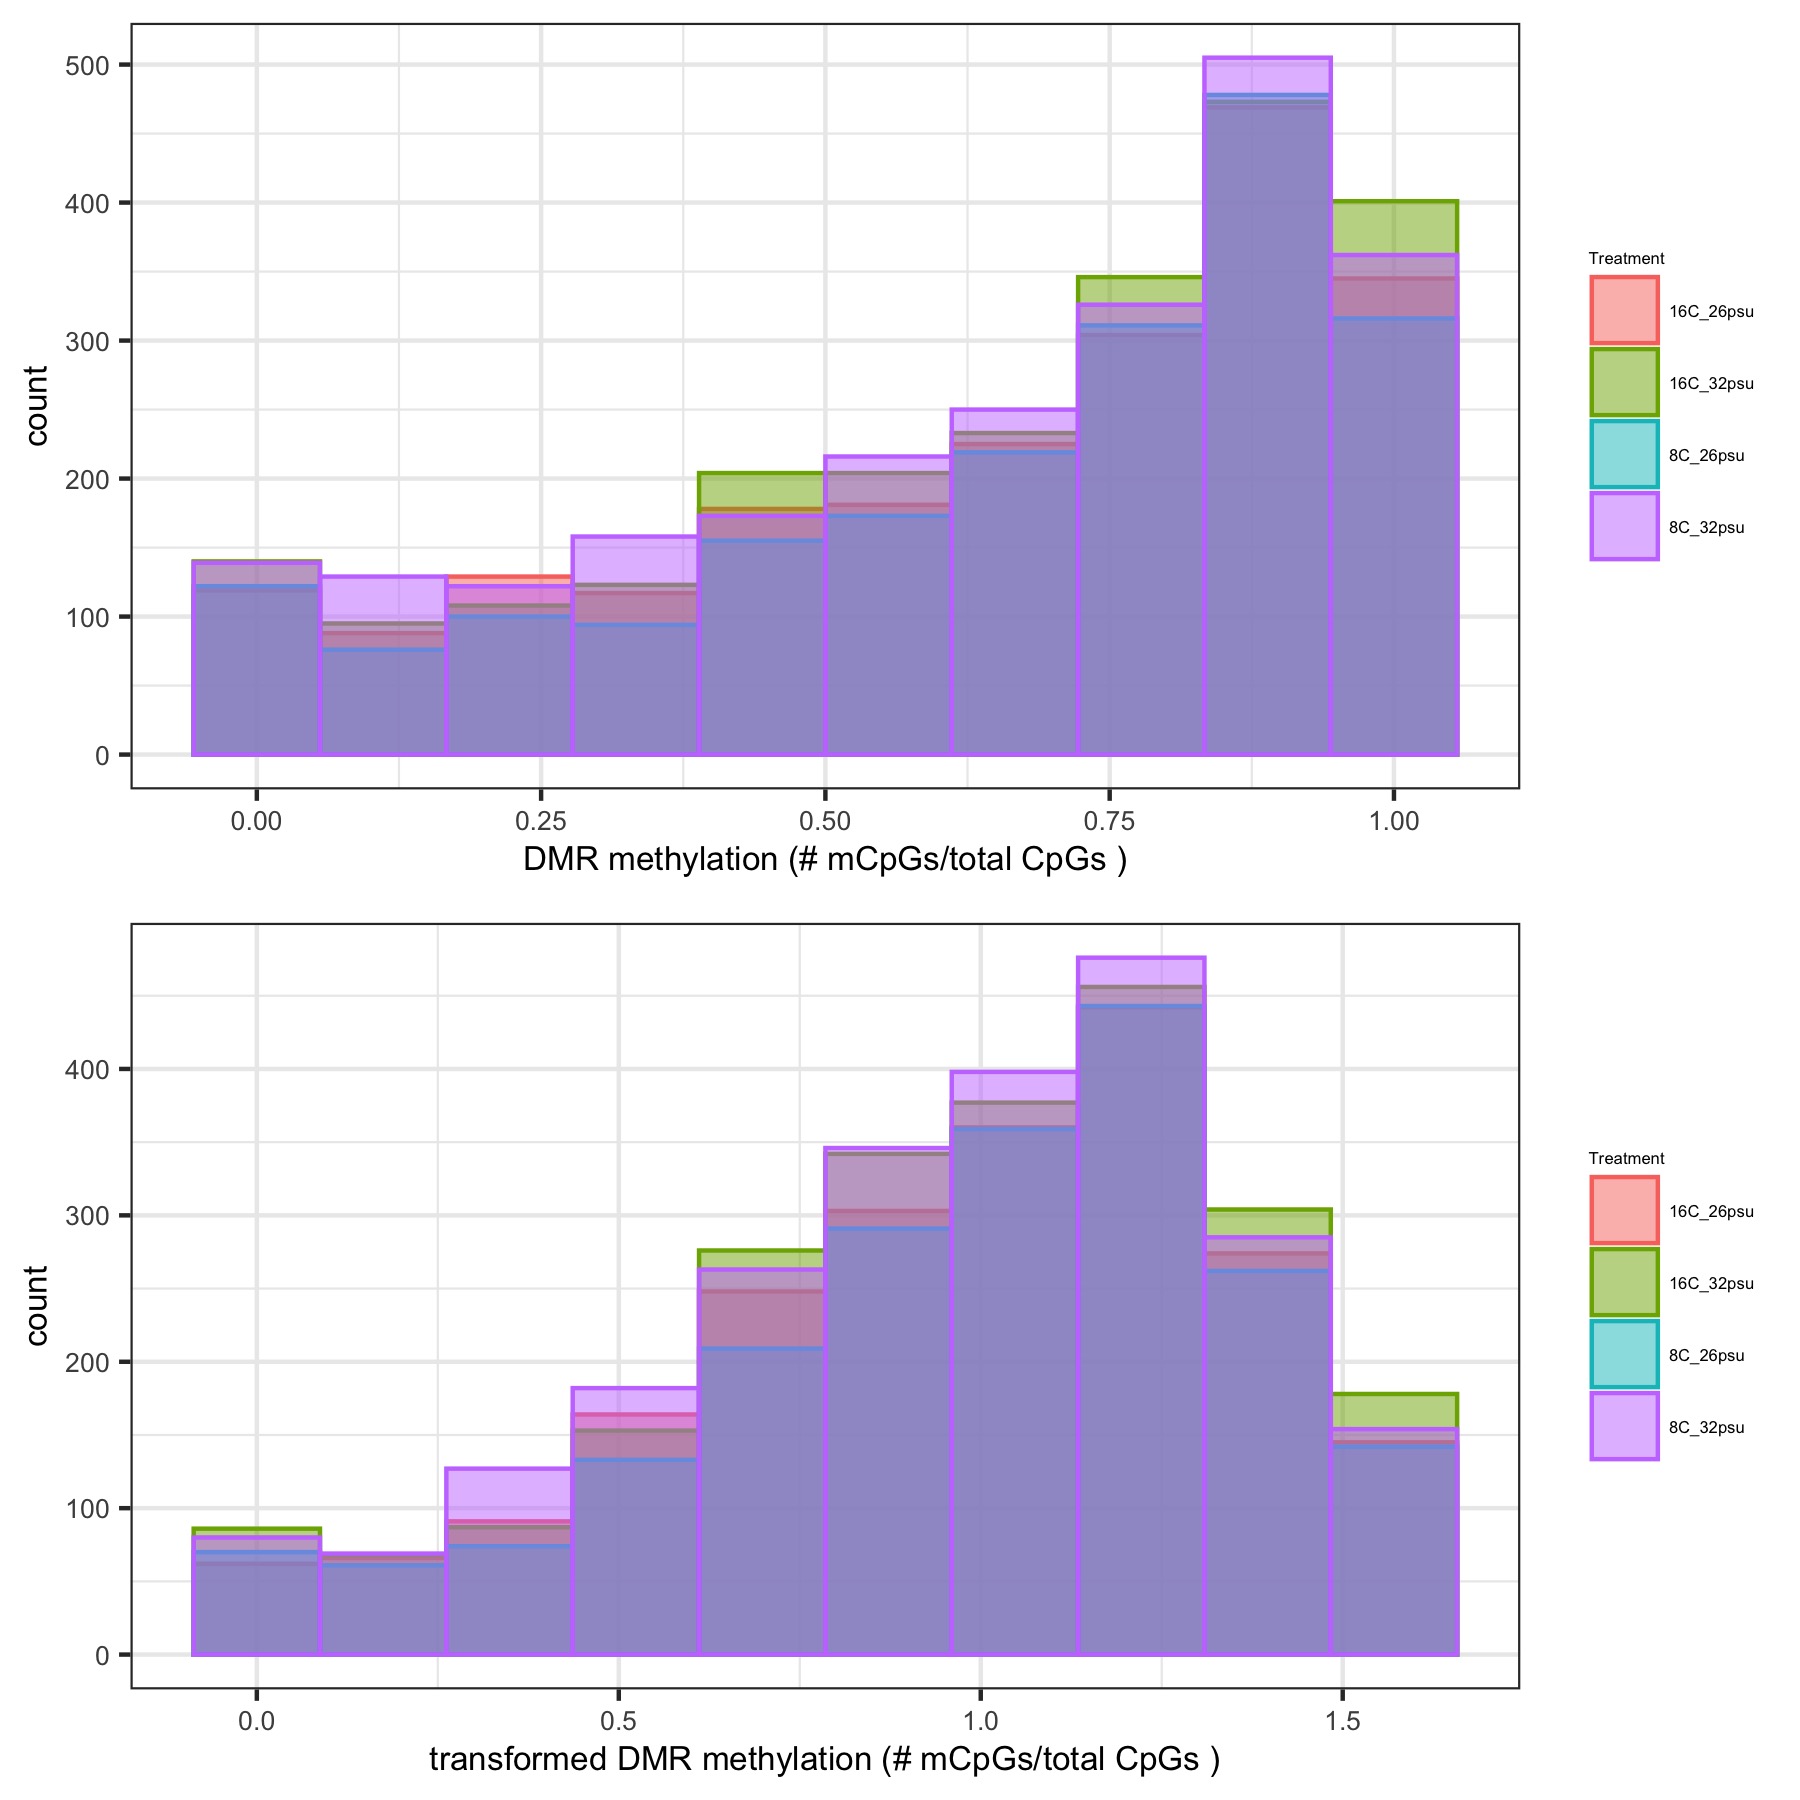
- generates histograms of DMR methylation before and after arcsin square root transformation and heatmaps of DMR methylation
- this script performs the following:
Histograms of DMR methylation before and after arcsin square root transformation
Results from 2-way ANOVA (percent methylation ~ Temp * Salinity)
- DMR_2way_aov_summ_stats.csv
- The last column “sig_effect” denotes a significant effect at P < 0.05
- 501 regions were not significant (denoted as “none”)
- 48 regions showed a significant effect from salinity only (denoted as “Salinity”)
- 30 regions showed a significant effect from temperature only (denoted as “Temp”)
- 6 regions showed a significant additive effect meaning a significant effect from temperature and a significant effect from salinity but no significant interaction effect (denoted as “Temp+Sal”)
- 39 regions showed a significant interaction effect from temperature and salinity (denoted as “TempxSal”)
- The last column “sig_effect” denotes a significant effect at P < 0.05
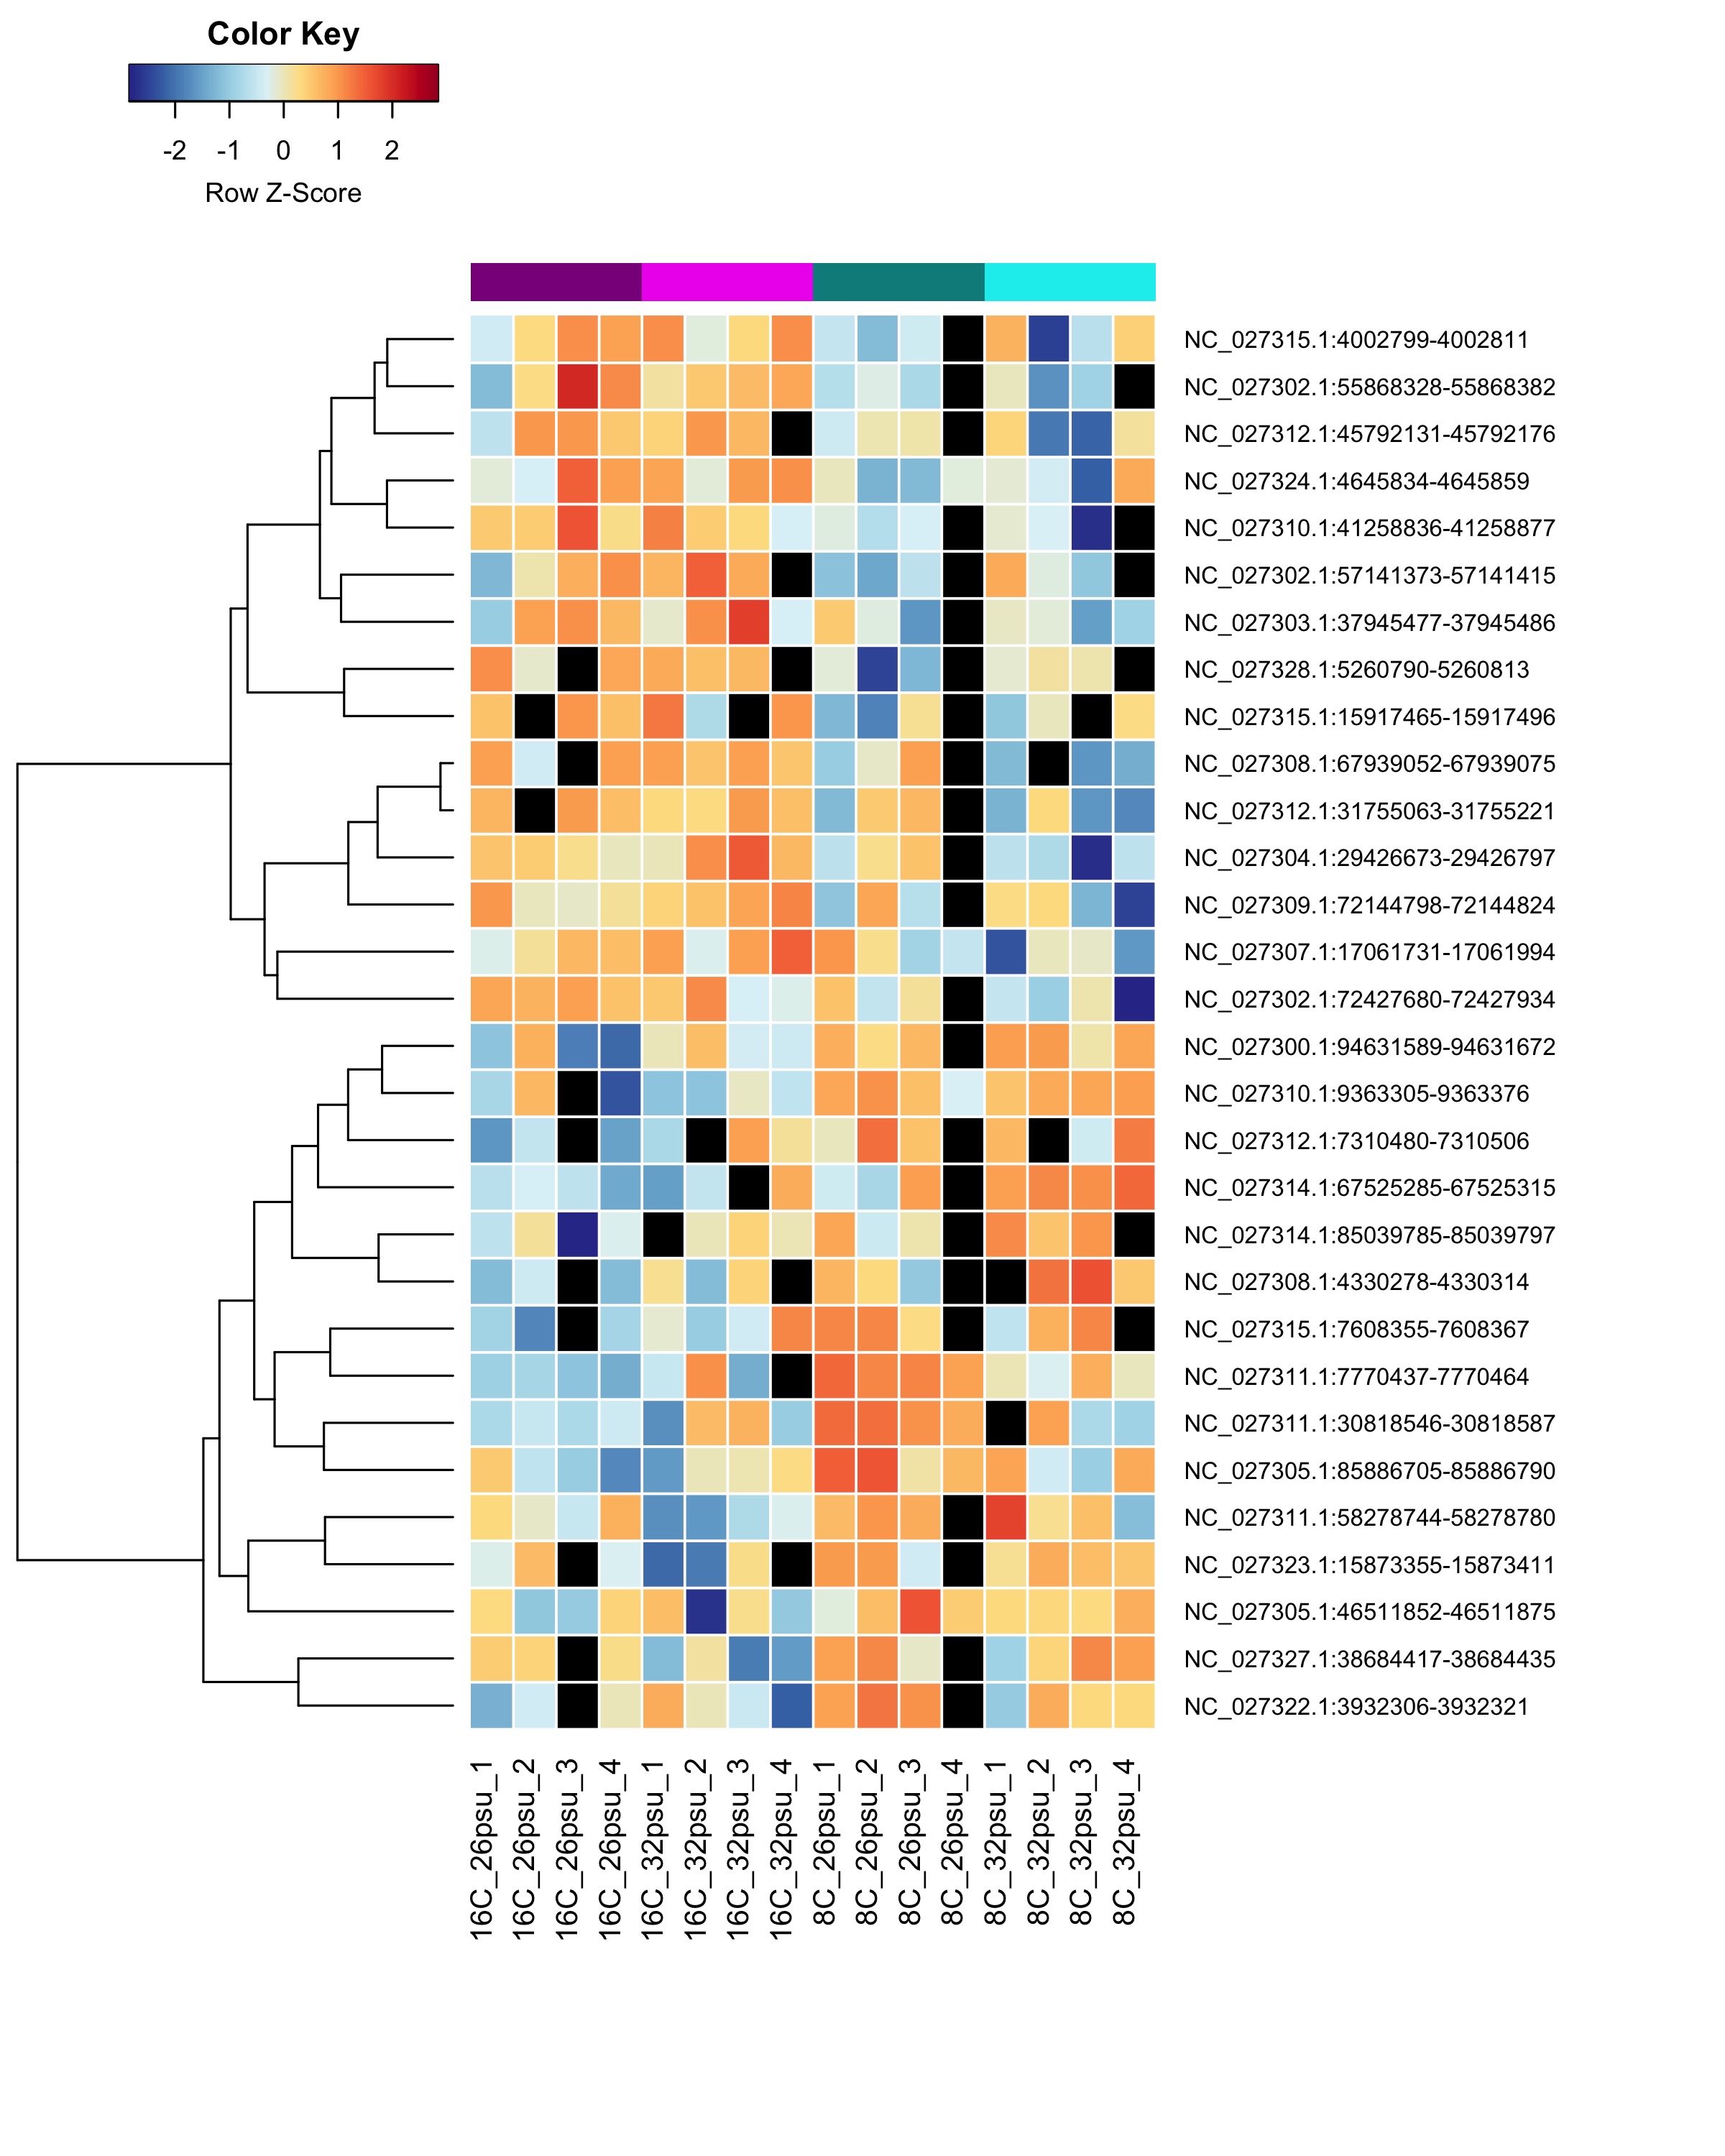
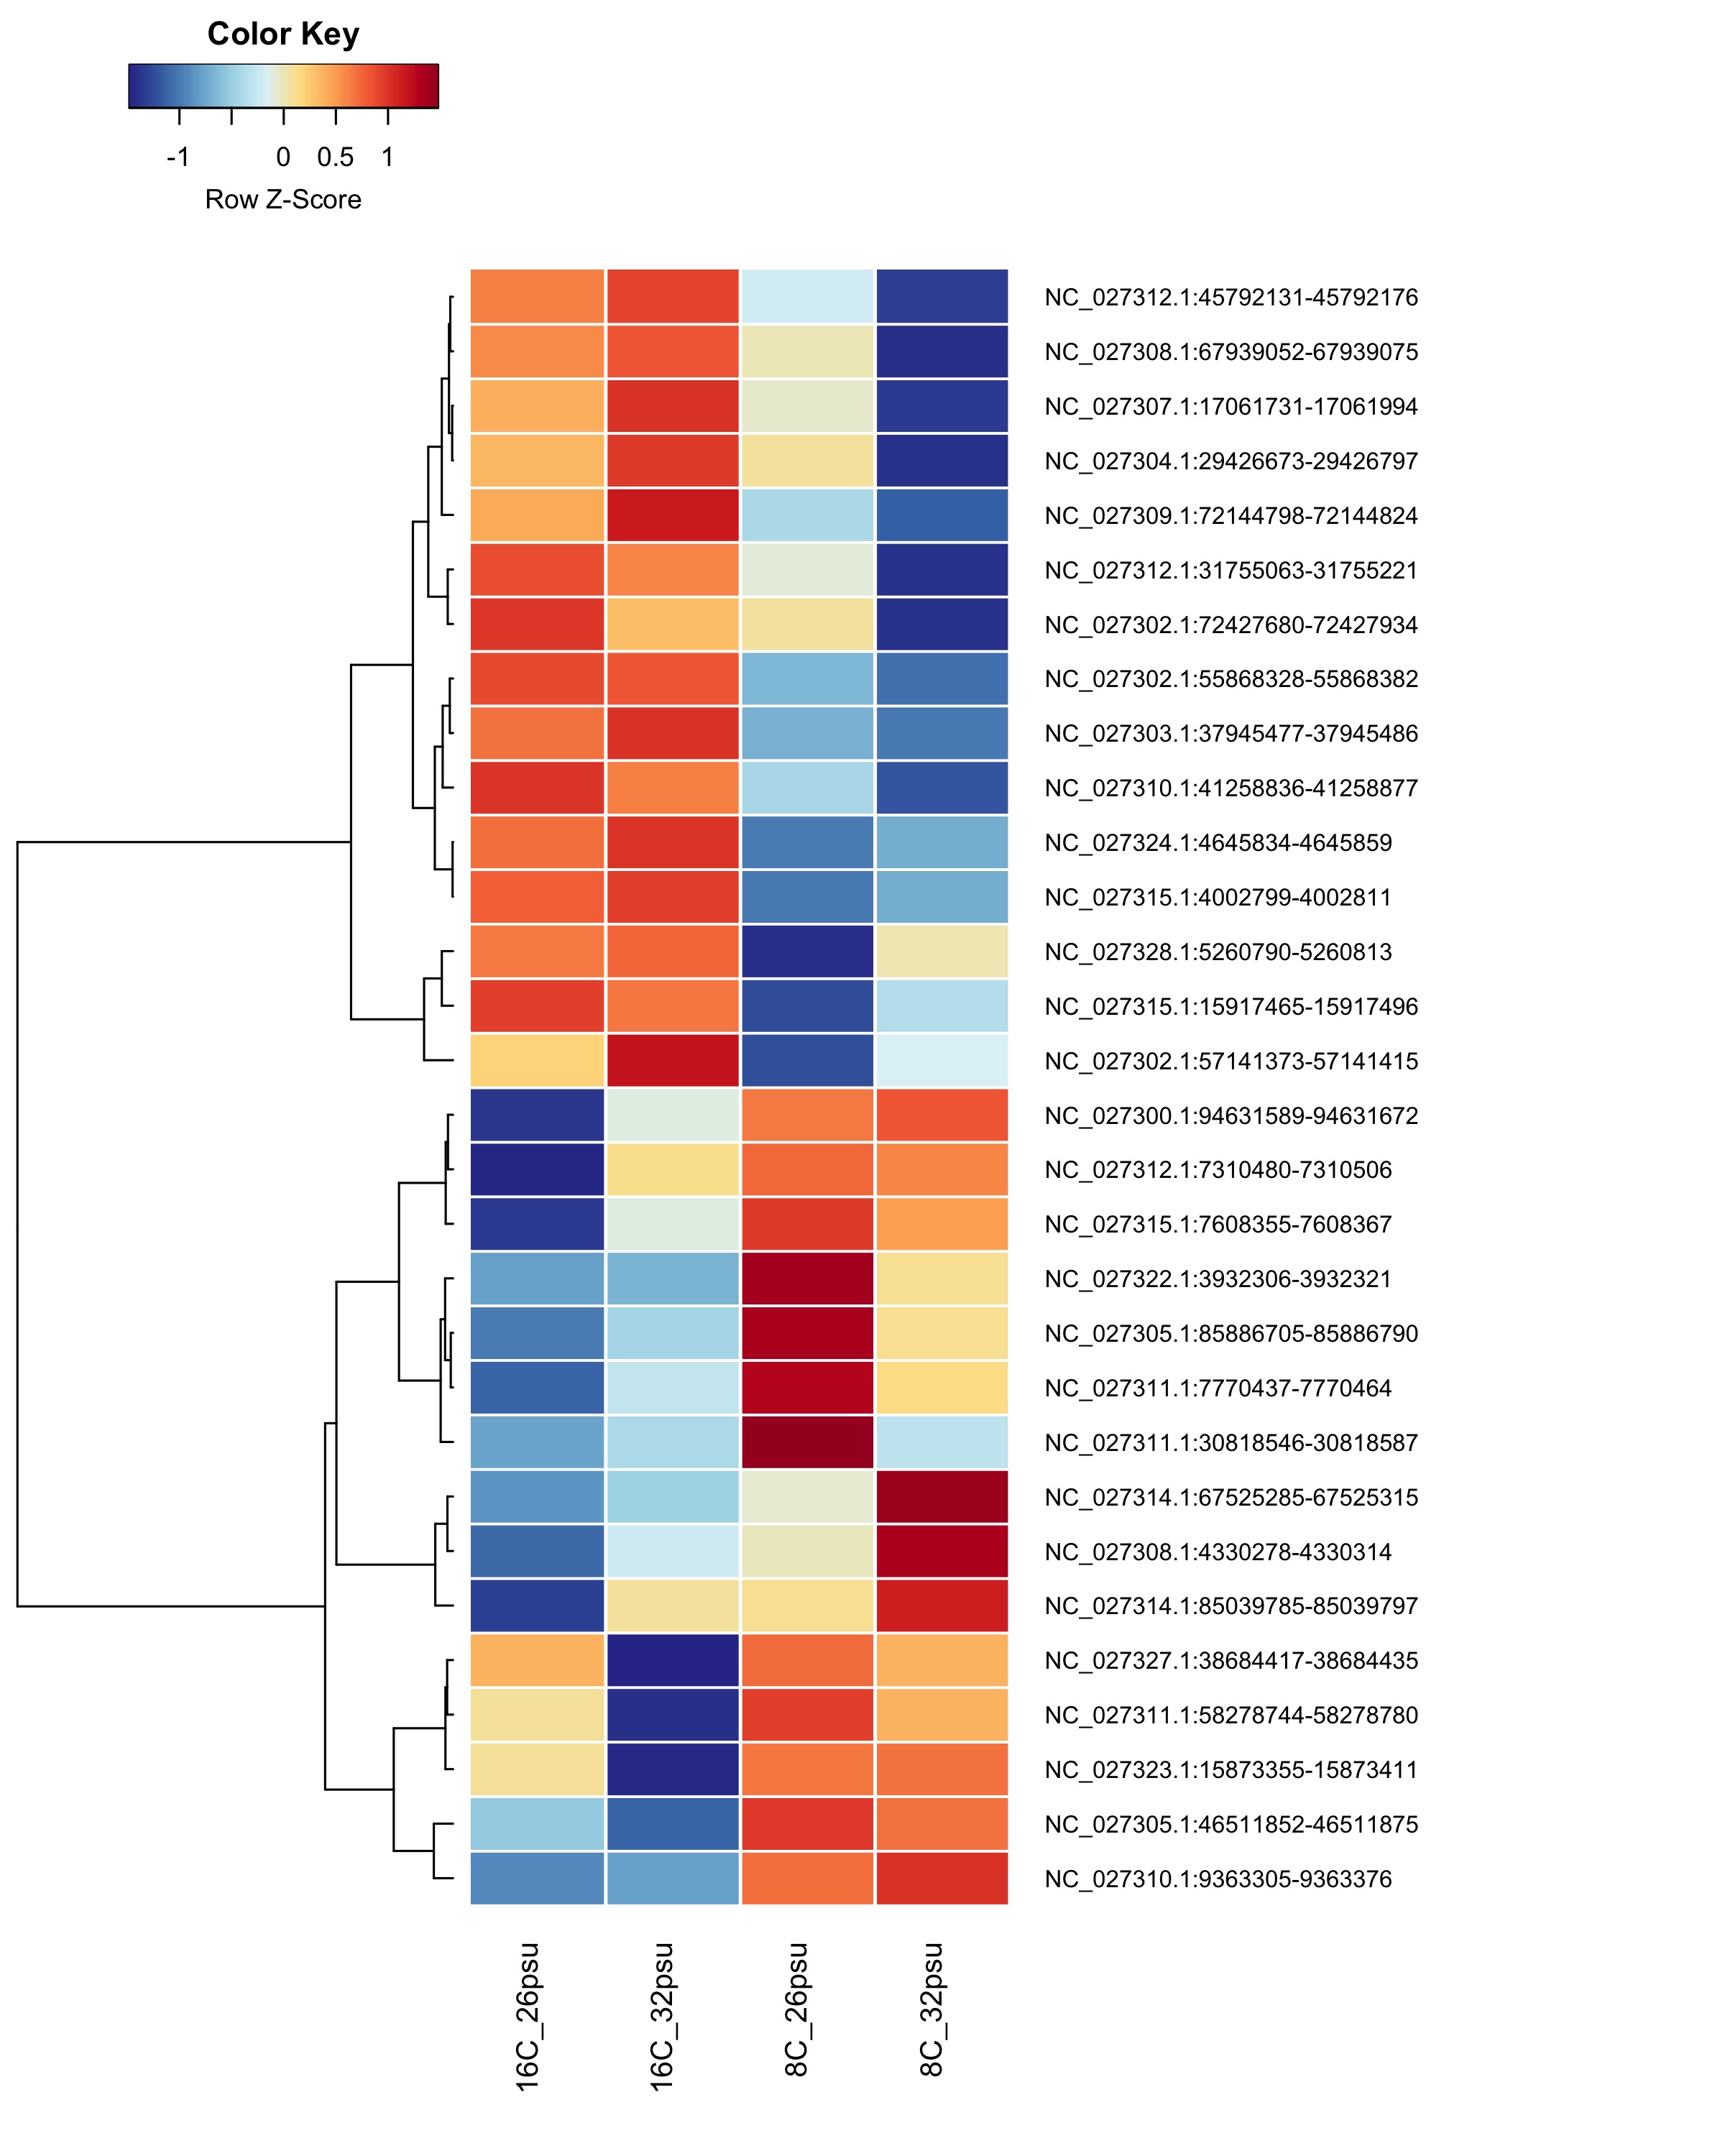
DMRs affected by Salinity
These DMRs showed only a significant effect from salinity and not from temperature or the salinity:temperature interaction.
Heatmap showing sample % methylation across treatment groups
Heatmap showing group mean % methylation across treatment groups
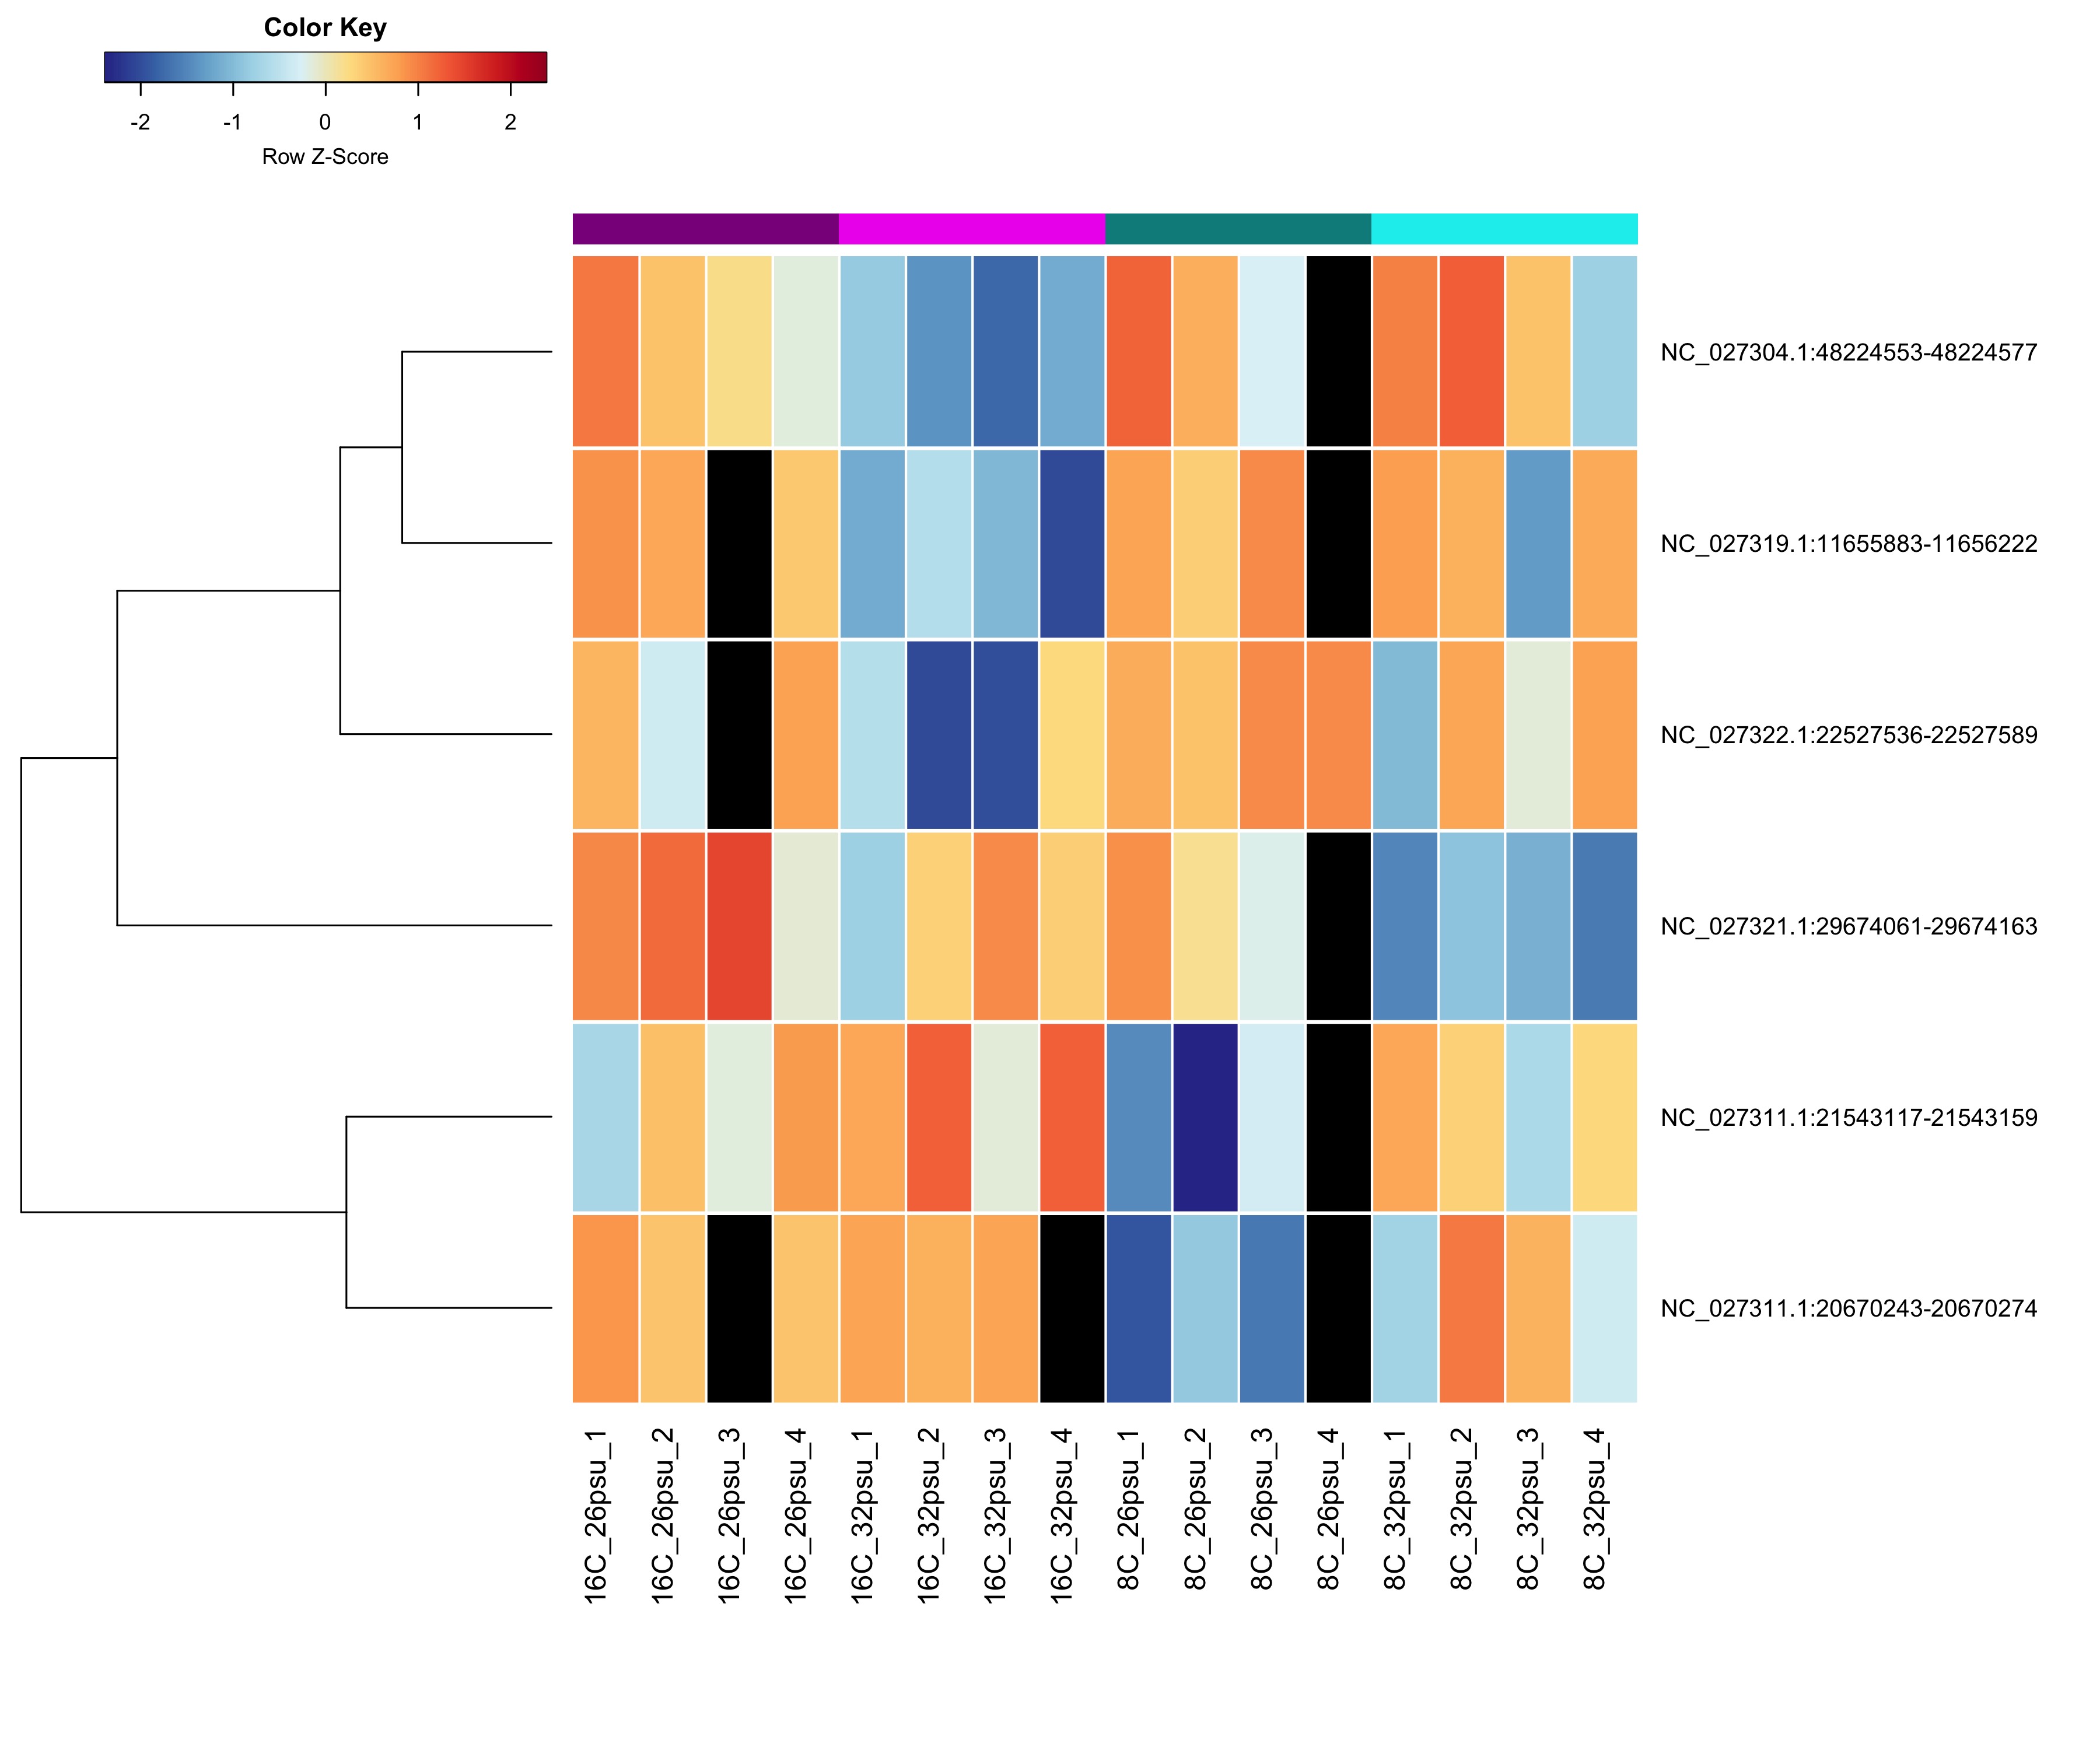
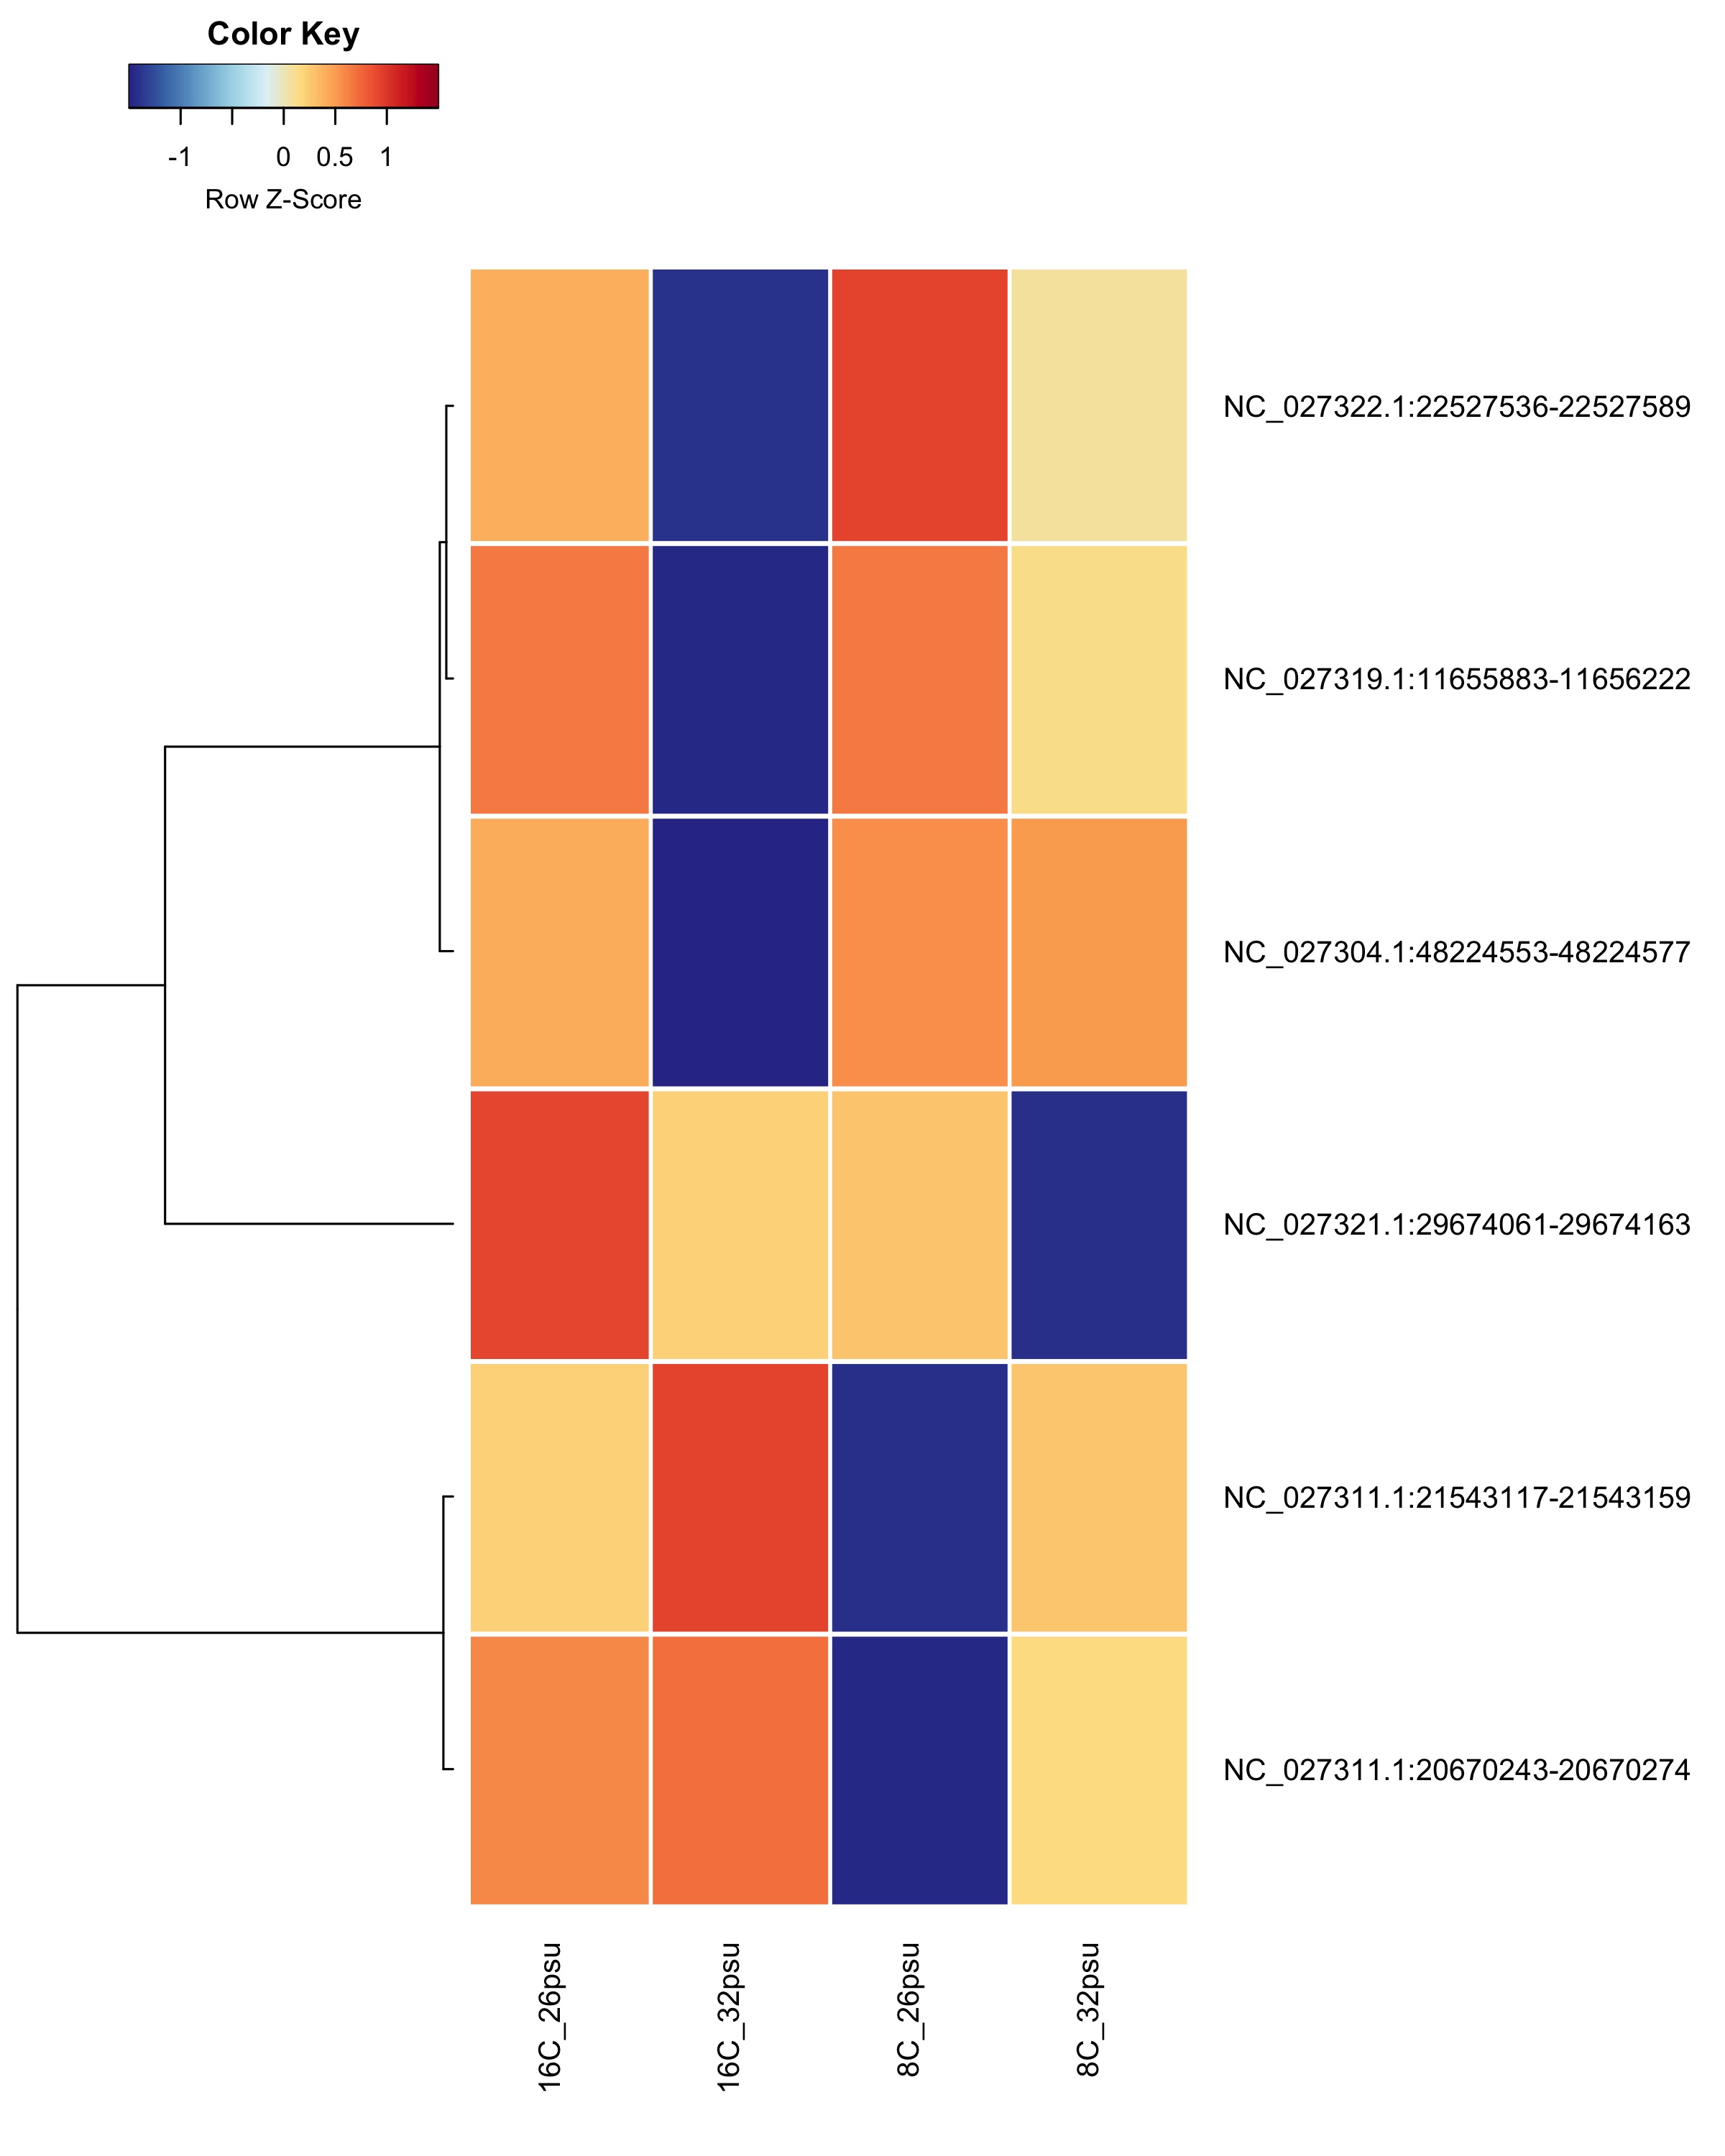
DMRs affected by Temperature
These DMRs showed only a significant effect from temperature and not from salinity or the salinity:temperature interaction.
Heatmap showing sample % methylation across treatment groups
Heatmap showing group mean % methylation across treatment groups
DMRs showing a Salinity + Temperature additive effect These DMRs showed a significant effect from salinity and temperature but no significant effect from their interaction.
Heatmap showing sample % methylation across treatment groups
Heatmap showing group mean % methylation across treatment groups
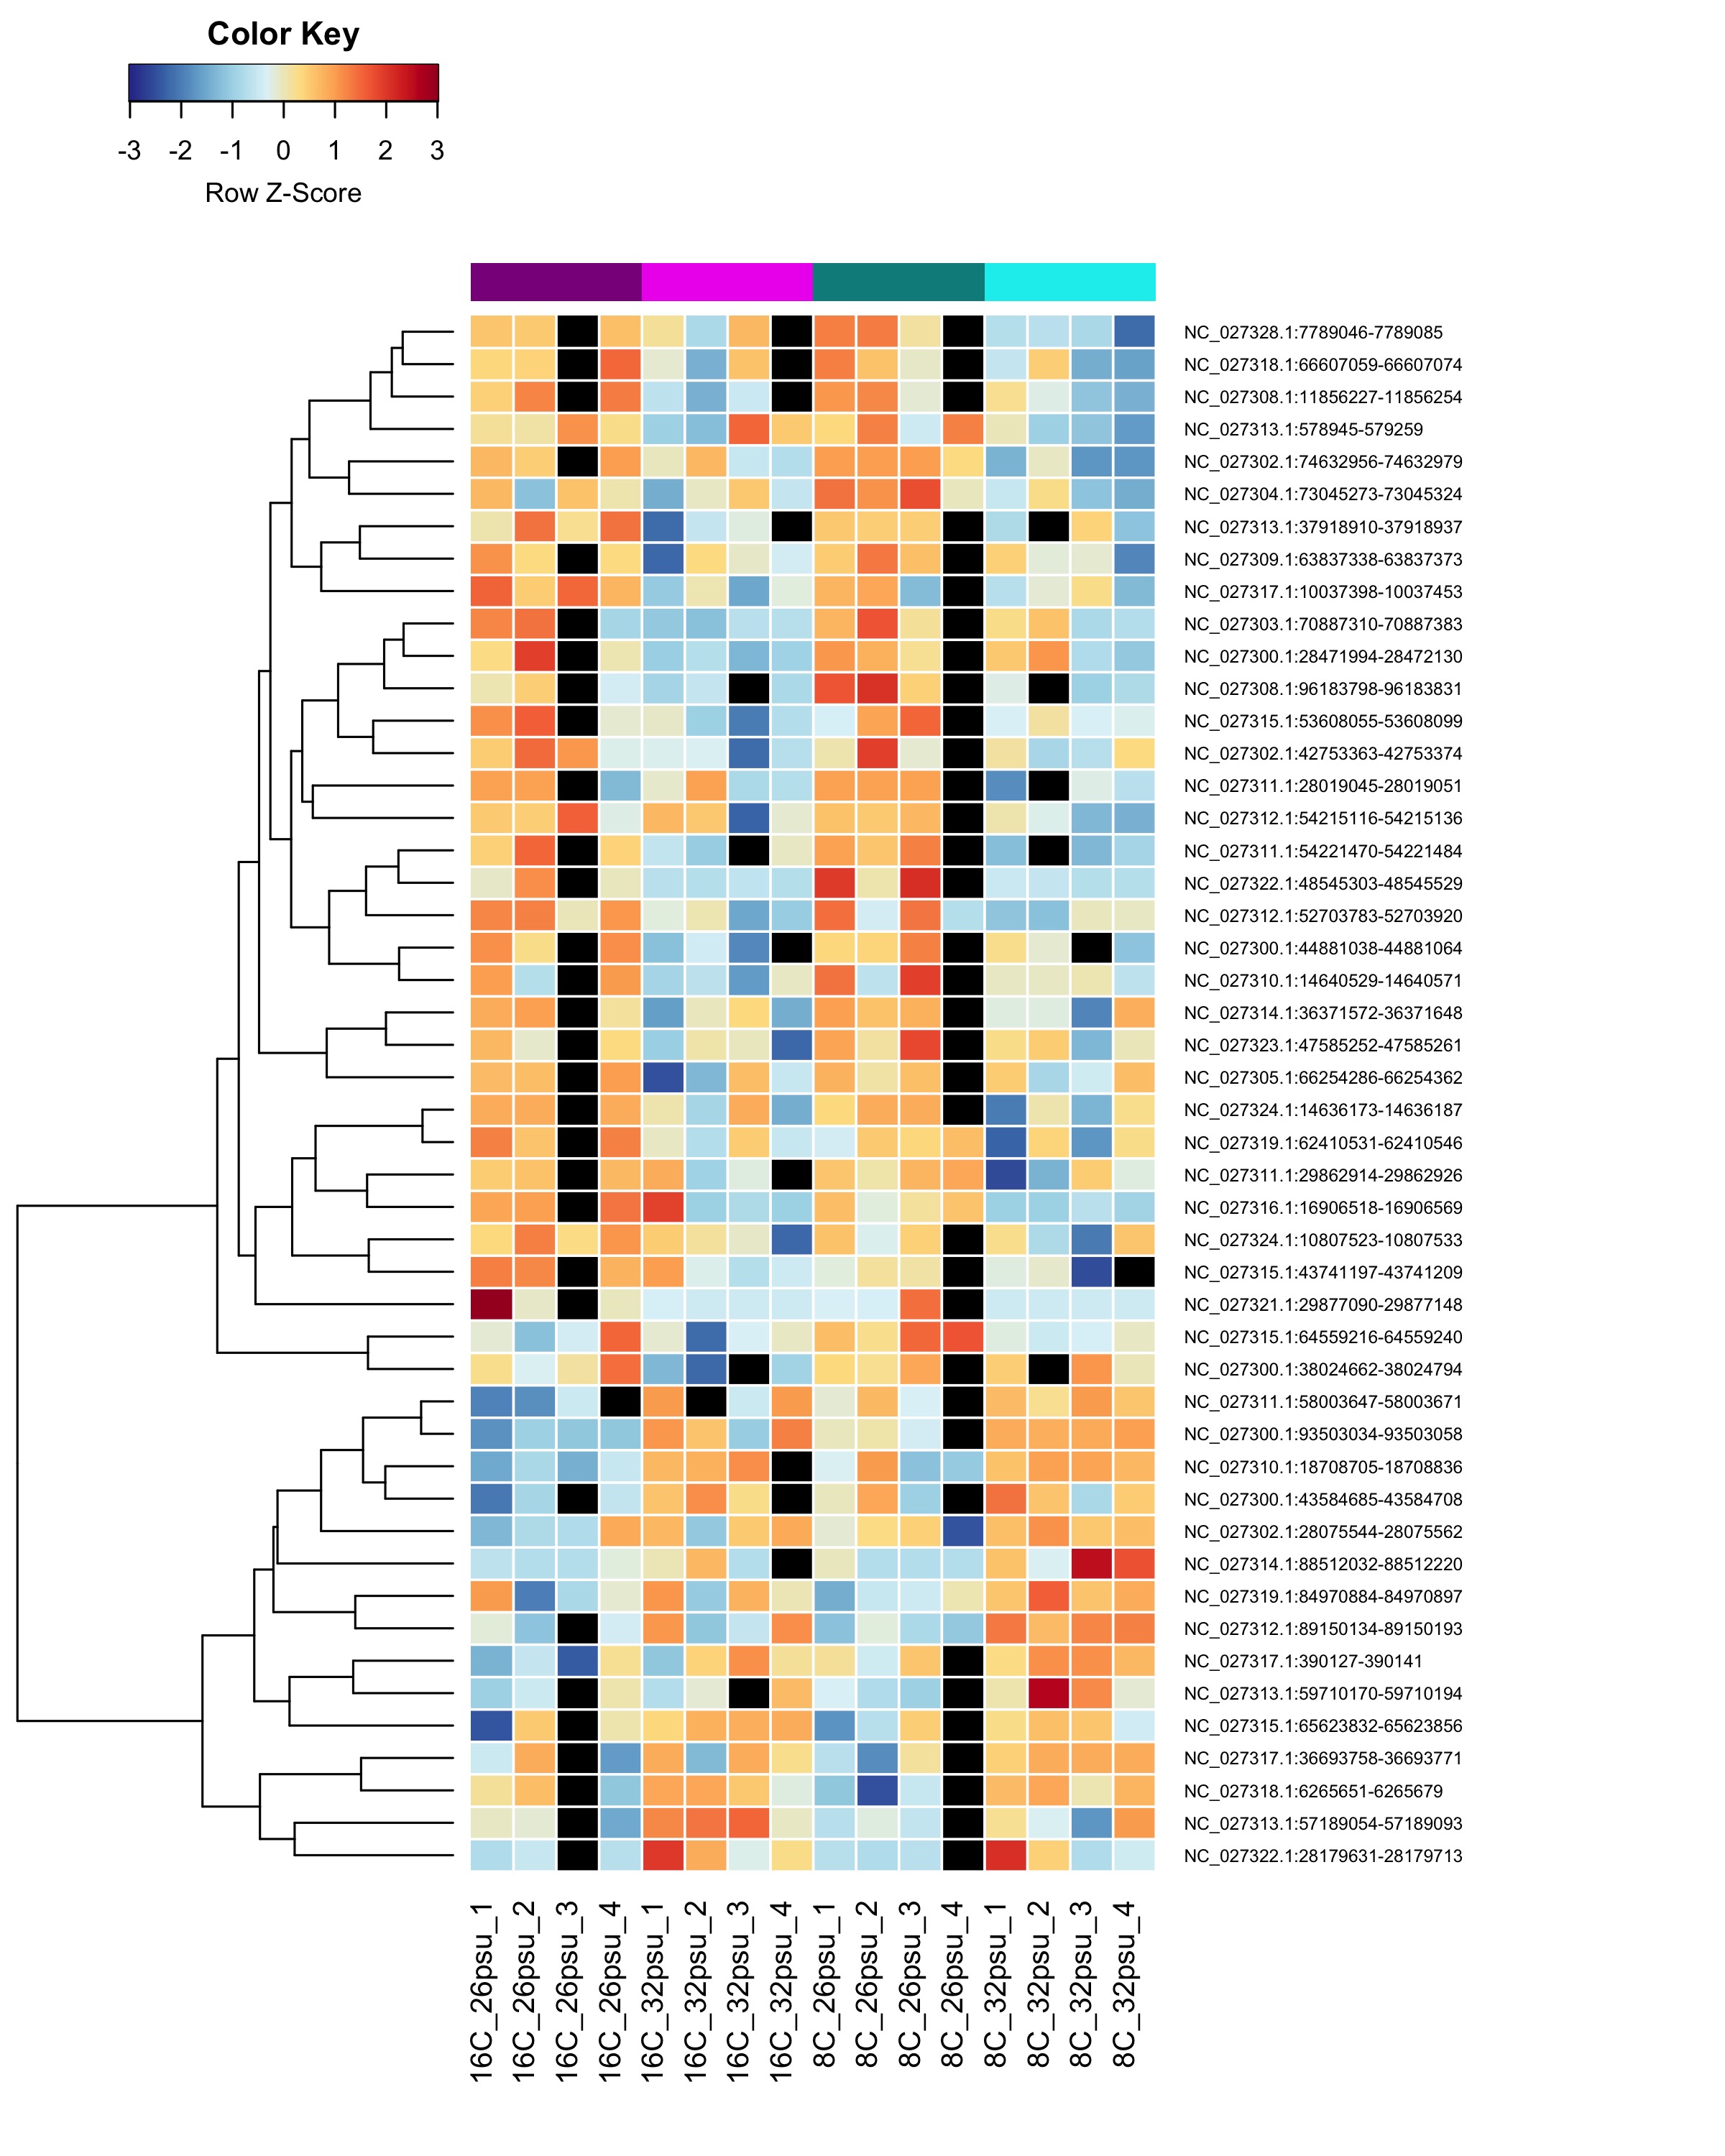
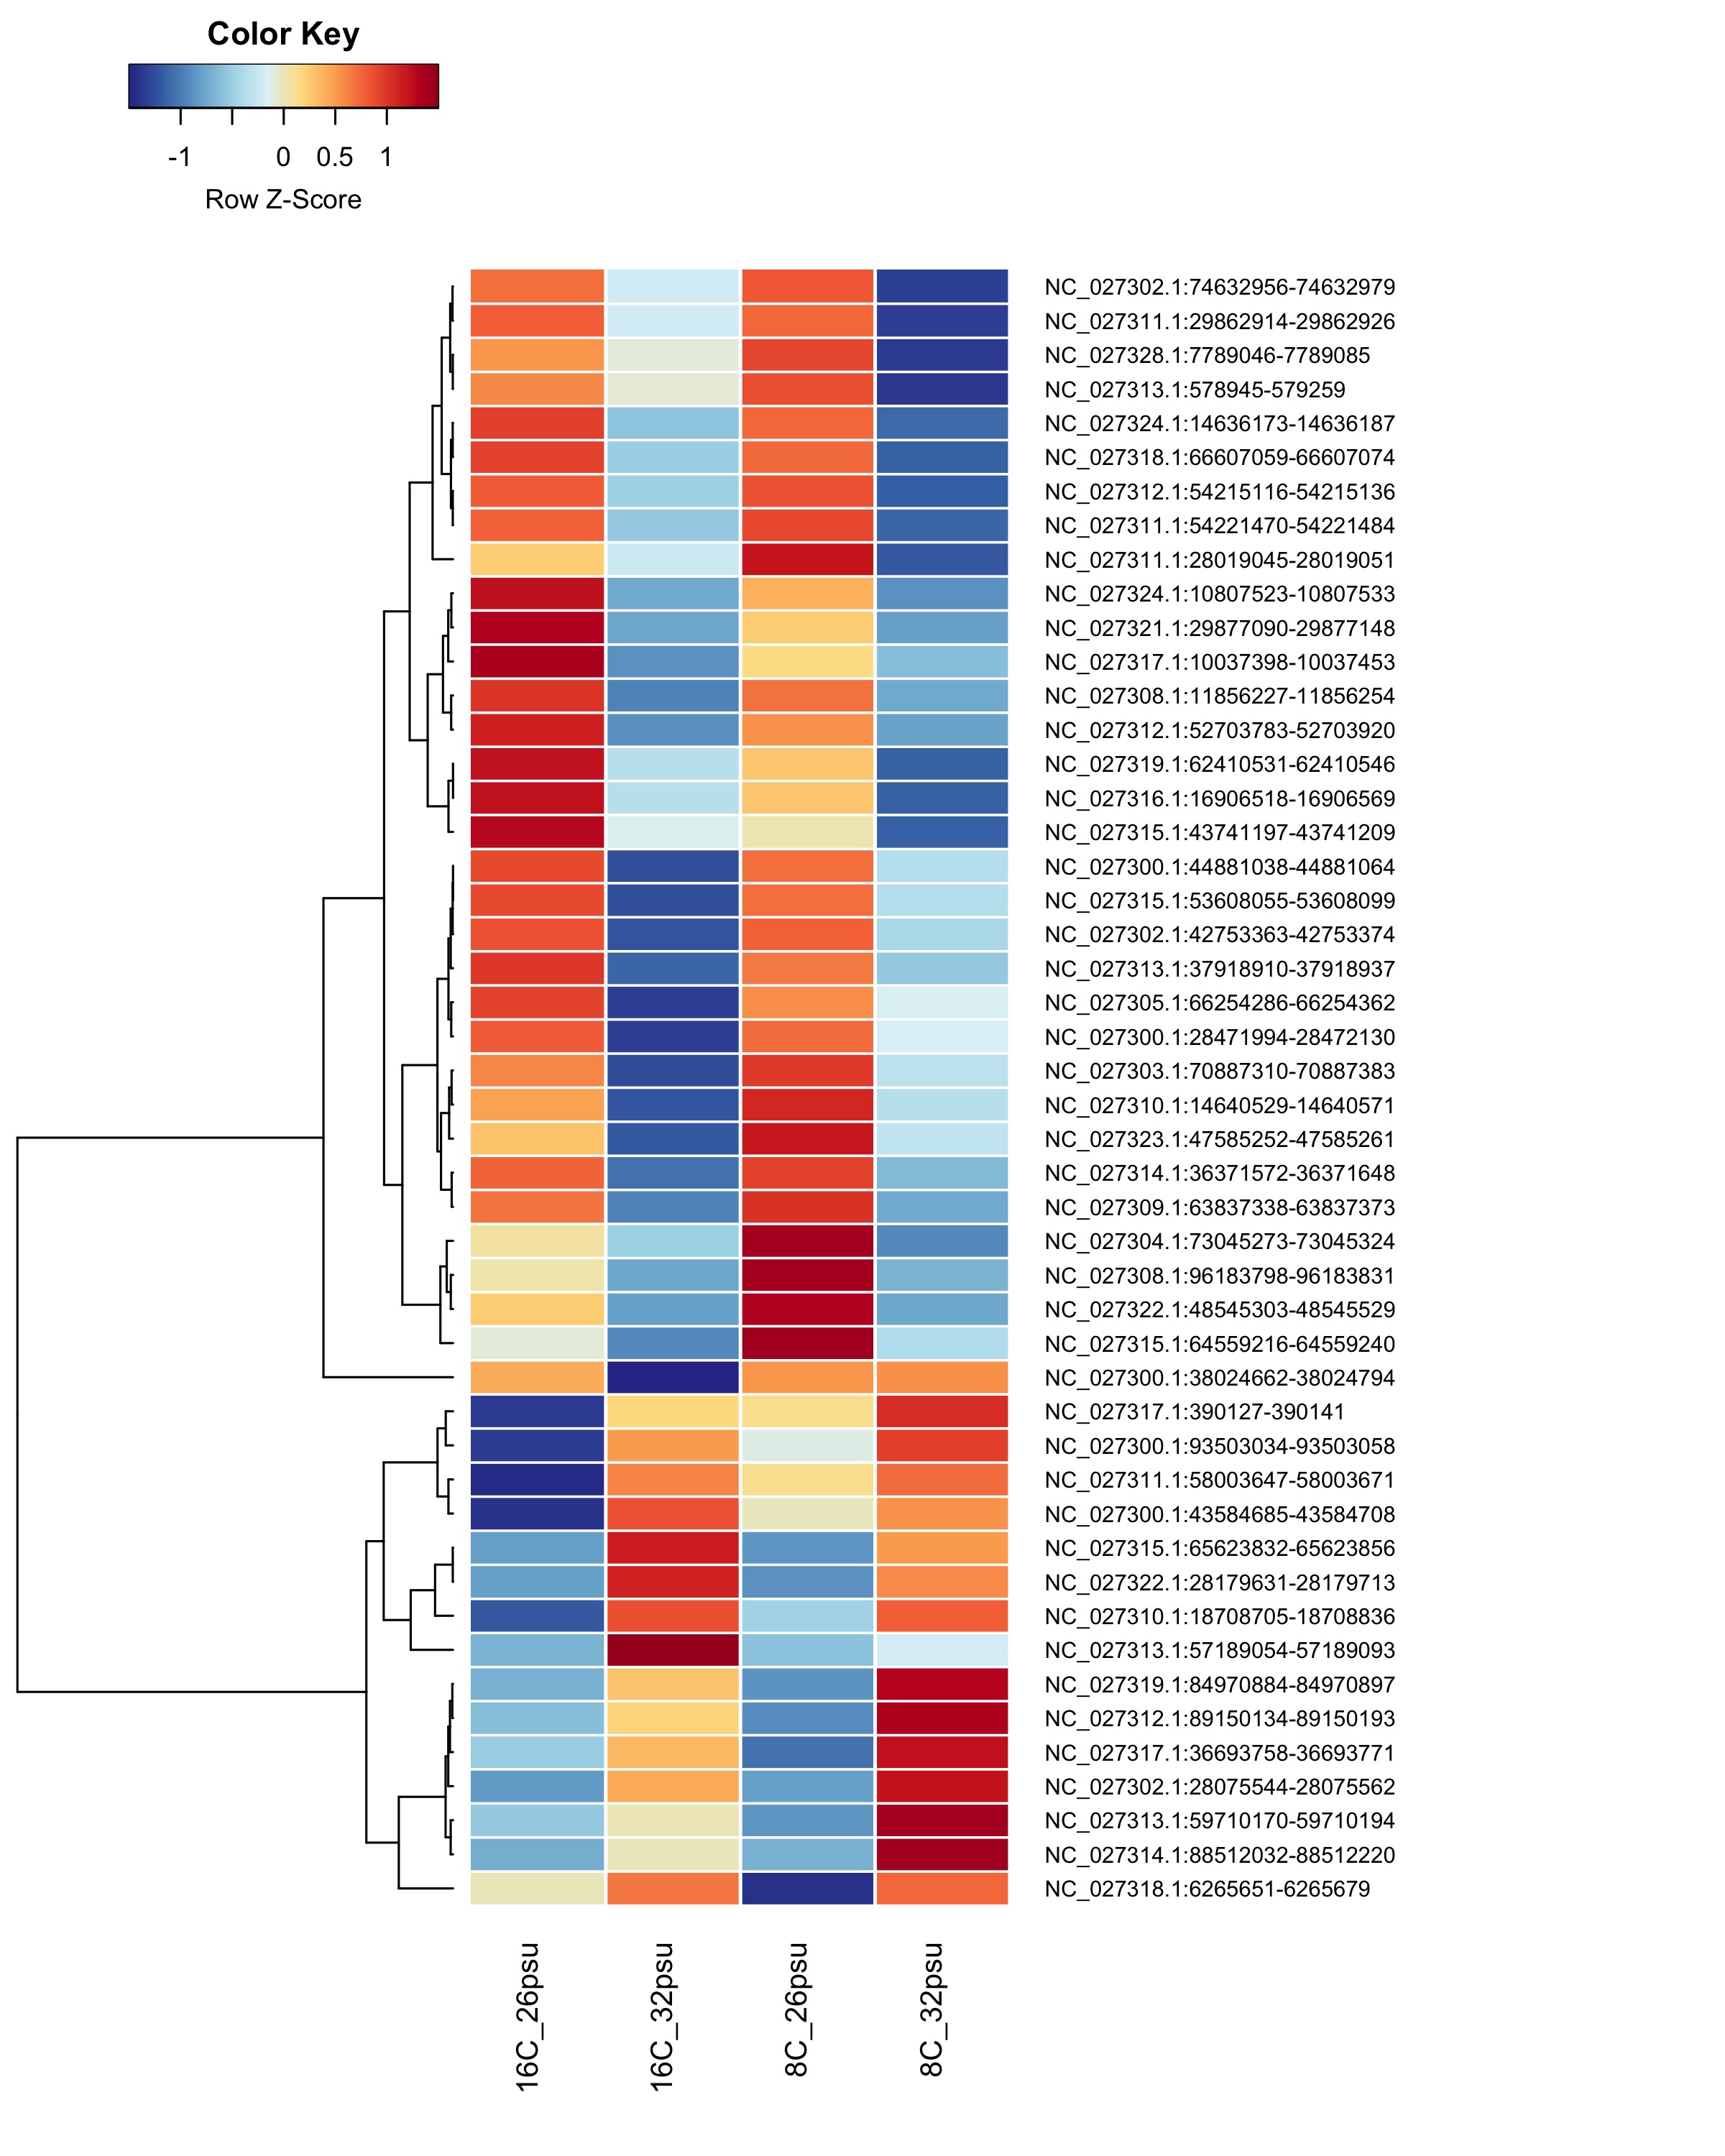
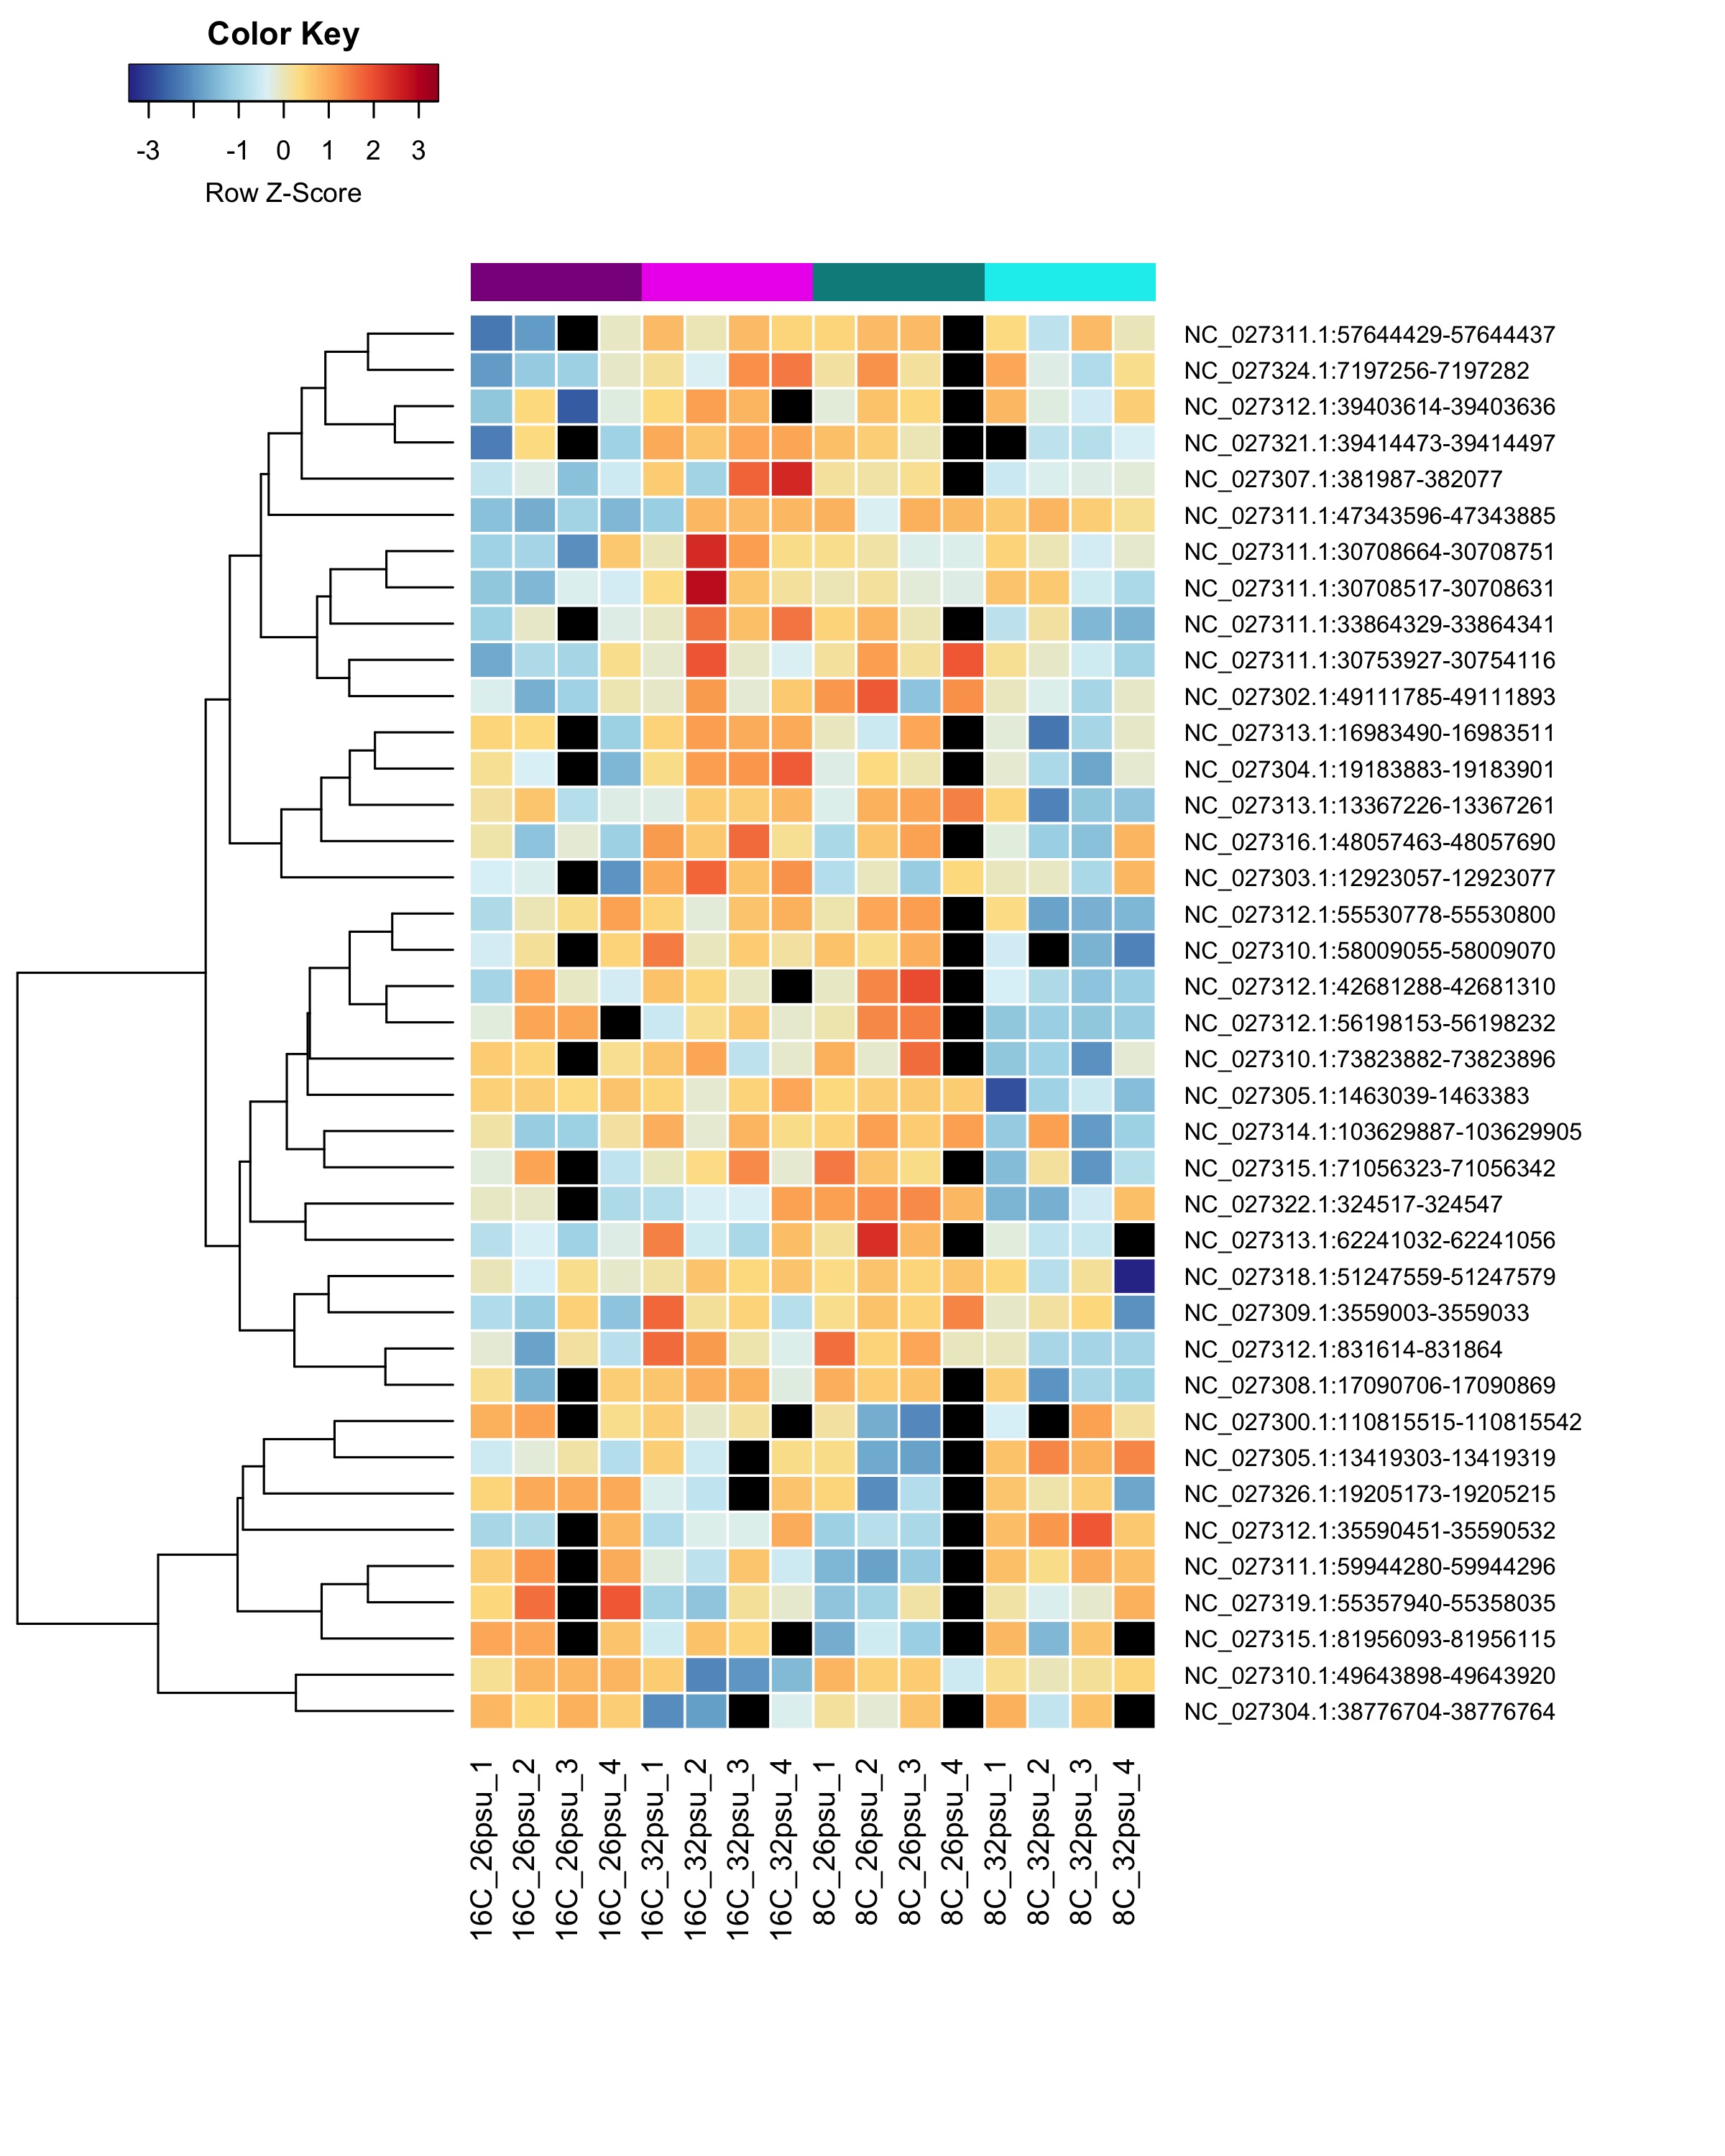
DMRs showing a Salinity:Temperature interaction effect
These DMRs showed only a significant effect from salinity:temperature interaction and not from salinity or temperature alone.
Heatmap showing sample % methylation across treatment groups
Heatmap showing group mean % methylation across treatment groups

Next steps
- genomic feature analysis
- match up with RNAseq data