Contents:
- DMRfind with Destranded vs. stranded data
- Persistent DMRs
- Combining nearby CpG counts
- DMRfind false negatives
- Updated heatmaps
- DMRs compared by ANOVA vs GLM
- Final Conclusions
DMRfind with Destranded vs. stranded data
I recently did GO analysis and replotted heatmaps of DMRs I got from 11/02/2019 DMRfind analysis.
The 11/02/2019 analysis was not done on destranded coverage files and I realized I had done the DMR analysis on destranded coverage files on January 7, 2020 here.
I wanted to compare the outputs from stranded data analysis with destranded data analysis to see if they detect the same DMRs. I expected them to because I employed the same DMRfind parameters (stranded parameters and destranded analysis), the only difference was the input.
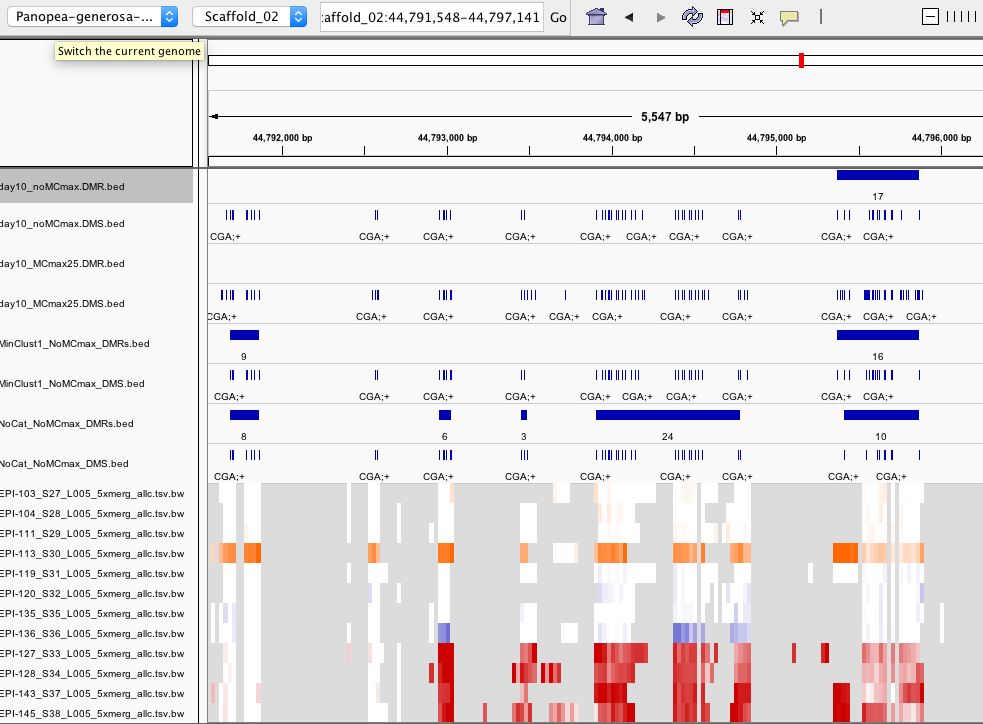
When I checked in IGV (examples below), I saw:
- some DMRs overlapped, but some were not overlapping
- Overall, the destranded analysis identified ~5x more DMRs
- this suggests DMS counts were not combined until after the 5x coverage threshold was applied; even though –mc-max-dist 25 specified, which I thought combined the counts from differentially methylated sites (DMS) that were within 25bp of one another and essentially destranded the data).
IGV screen shots below are for DMRs from Oct24 (stranded), Dec22 (destranded), and Dec23 (destranded all sample comparison-see ‘persistent DMRs’ below)
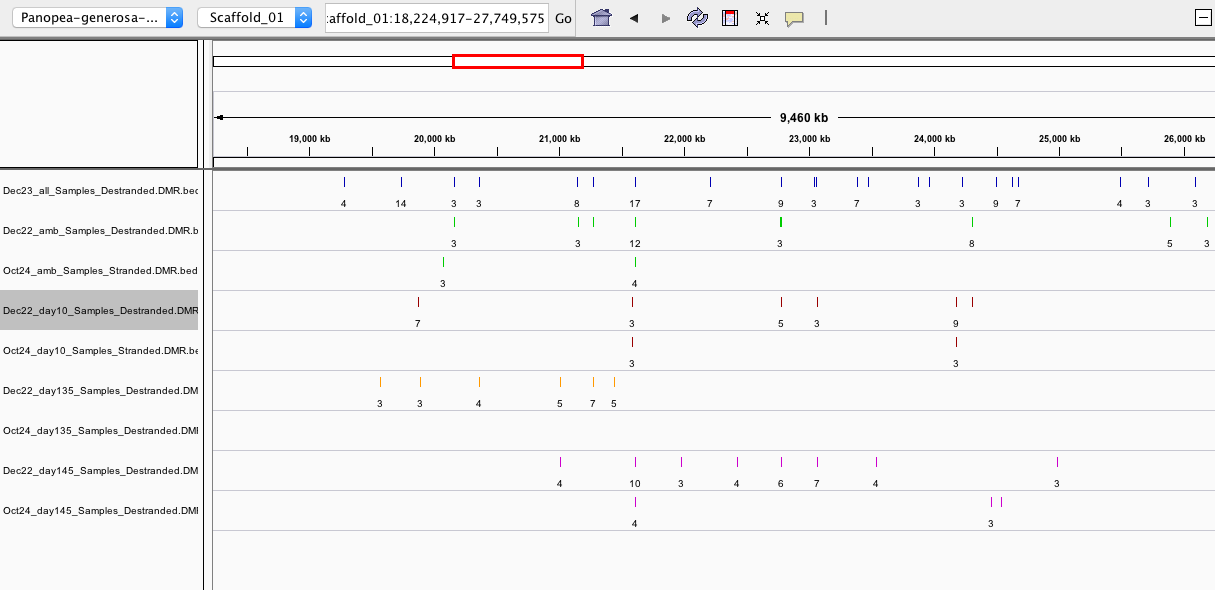
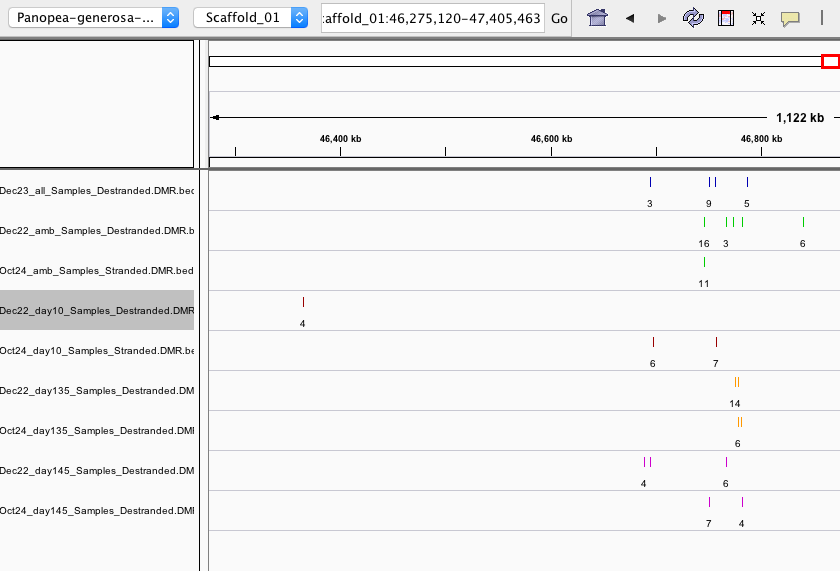
CONCLUSION: After discussing with Steven, we determined it best to proceed with the analysis on the destranded data since that is what Hollie used in her analysis.
Persistent DMRs
In the Jan. 7 analysis I realized that in order to look for persistent DMRs in all the samples (the exact same region occuring across different sample comparisons), that I needed to run DMRfind on all the samples. When I didn’t do this, very few DMRs overlapped between different sample comparisons (all ambient samples vs. all day 10 samples, etc).
- should all samples be included to increase genomic complexity for the methylation beyond genetic variation test (root mean sq test)?
- Steven says to stick with the 4 comparisons
An alternate approach could be comparing features that DMRs overlap with across comparisons rather than DMRs with the exact same coordinates.
Combining nearby CpG counts
This is in reference to the DMRfind –mc-max-dist parameter.
Per the Methylpy DMRfind.py script this parameter “is an integer indicating the maximum distance two sites can be from one another for their methylation counts to be combined. This option helps with low coverage experiments where you may want to leverage the correlation of methylation between sites to get more statistical power.”
- Should MCmax be employed?
- samples do not have even coverage so it seems like a good idea, but I am unsure of the effect of artificially inflating counts; e.g. if this leads to more false positives or if it’s helpful.
I compared outputs of DMRfind with and without using the -mc-max-dist parameter for day 10 samples.
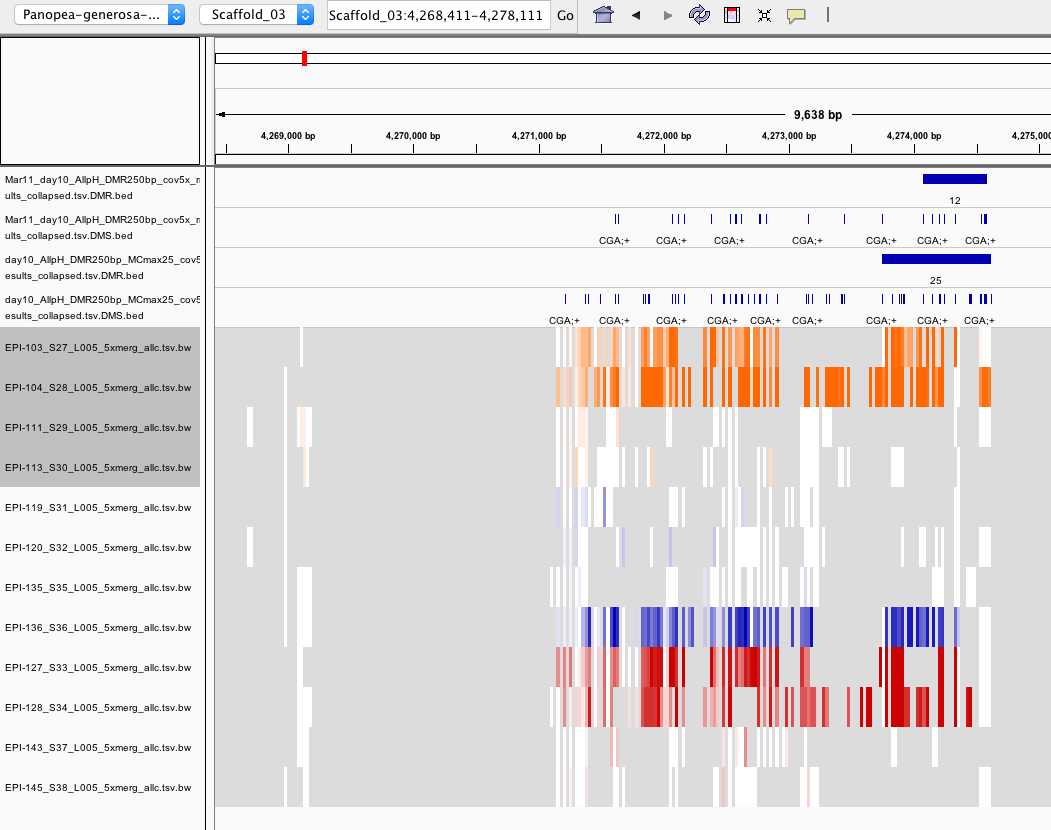
You can see from the screenshot that including –mc-max-dist 25 (the track with name containing ‘MCmax25’) allows for 1) more DMS to be included in the DMR and 2) more DMS to be identified.
However, this screenshot also begs the question why aren’t more DMS included in this DMR? See ‘DMRfind false negatives’ below)
DMRfind false negatives
Why doesn’t DMRfind call this a DMR?
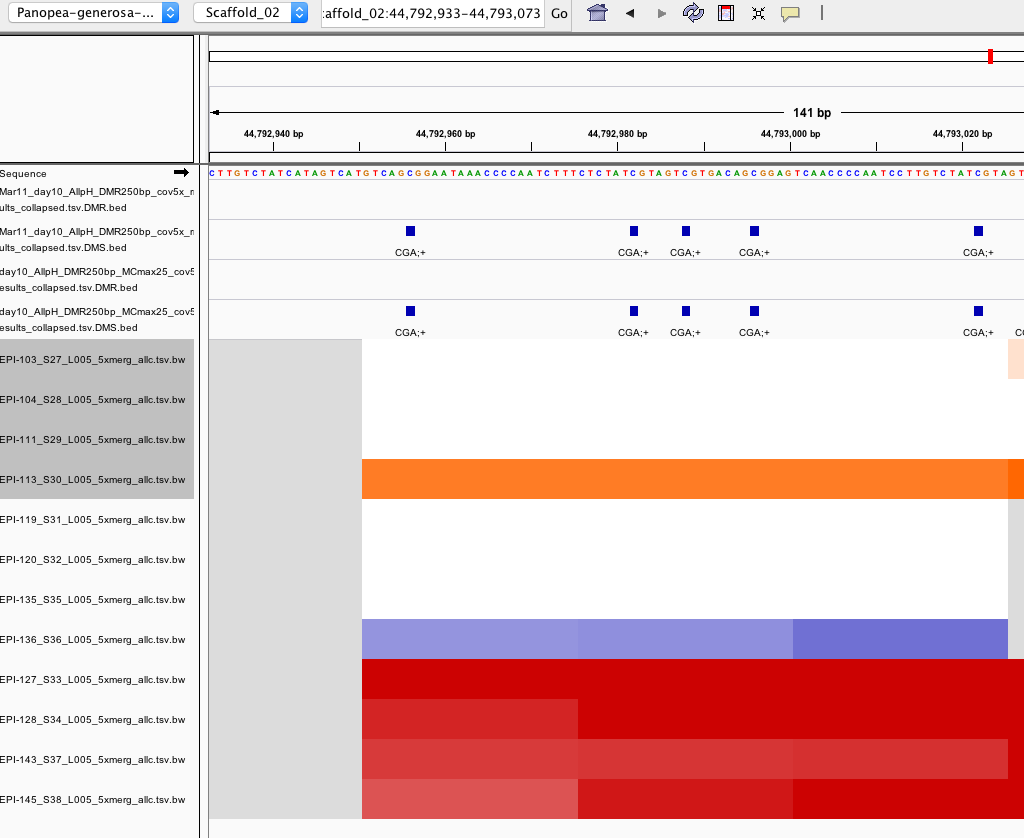
- There are 6 DMS (FDR < 0.01) within a 72 bp window
- These are present in the .tsv.gz results file and the DMS.bed file BUT NOT in the DMR.bed or the ollapsed.tsv file
- could it be the residual cutoff ? This would indicate an error occuring during collapsing sites
- github issue: https://github.com/yupenghe/methylpy/issues/52
- Yupeng said “the sample category is set and by default DMSs are grouped into DMRs only when there are at least 2 samples from one sample category that are either classified as hypo- or hyper-. The issue of these 4 DMSs is that methylpy consider them to hypomethylated only in EPI-113 sample. Thus, they were skipped. There is a parameter –min-cluster where the cutoff can be set. Using –min-cluster 1 should solve this problem.”
- however, adding –min-cluster 1 didn’t solve the problem
- script here (ran on Ostrich): 20200320_DMRfind_minclst1.sh
- output files here: https://gannet.fish.washington.edu/metacarcinus/Pgenerosa/analyses/20200320_DMRfind/
- denoted by prefix ‘Mar16_day10_AllpH_DMR250bp_cov5x_minc1’
- BUT removing category specification solves the problem!
- script here (ran on Ostrich): 20200320_DMRfind_nocat.sh
- output files here: https://gannet.fish.washington.edu/metacarcinus/Pgenerosa/analyses/20200320_DMRfind/
- denoted by prefix ‘Mar20_day10_AllpH_DMR250bp_cov5x_nocat’
- IGV session: 20200320_D10Samples_FNcheck.xml
- IGV screenshot shows the only time this region is detected as a DMR is when sample categories are not specified

- IGV screenshot shows more DMRs are called when sample categories are not specified
- however, adding –min-cluster 1 didn’t solve the problem
- CONCLUSIONS:
- do not specify sample categories
- Yupeng said “the sample category is set and by default DMSs are grouped into DMRs only when there are at least 2 samples from one sample category that are either classified as hypo- or hyper-. The issue of these 4 DMSs is that methylpy consider them to hypomethylated only in EPI-113 sample. Thus, they were skipped. There is a parameter –min-cluster where the cutoff can be set. Using –min-cluster 1 should solve this problem.”
- proceed with no categories
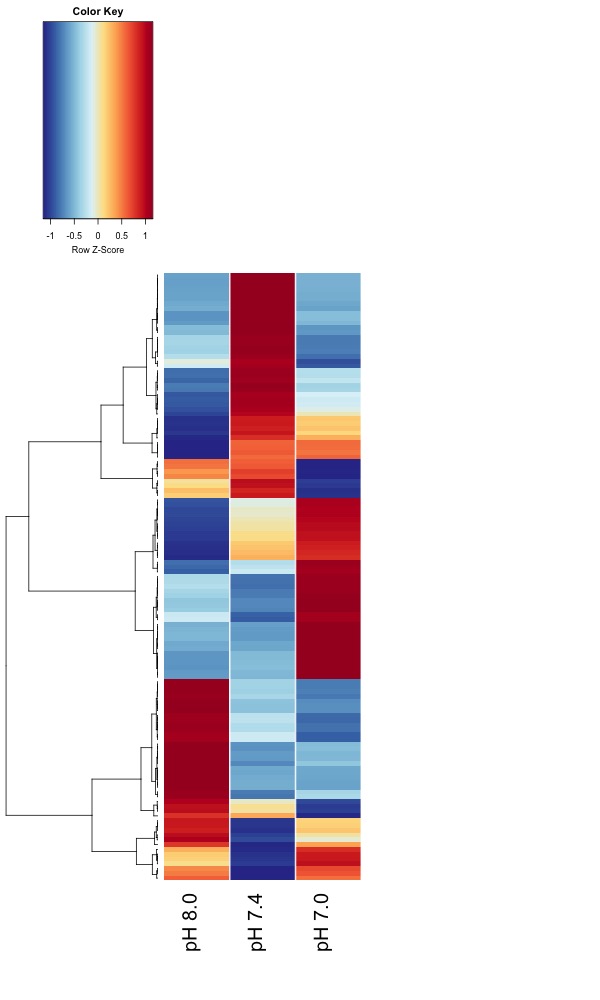
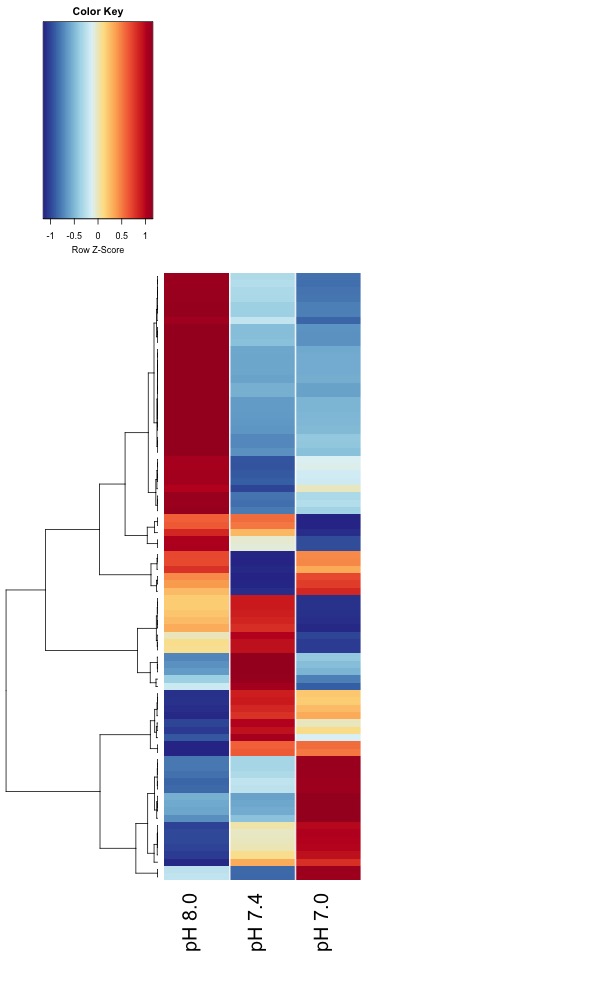
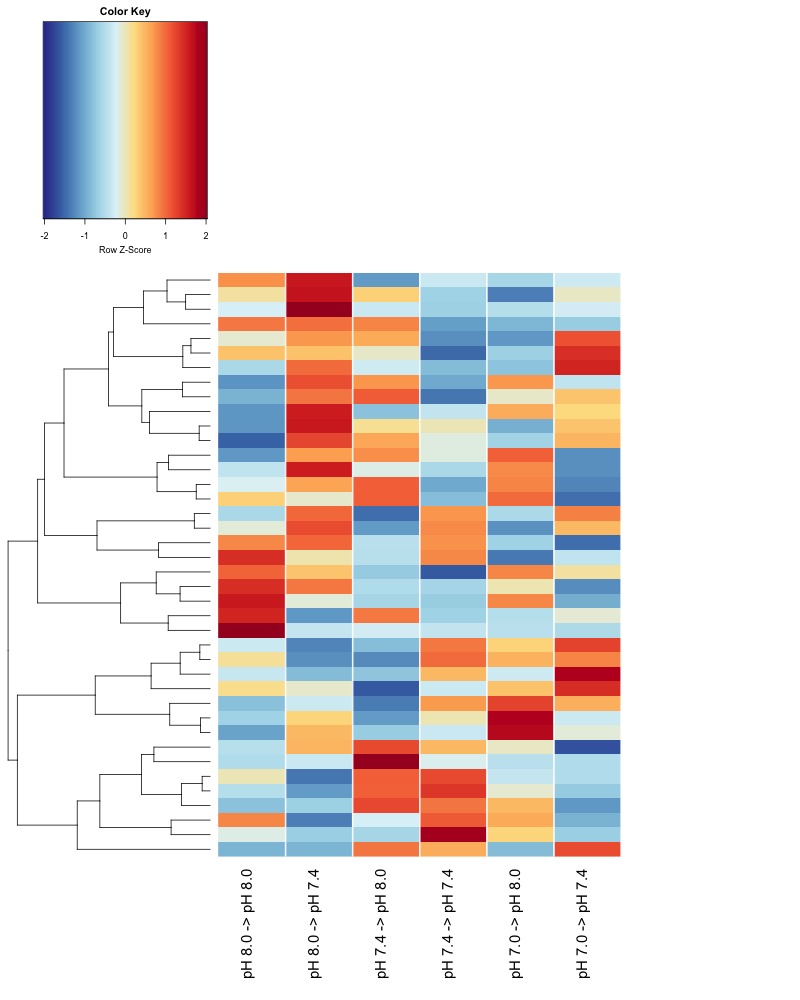
Updated heatmaps of AOV sig. DMRs from destranded data
I updated the heatmaps from Jan. 7 analysis for DMRs significant at an uncorrected ANOVA p value < 0.05.
Ambient Sample comparison
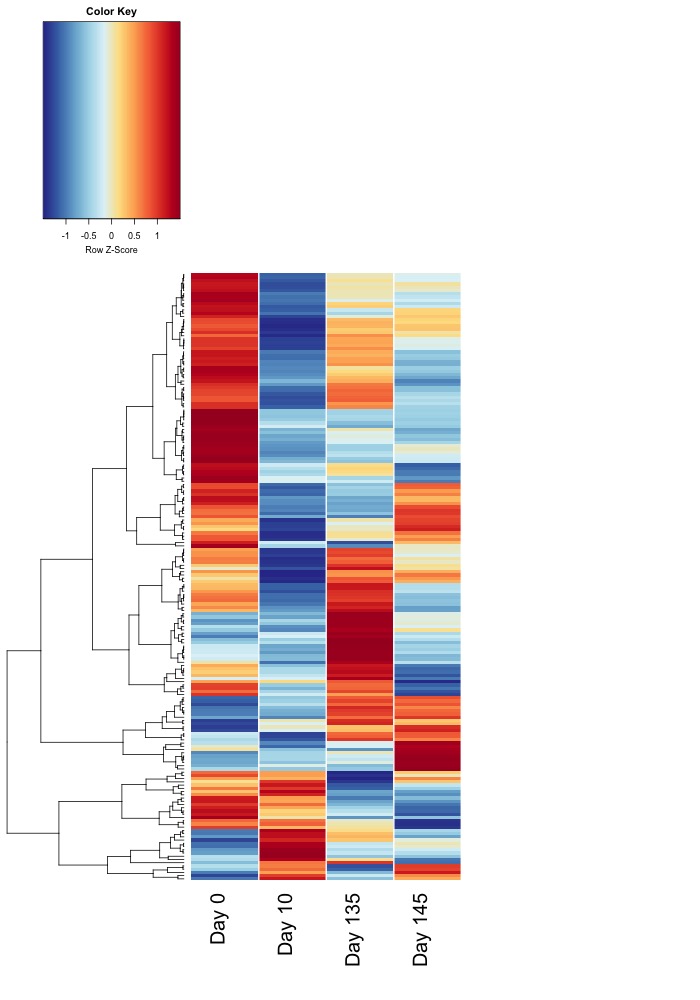
Day 10 Sample comparison
Day 135 Sample comparison
Day 145 Sample comparison
DMRs compared by ANOVA vs GLM
Since Hollie did a GLM for DMG analysis, we’ve discussed that it might make sense for me to also use a GLM for identifying DMRs.
To run a GLM, I had to extract counts from the DMS data and did so using this jupyter notebook 20200311_ExtractDMSCounts_from_20191222_data.ipynb. I then created this Rmarkdown to run the GLM DMR_mC_nmC_counts_GLM.Rmd from this R project 20200312_ExtractDMSCounts_from_20191222_data.Rproj.
I only ran the GLM on the ambient samples and am very wary of the GLM results because nearly all of the 1228 DMRs is significant at FDR-corrected p.value < 0.05:
- ambDMR_glm_results.csv
- CONCLUSIONS: stick with ANOVA for now
Final Conclusions
- use destranded data
- perform DMRfind separately for each comparison rather than on all the samples together
- don’t use –mc-max-dist DMRfind parameter
- don’t include sample categories in DMRfind
- use ANOVA not GLM to compare DMRs across treatment groups