Steven generated destranded (“merged”) coverage files from Bismark .cov output.
- Files are here: https://osf.io/yem8n/files/ under “bismark_coverage_files” under “merged_tab”.
- I believe Steven did this using this notebook:
Analysis below was done 12/20/2019 - 01/07/2020
Global methylation analysis
- Using this jupyter notebook 20191222_GlobalMethylation_5x_CpGs.ipynb I created this table allc_5x_CpG.txt which has the following columns:
- Sample
- Number of mCs
- Number of total Cs
- % methylation
- Using this R project 20191222.Rproj and this R markdown script Overall_CpG_analysis.Rmd I generated the following figures:
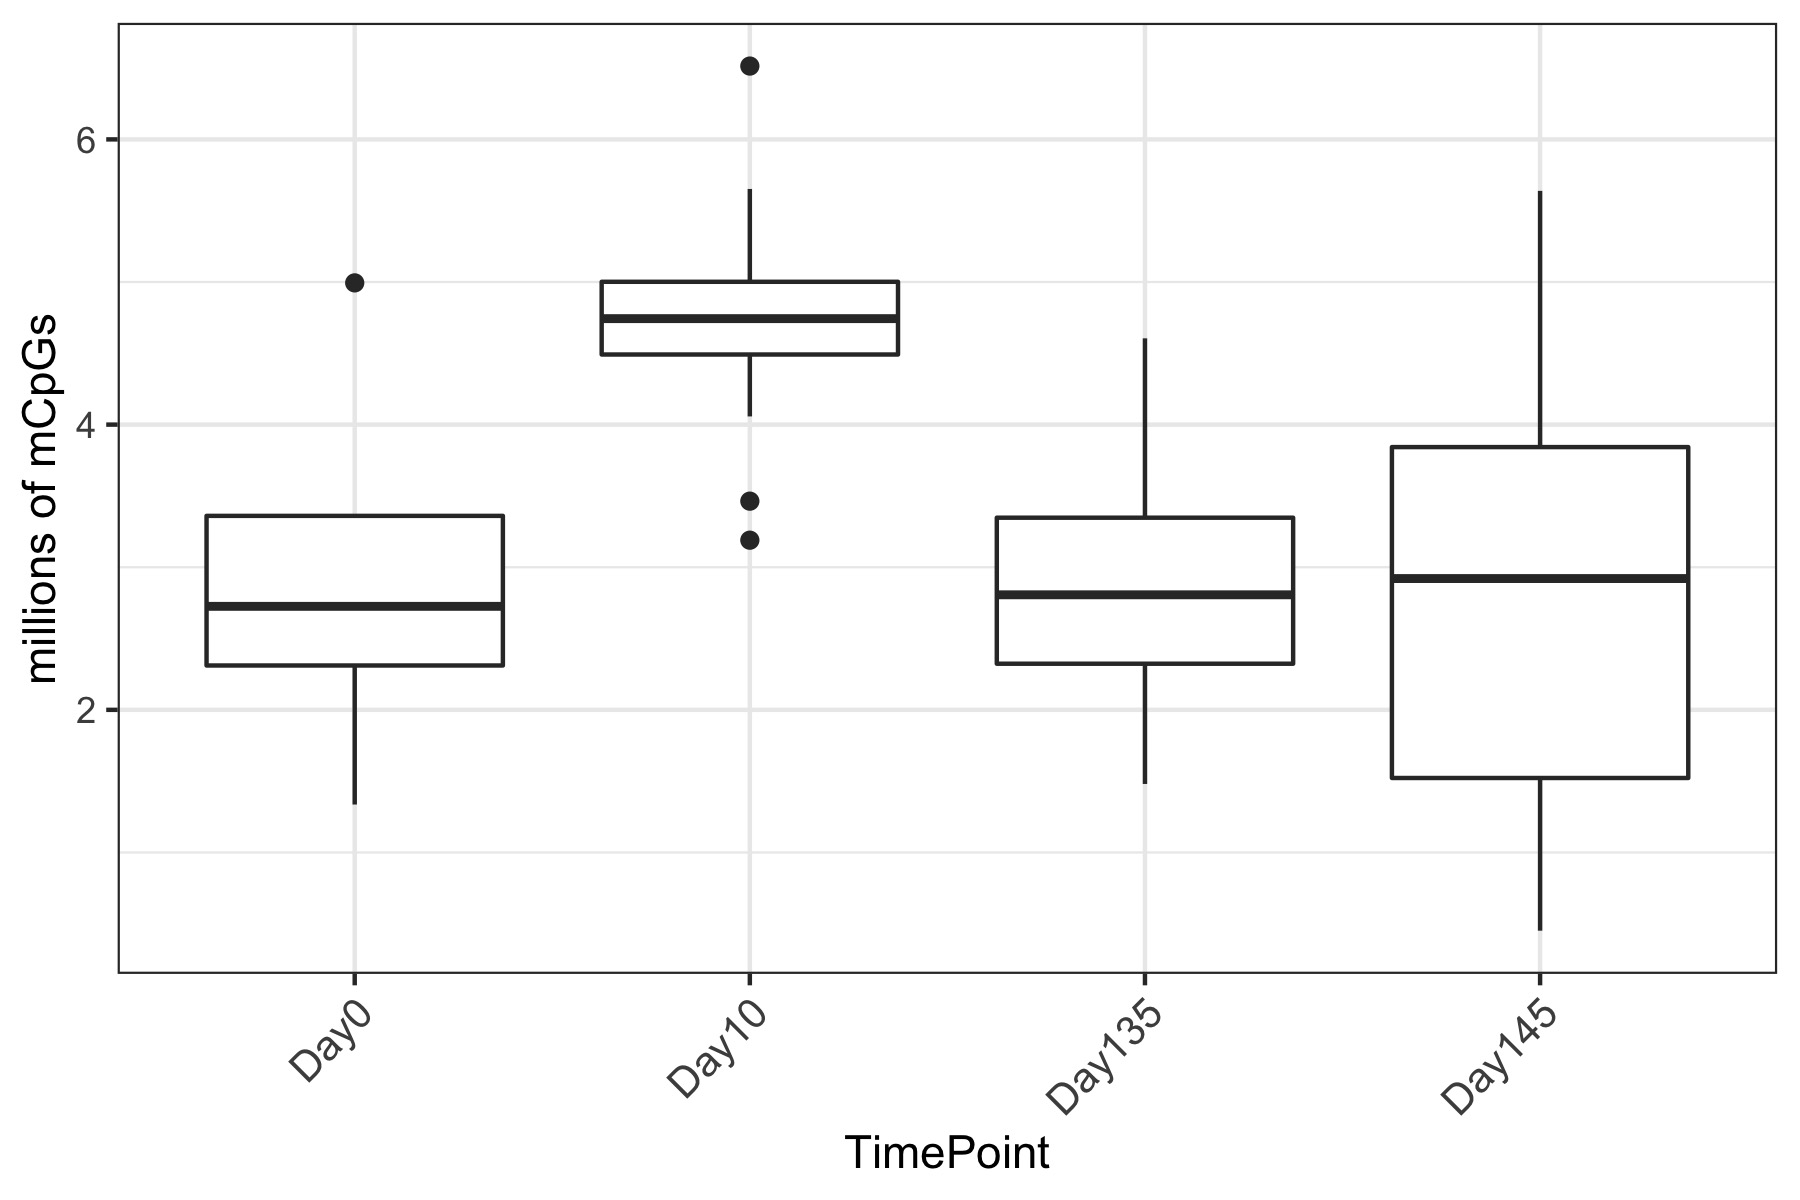
- number of mCpGs across samples from different time points
- percent CpG methylation for each sample group

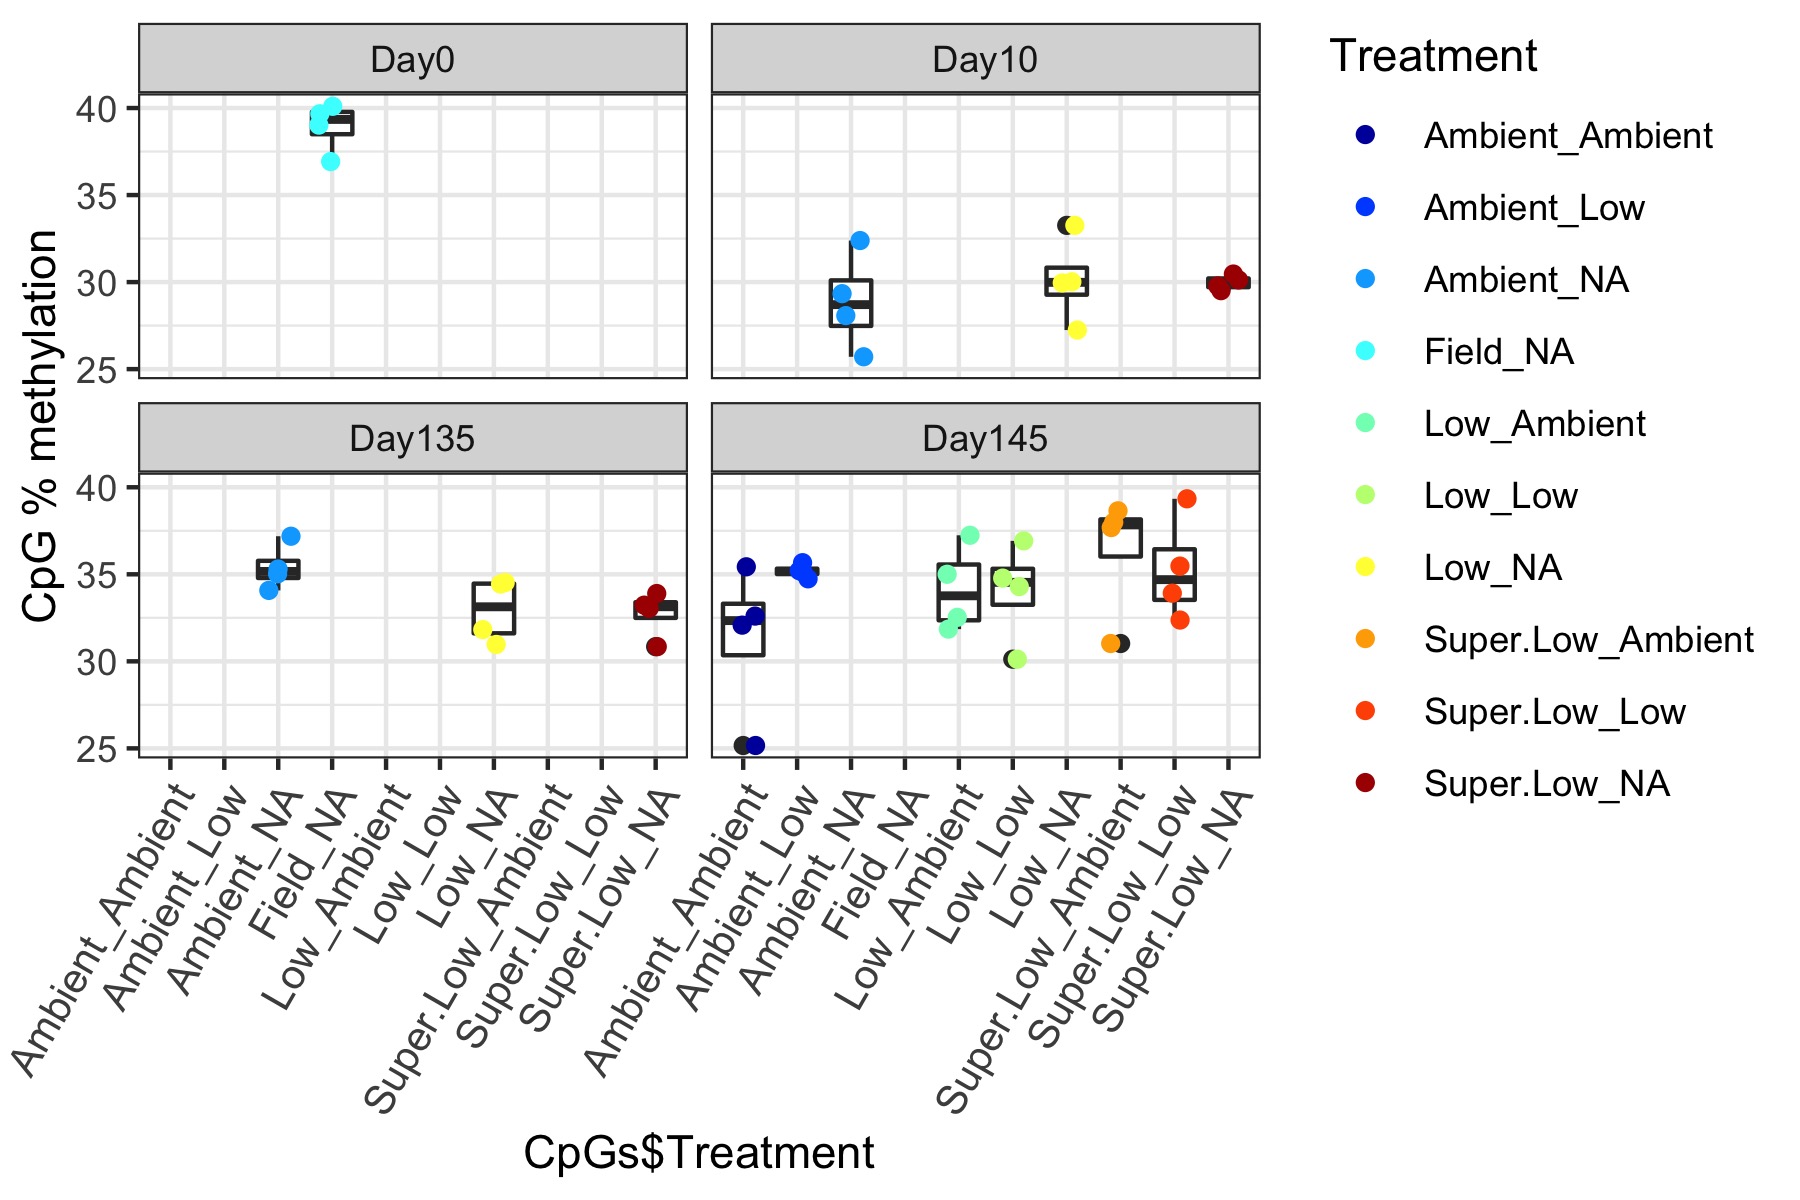
- percent CpG methyaltion for each sample group facetted by time
- number of mCpGs across samples from different time points
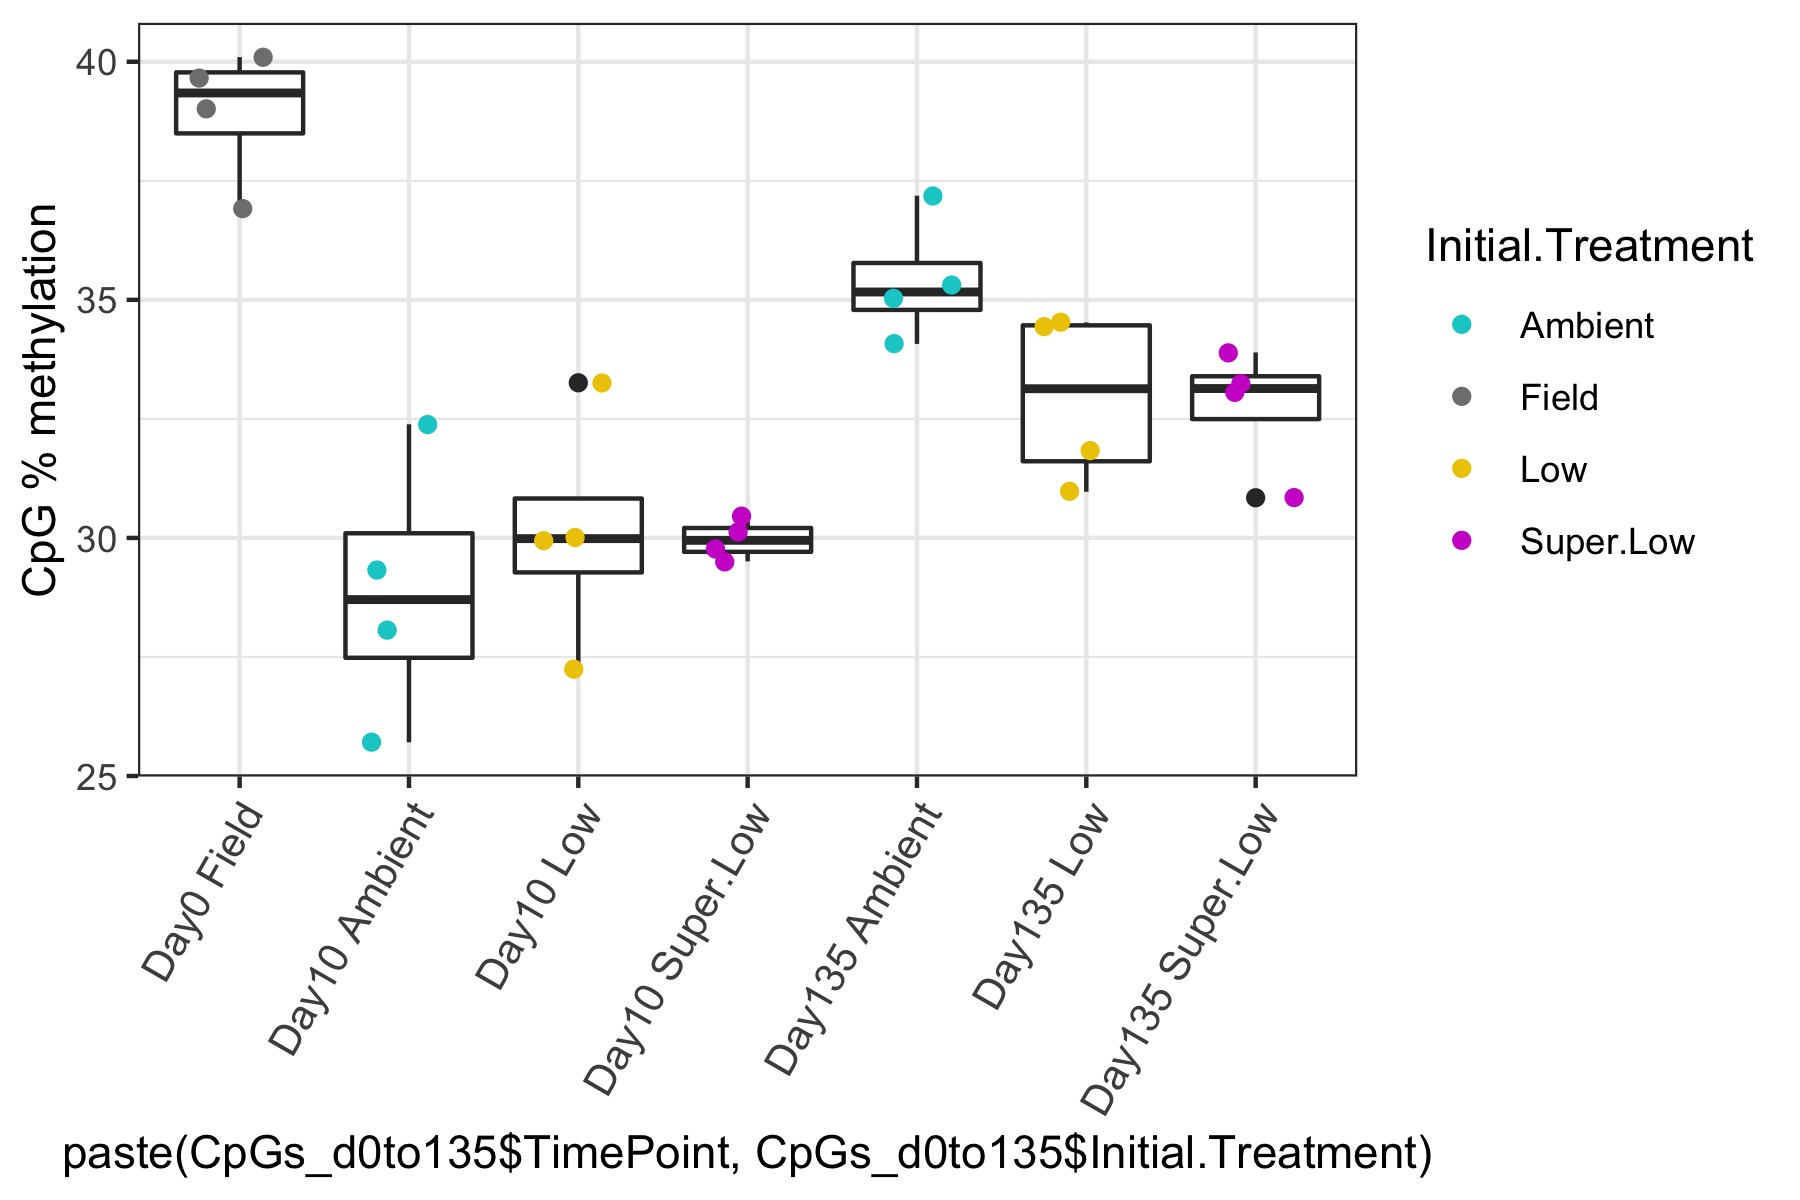
- I used this R script CpG_analysis_d0to135.Rmd to generate this figure for percent CpG methylation for samples from day 0, day 10, and day 135 for PAG presentation:
DMRs from 5x destranded coverage files
Convert 5x.tab files to Methylpy allc format
- Used this jupyter notebook 20191222_DMRfind_5xmerg.ipynb to convert 5x.tab files to allc format on my account on Ostrich
- previously attempted to do this on 12/20 using this jupyter notebook 20191220_DMRfind_5xmerg.ipynb but it turned out the last column in the 5x.tab file is in fact the number of unmethylated Cs AND NOT the total number of Cs so that is why I could not get DMRfind to work. See issue posted here.
- copied new allc.tsv files to Gannet using same notebook 20191222_DMRfind_5xmerg.ipynb
Running Methylpy DMRfind for all 4 comparisons
- Ran DMRfind through this jupyter notebook 20191222_DMRfind_5xmerg.ipynb first for the Day 10 sample comparison
- it worked, so next tried to run DMRfind for other comparisons (all ambient samples, day 145 samples, and day 135 samples) but the connection on Ostrich kept timing out so I ran the code in different screen sessions:
- 45061.amb_DMR
- 45114.day135_DMR
- 52167.day145_DMR
- all ran successfully. I attempted to save the screen output as a log file (ctrl + A : and then hardcopy -h filename) but it was only able to save some of the output. Next time I need to do something like this.
- commands run and log files are here:
- DMRfind output:
- copied all DMRfind output to Gannet in this jupyter notebook: 20191222_DMRfind_5xmerg.ipynb
- all output files (summary files, bed files, etc.) are here: https://gannet.fish.washington.edu/metacarcinus/Pgenerosa/analyses/20191222/
- day10 summary file
- 930 DMRs
- day135 summary file
- 585 DMRs
- day145 summary file
- 998 DMRs
- all ambient samples summary file
- 1227 DMRs
- day10 summary file
Filter DMRs for coverage in 3/4 samples per group
- Used this R markdown script mcmax25_DMR_cov_in_0.75_SamplesPerCategory.Rmd to filter DMRs for coverage in 3/4 samples per group for each DMRfind output
- after filtering:
- day10: 732 DMRs
- day135: 414 DMRs
- day145: 394 DMRs
- all ambient: 704 DMRs
- after filtering:
Running group statistics (ANOVA) on DMRs
- Using this script MCmax25_asinT_groupStats.Rmd I performed ANOVA on all the DMRs from each comparison.
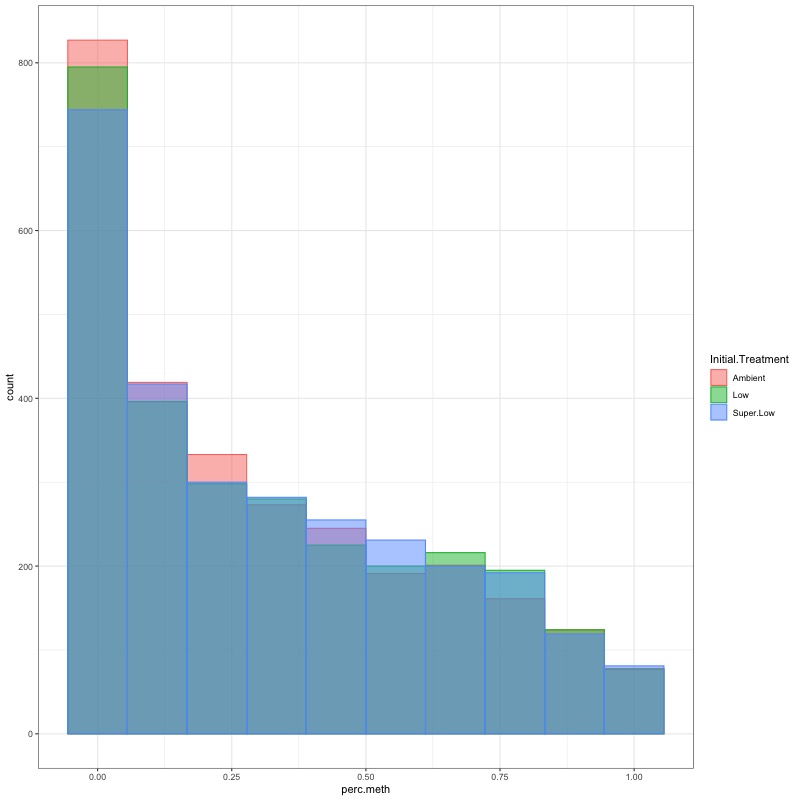
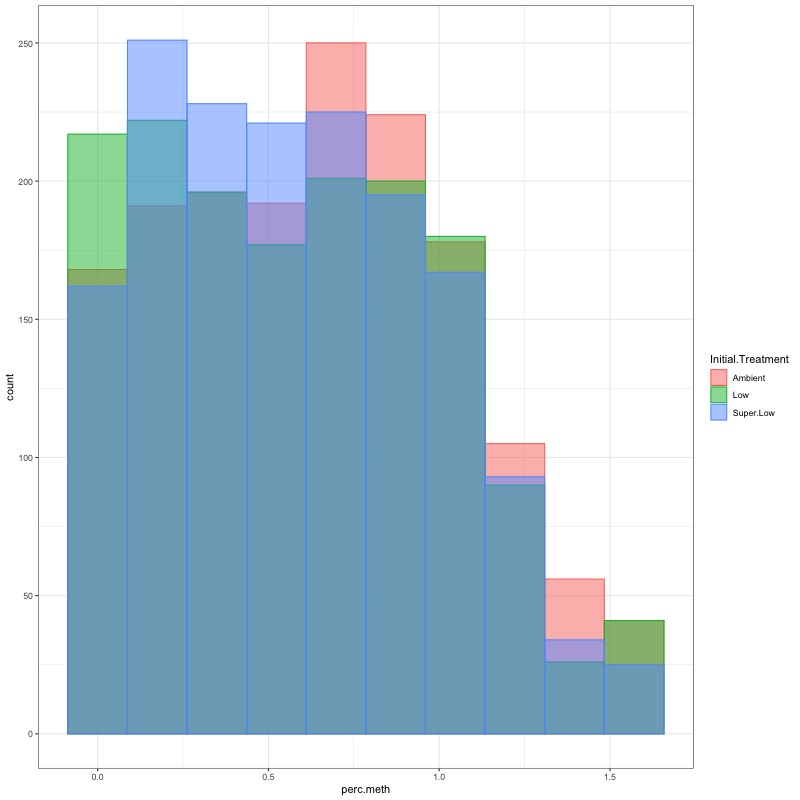
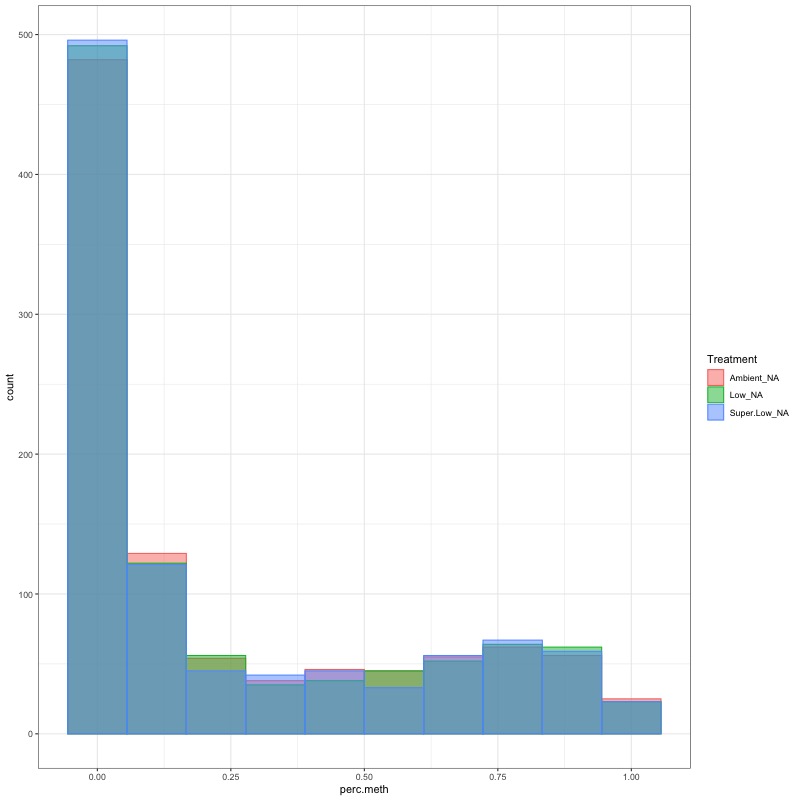
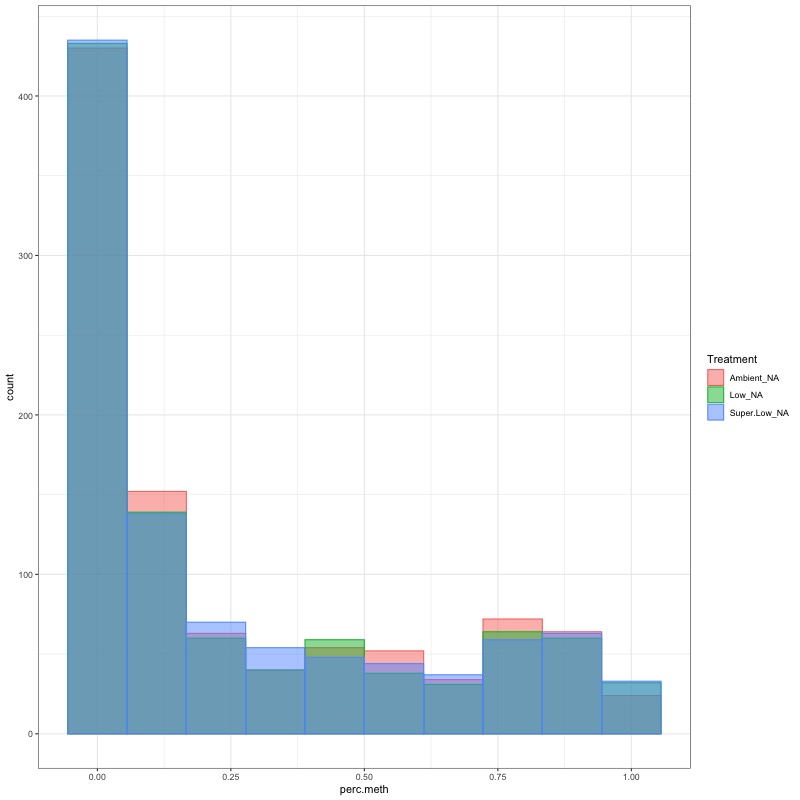
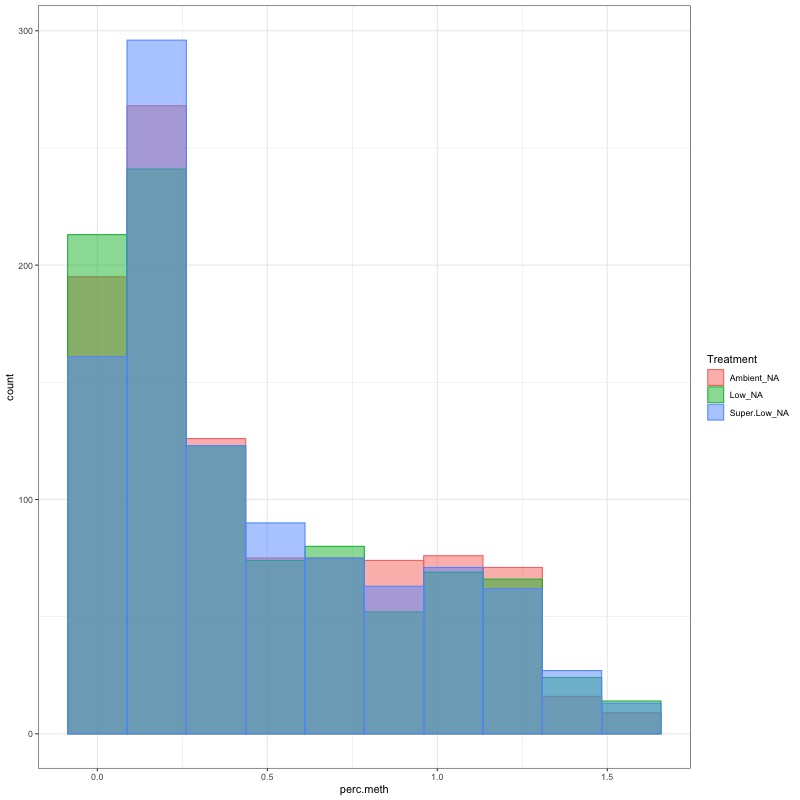
- CHECK DATA DISTRIBUTION: First looked at each groups’ % methylation distribution
- All ambient sampels:

- Day 10 samples:
- Day 135 samples:
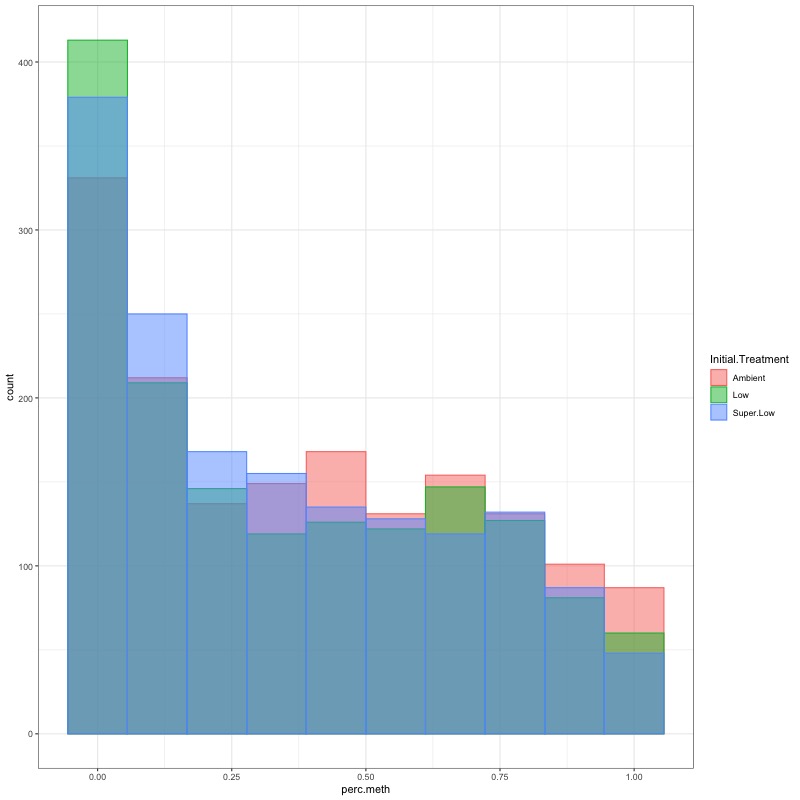
- Day 145 samples:
- All ambient sampels:
- TRANSFORM DATA: No distribution is normal so performed arcsin square root transformation and here’s how the distrubtions changed:
- All ambient sampels:
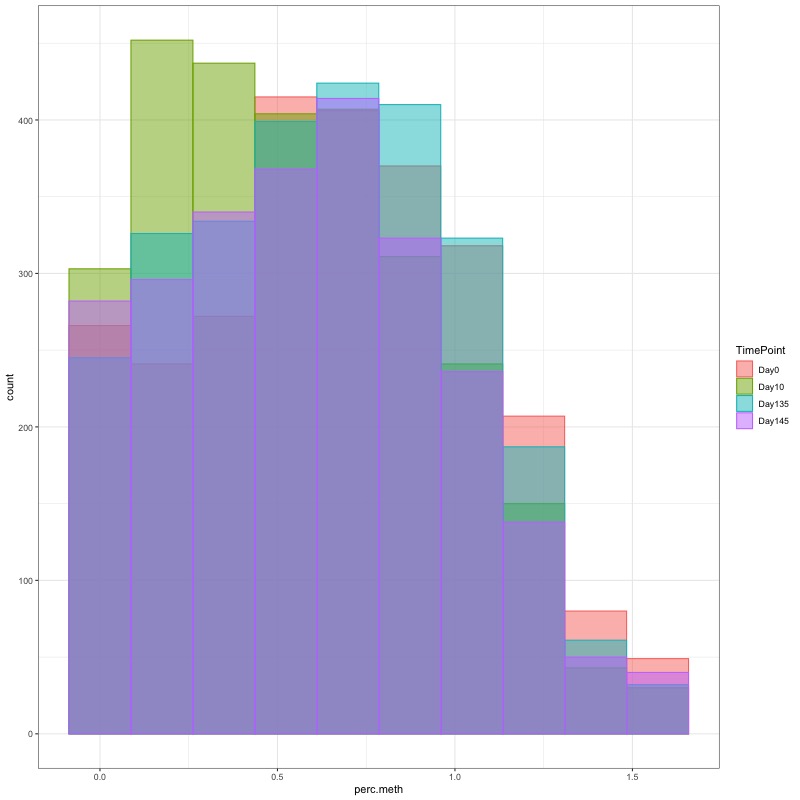
- Day 10 samples:
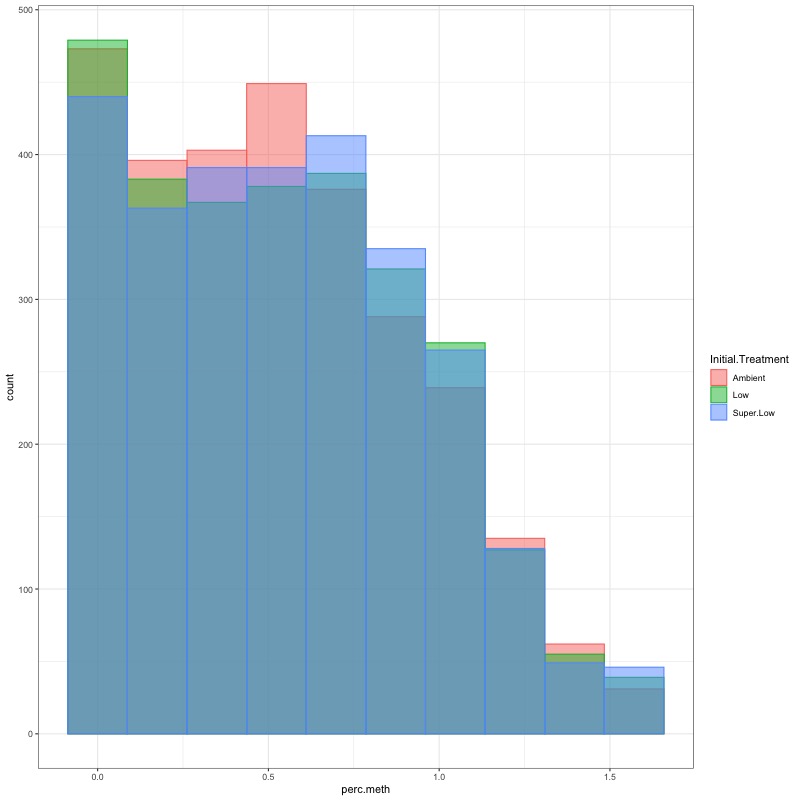
- Day 135 samples:
- Day 145 samples:
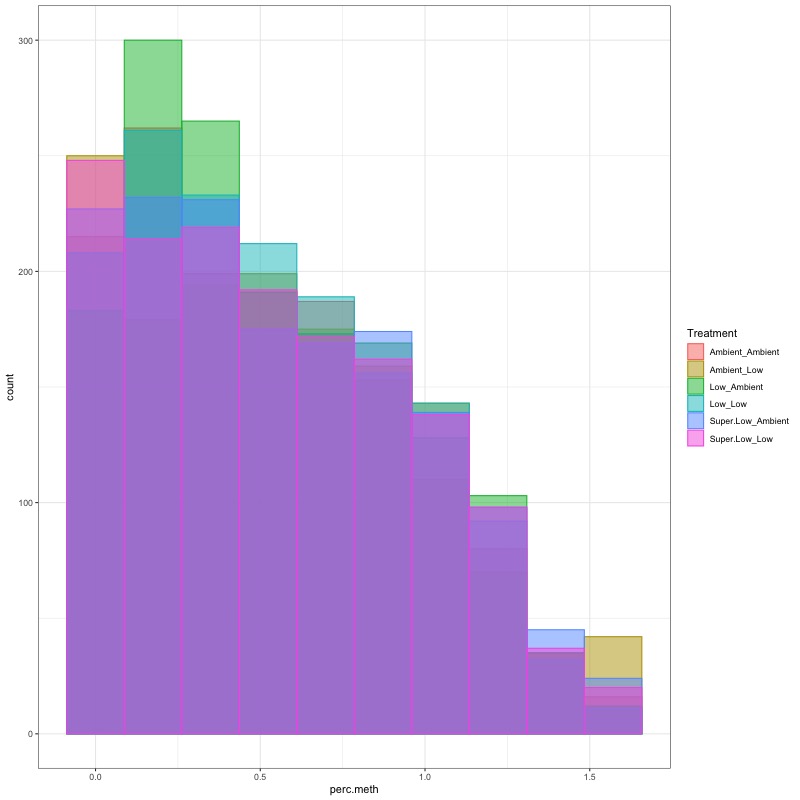
- All ambient sampels:
- Perform ANOVA on transformed data
- ANOVA summary tables:
- day 10: d10DMR_1way_aov_pH_modelsumm.csv
- day 135: d135DMR_1way_aov_pH_modelsumm.csv
- day 145: d145DMR_1way_aov_pH_modelsumm.csv
- all ambient samples: ambDMR_1way_aov_pH_modelsumm
- ANOVA summary tables:
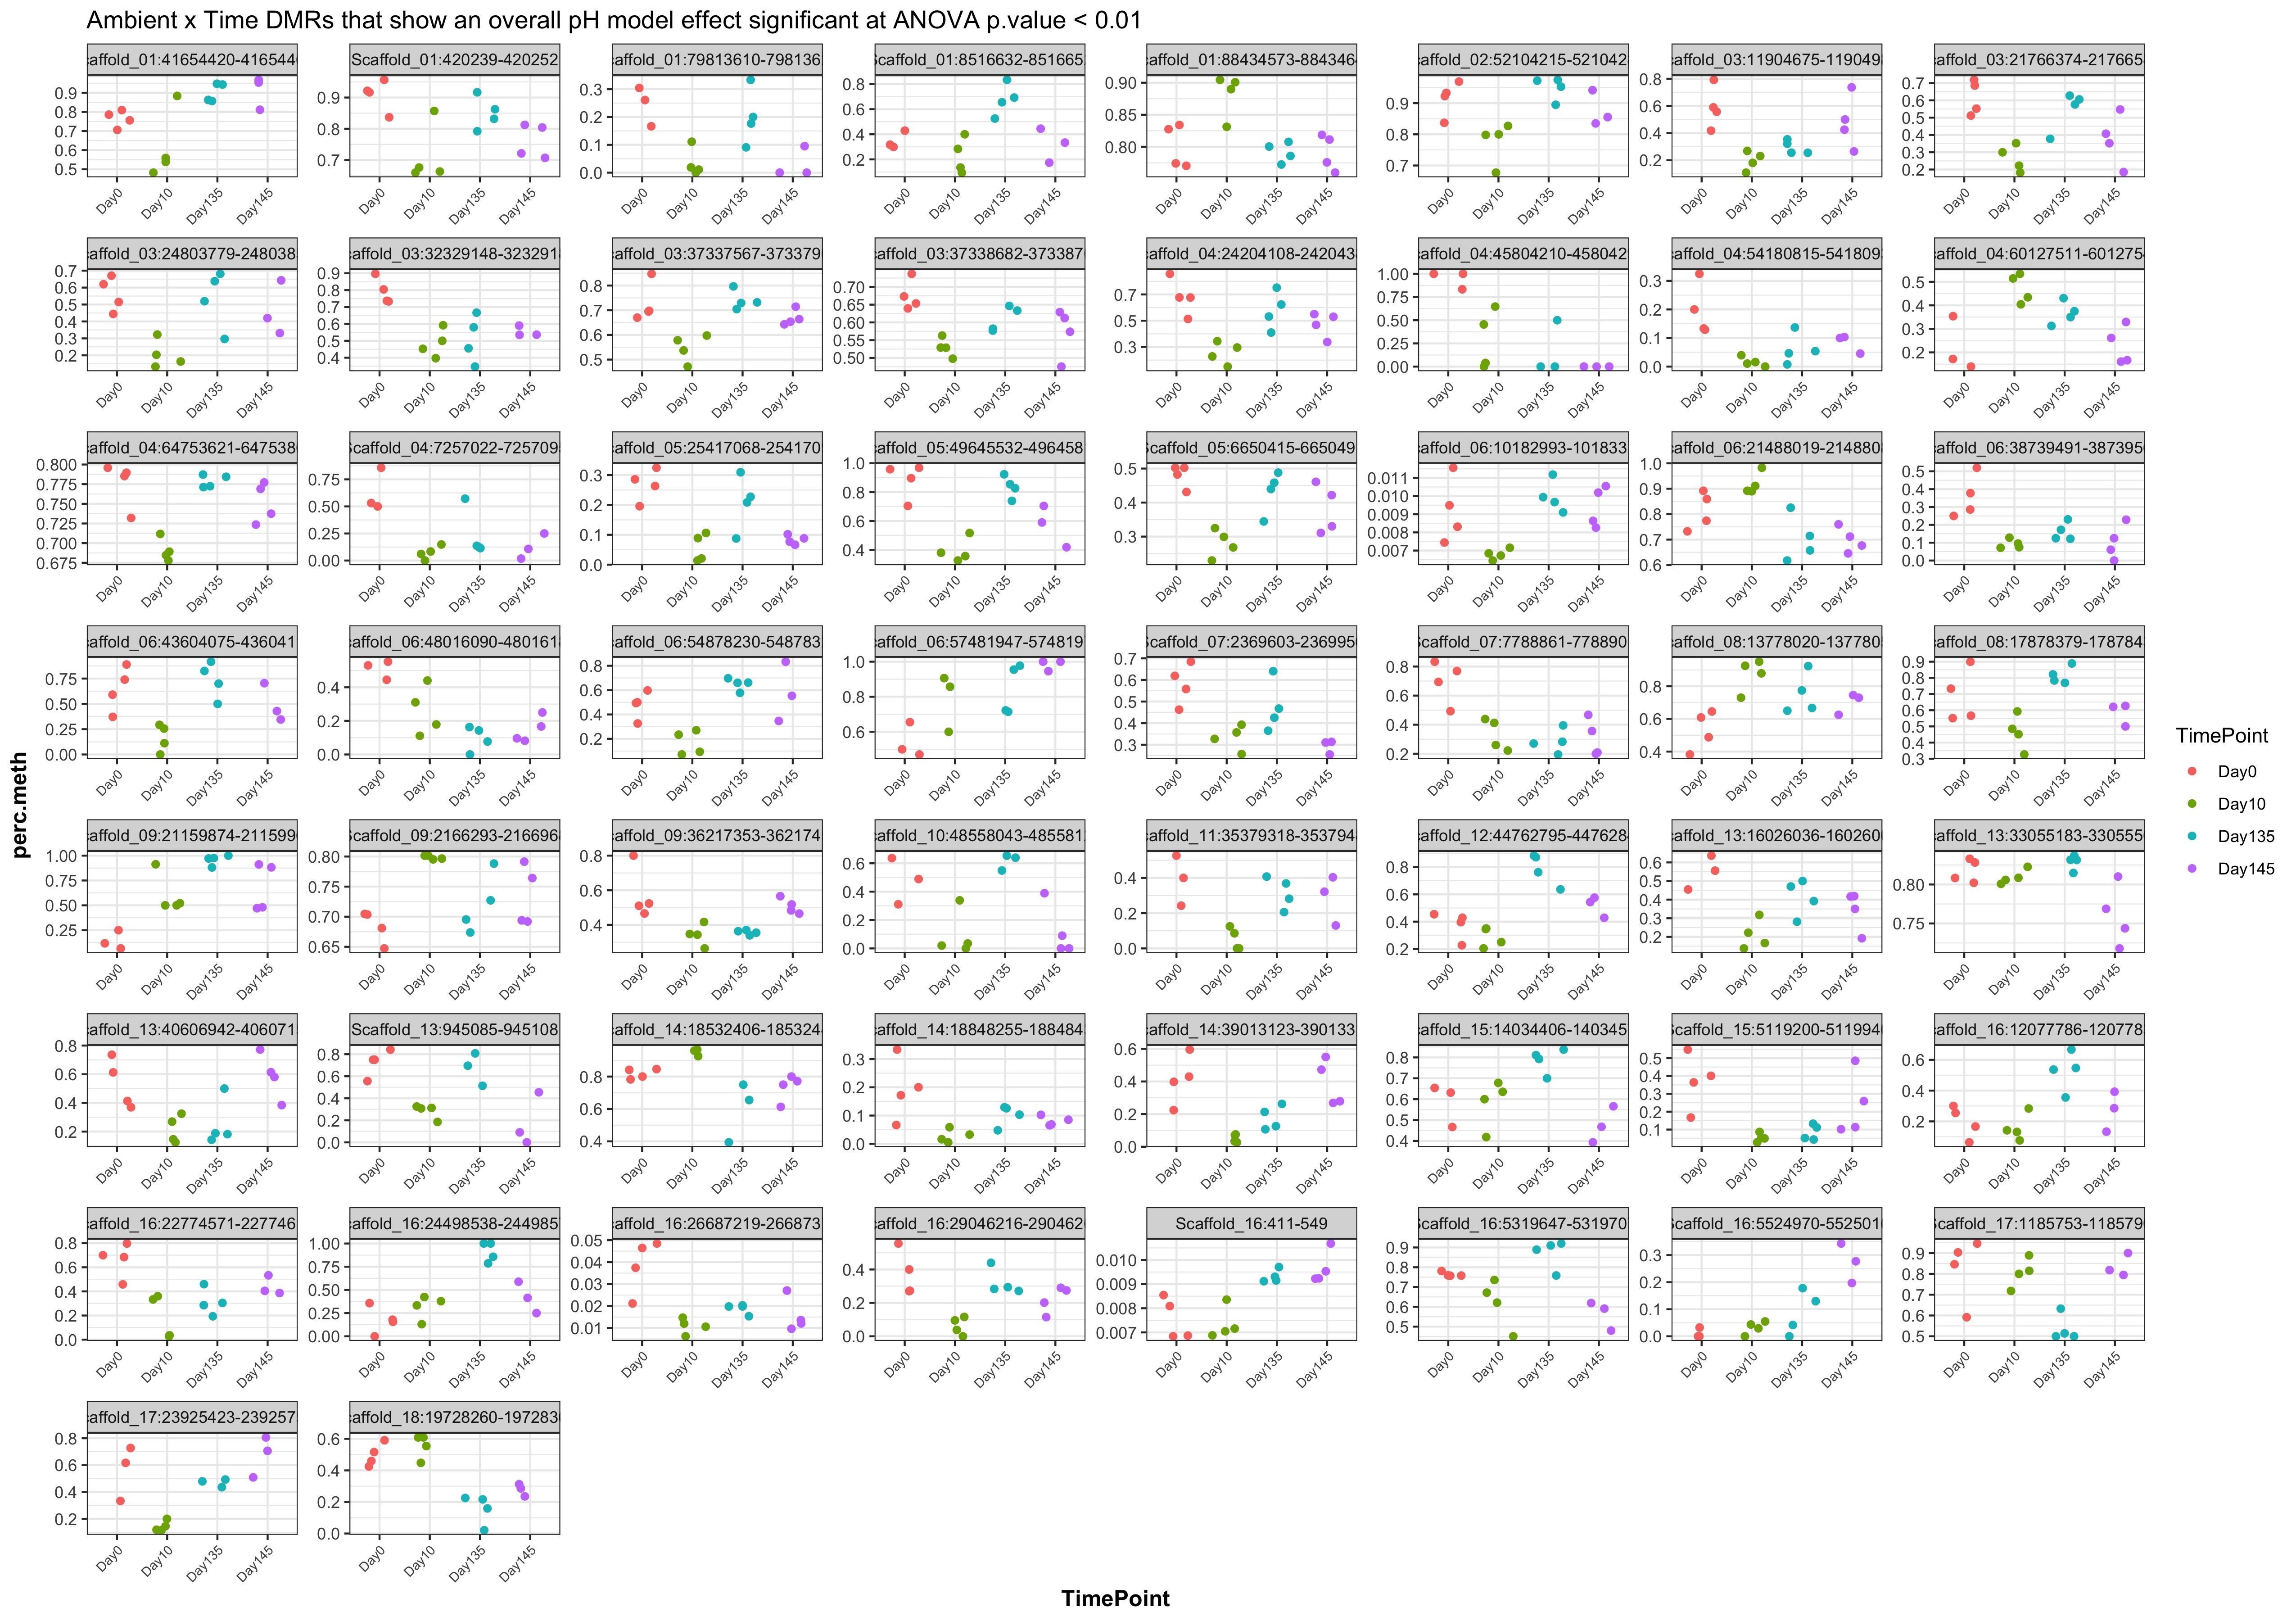
- Plot % methylation x group for significant DMRs
- DMRs significant at p value < 0.01
- All ambient samples:
- Day 10 samples:
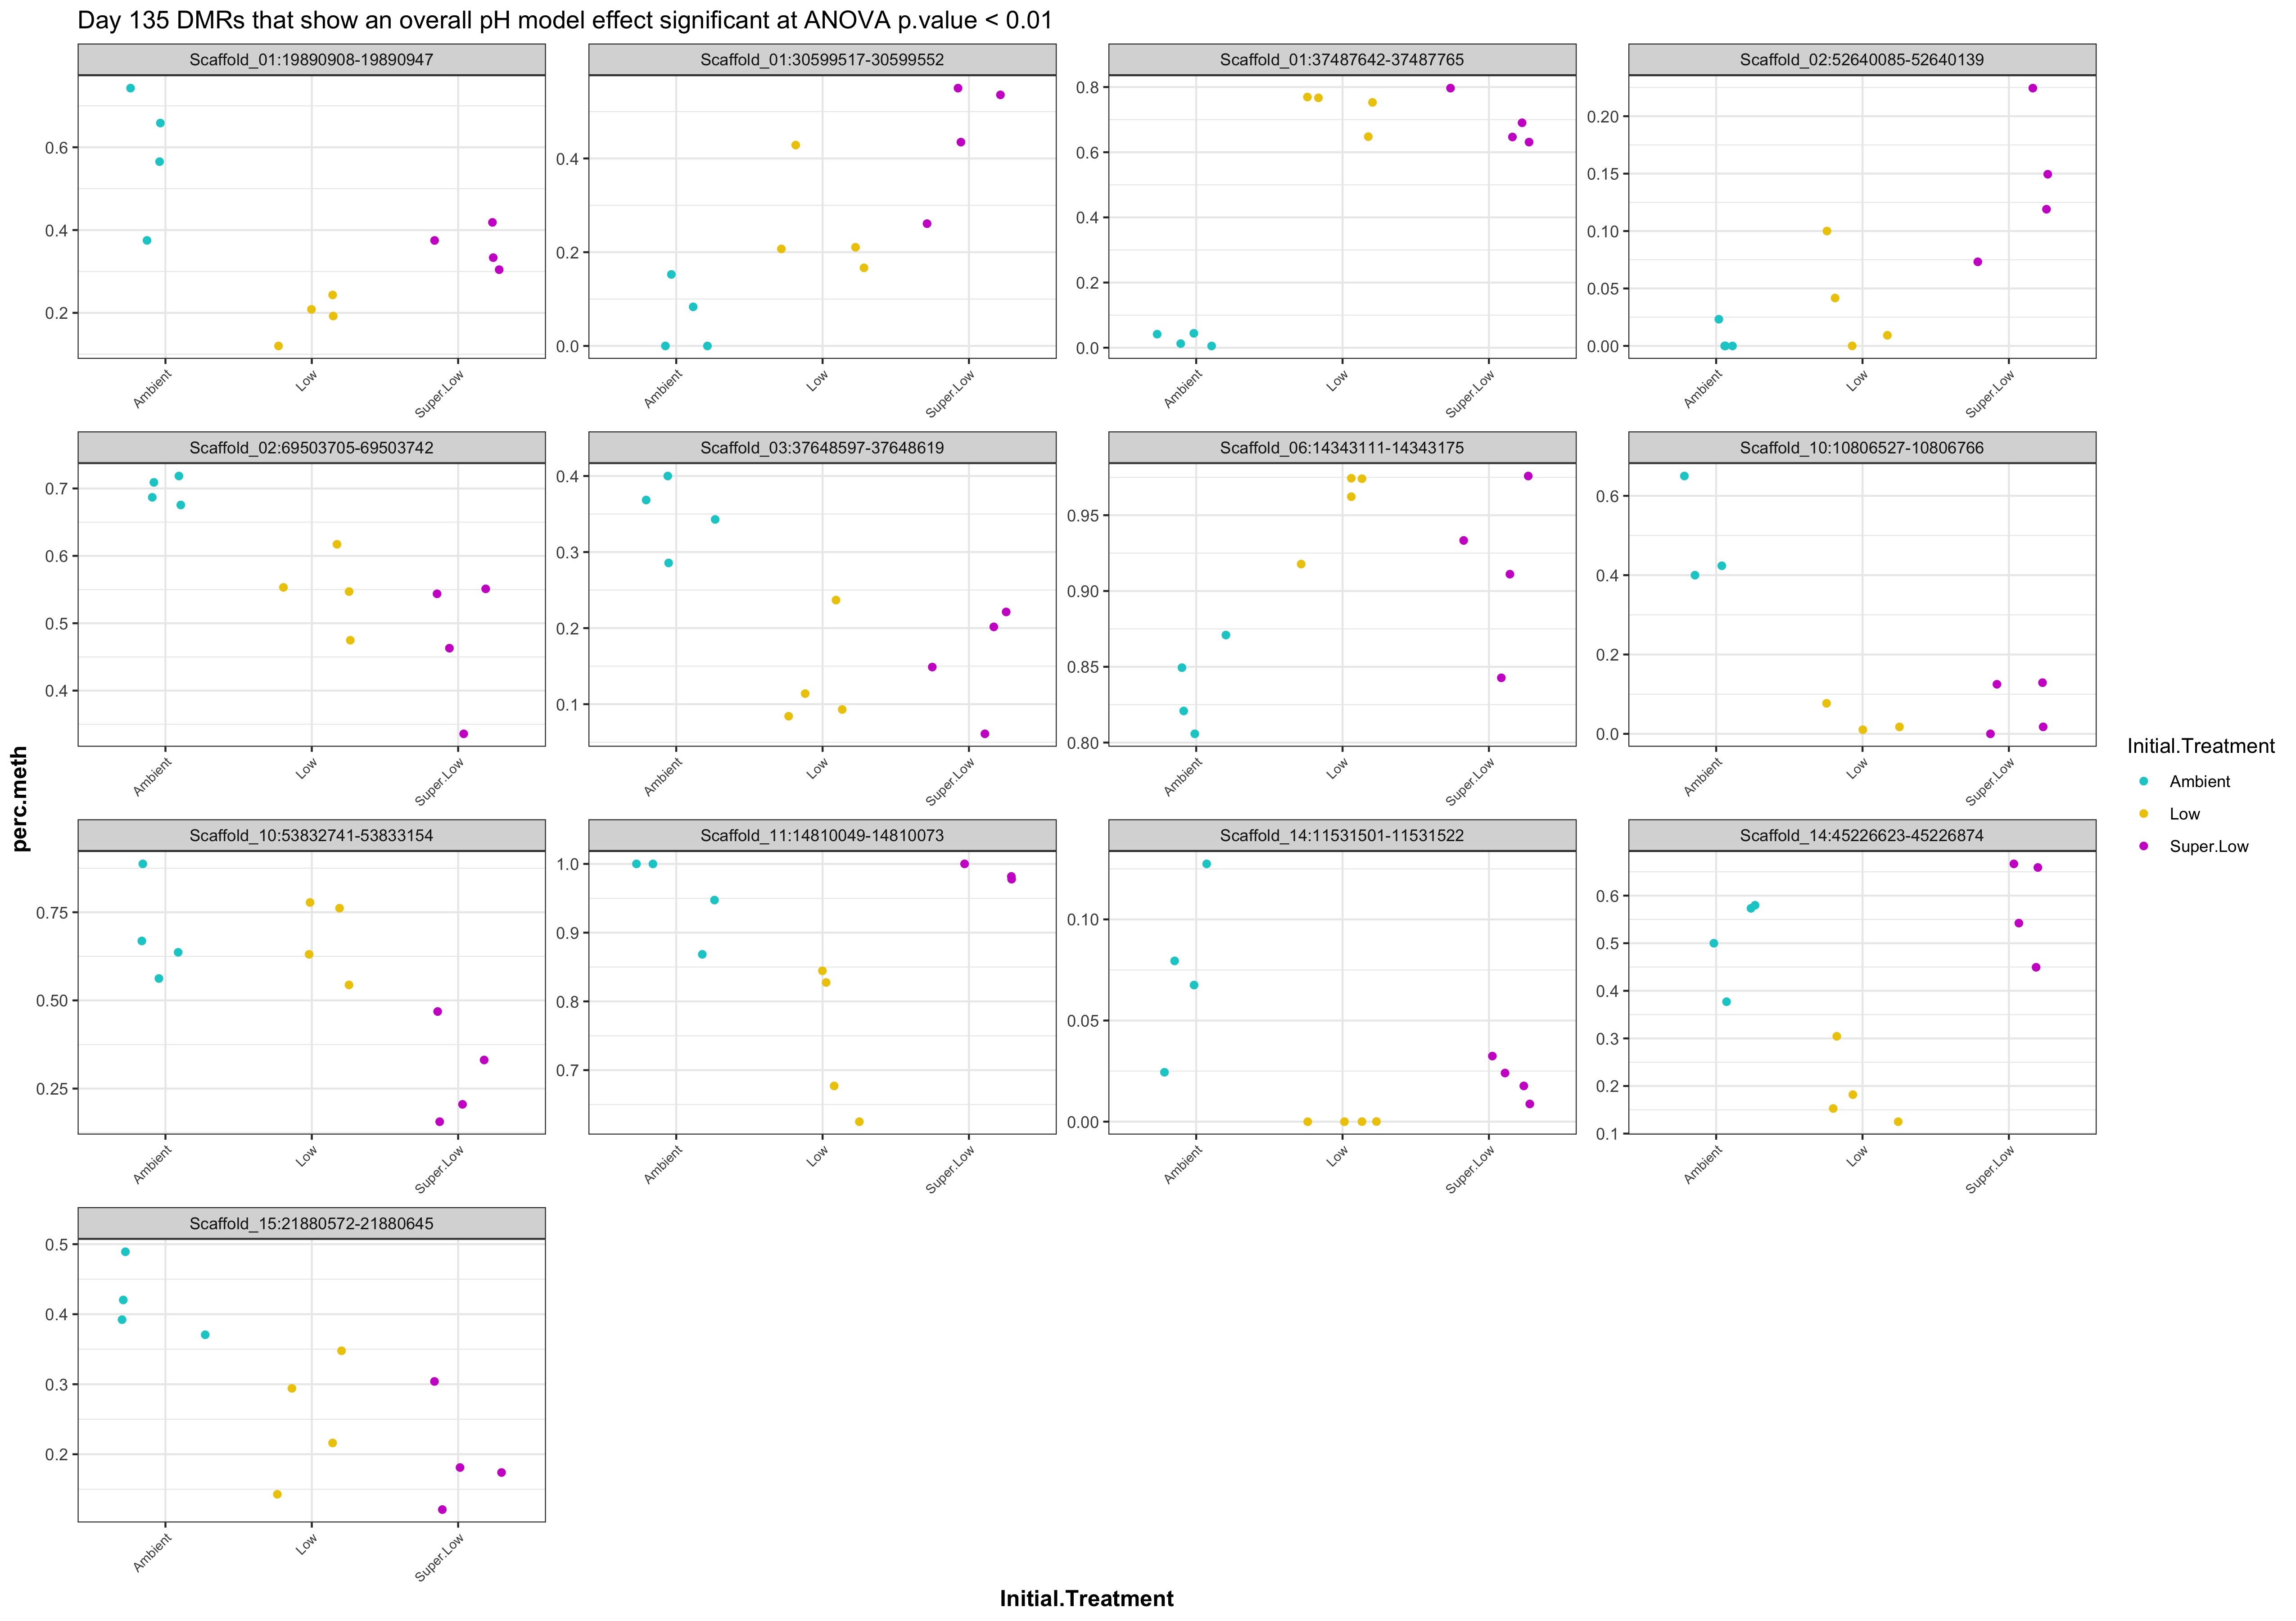
- Day 135 samples:
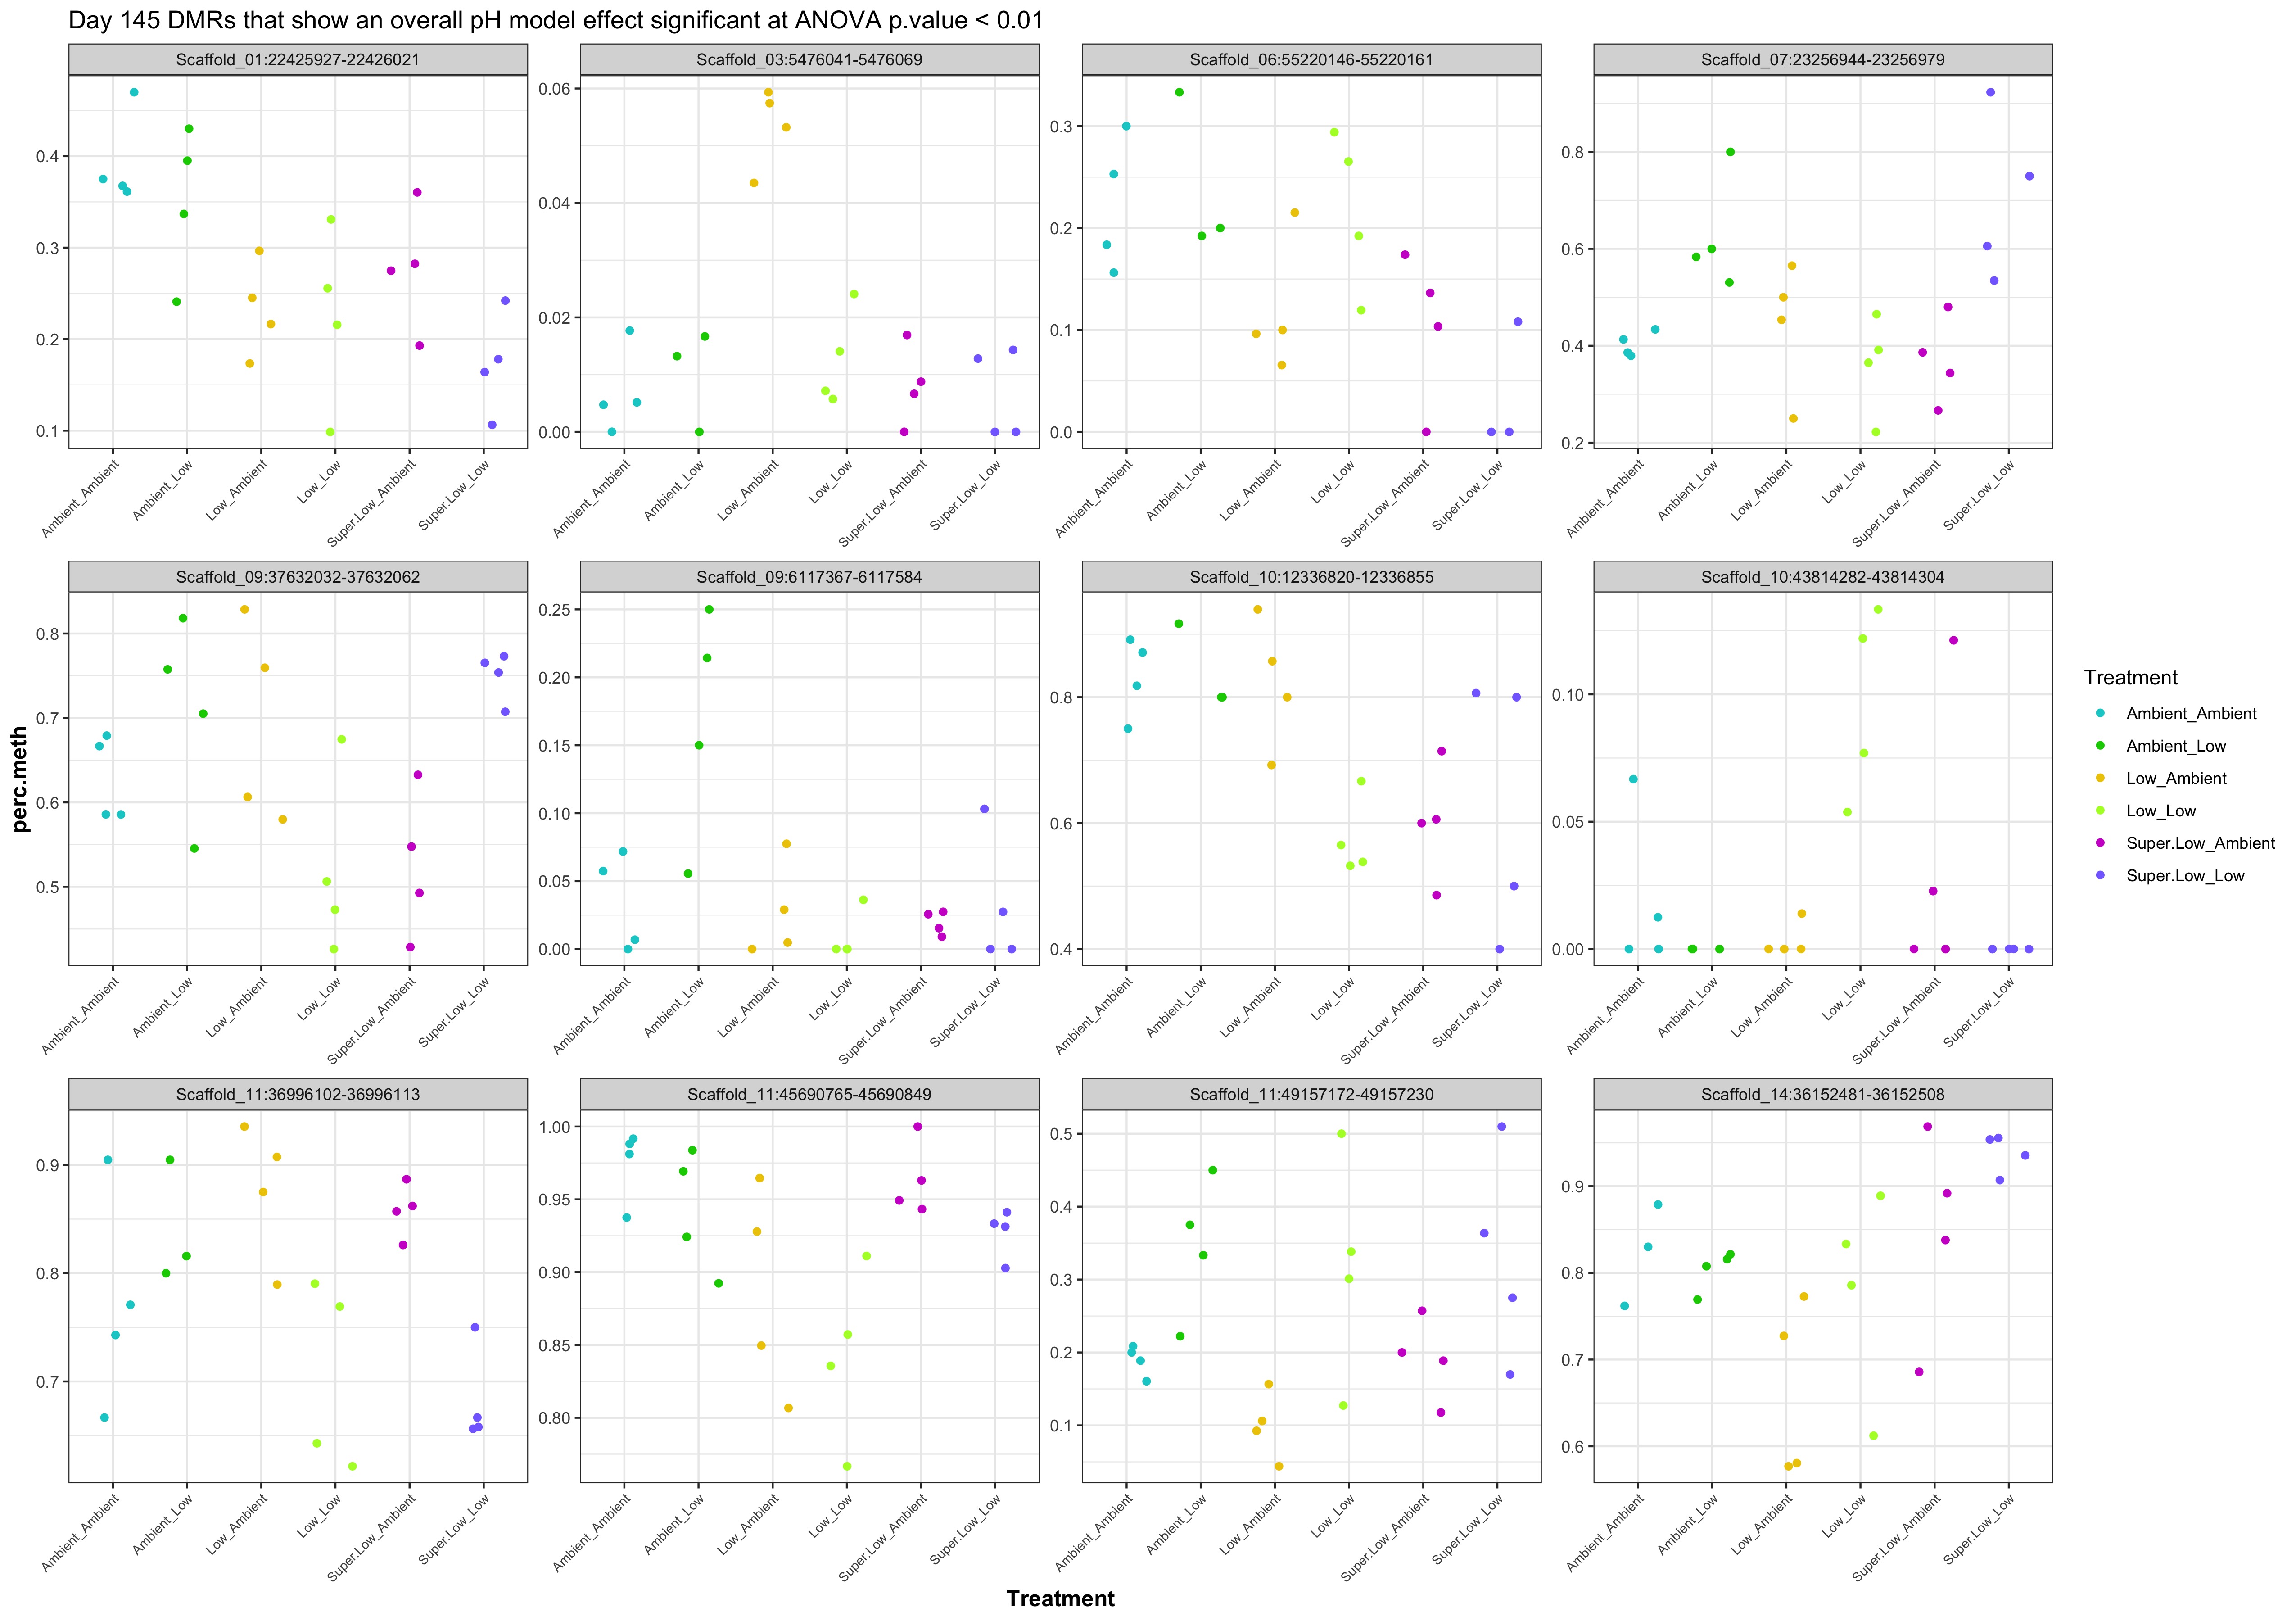
- Day 145 samples:
- All ambient samples:
- DMRs significant at p value < 0.05
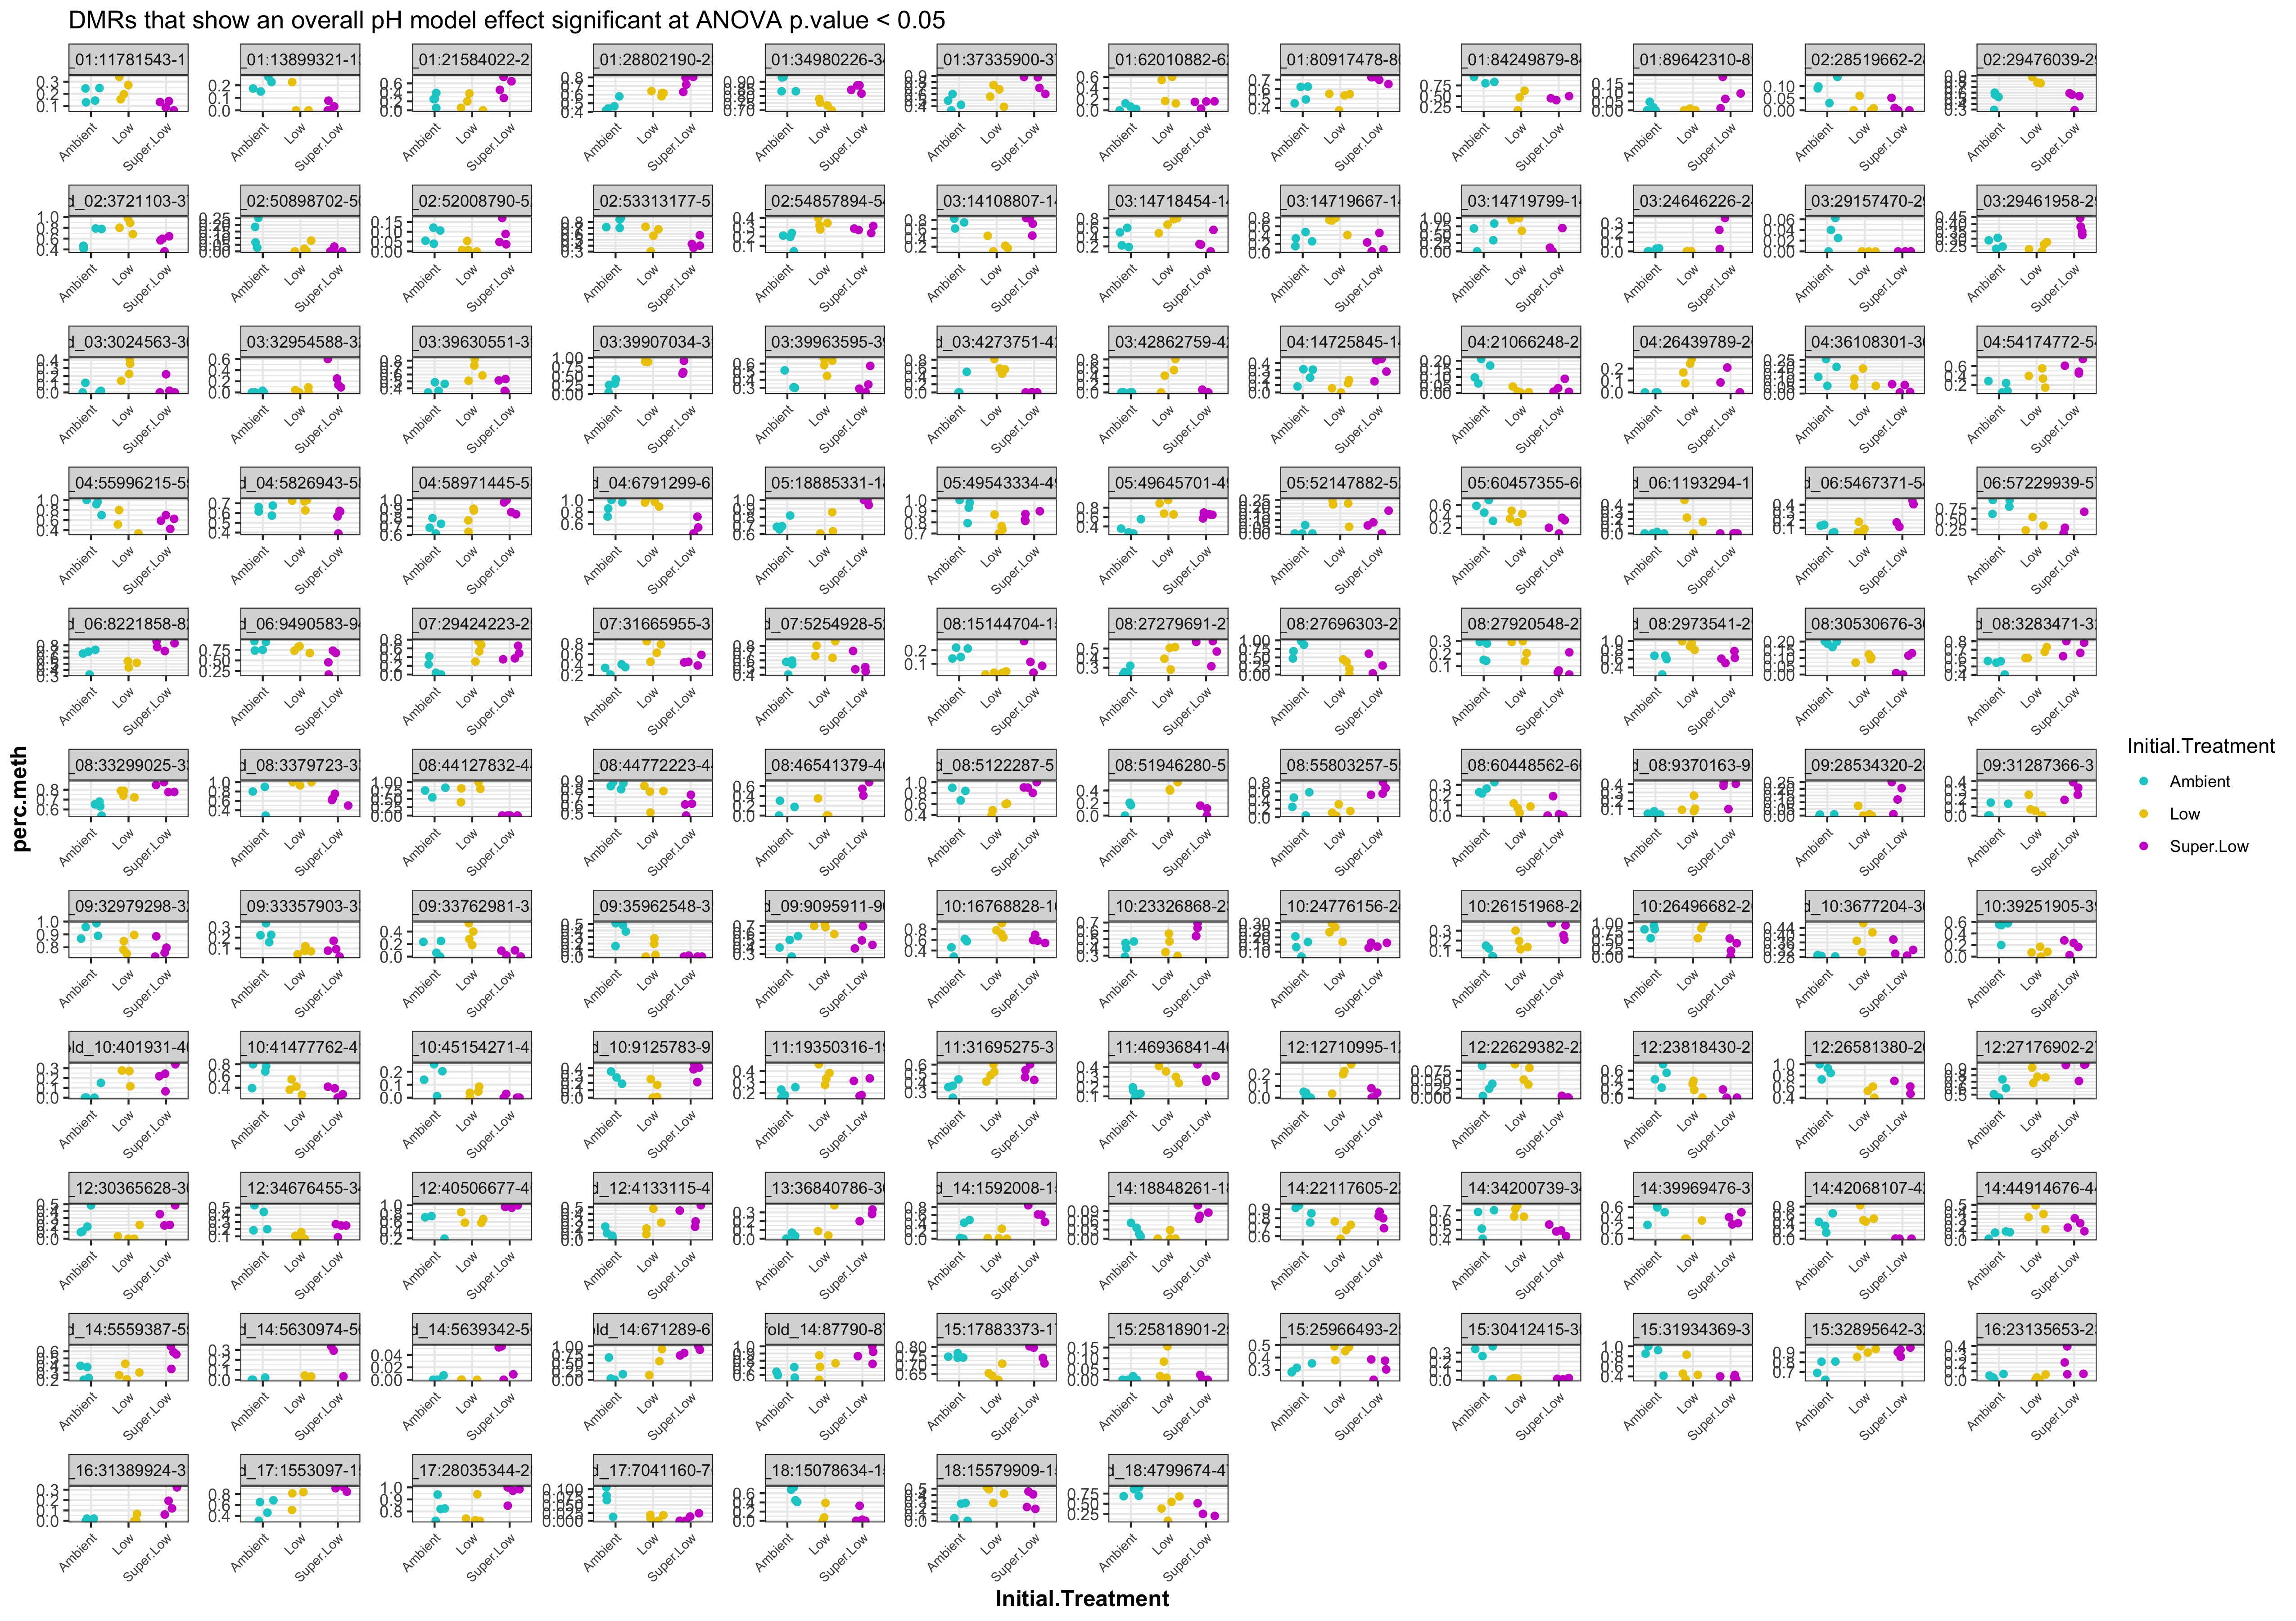
- All ambient samples:
- Day 10 samples:
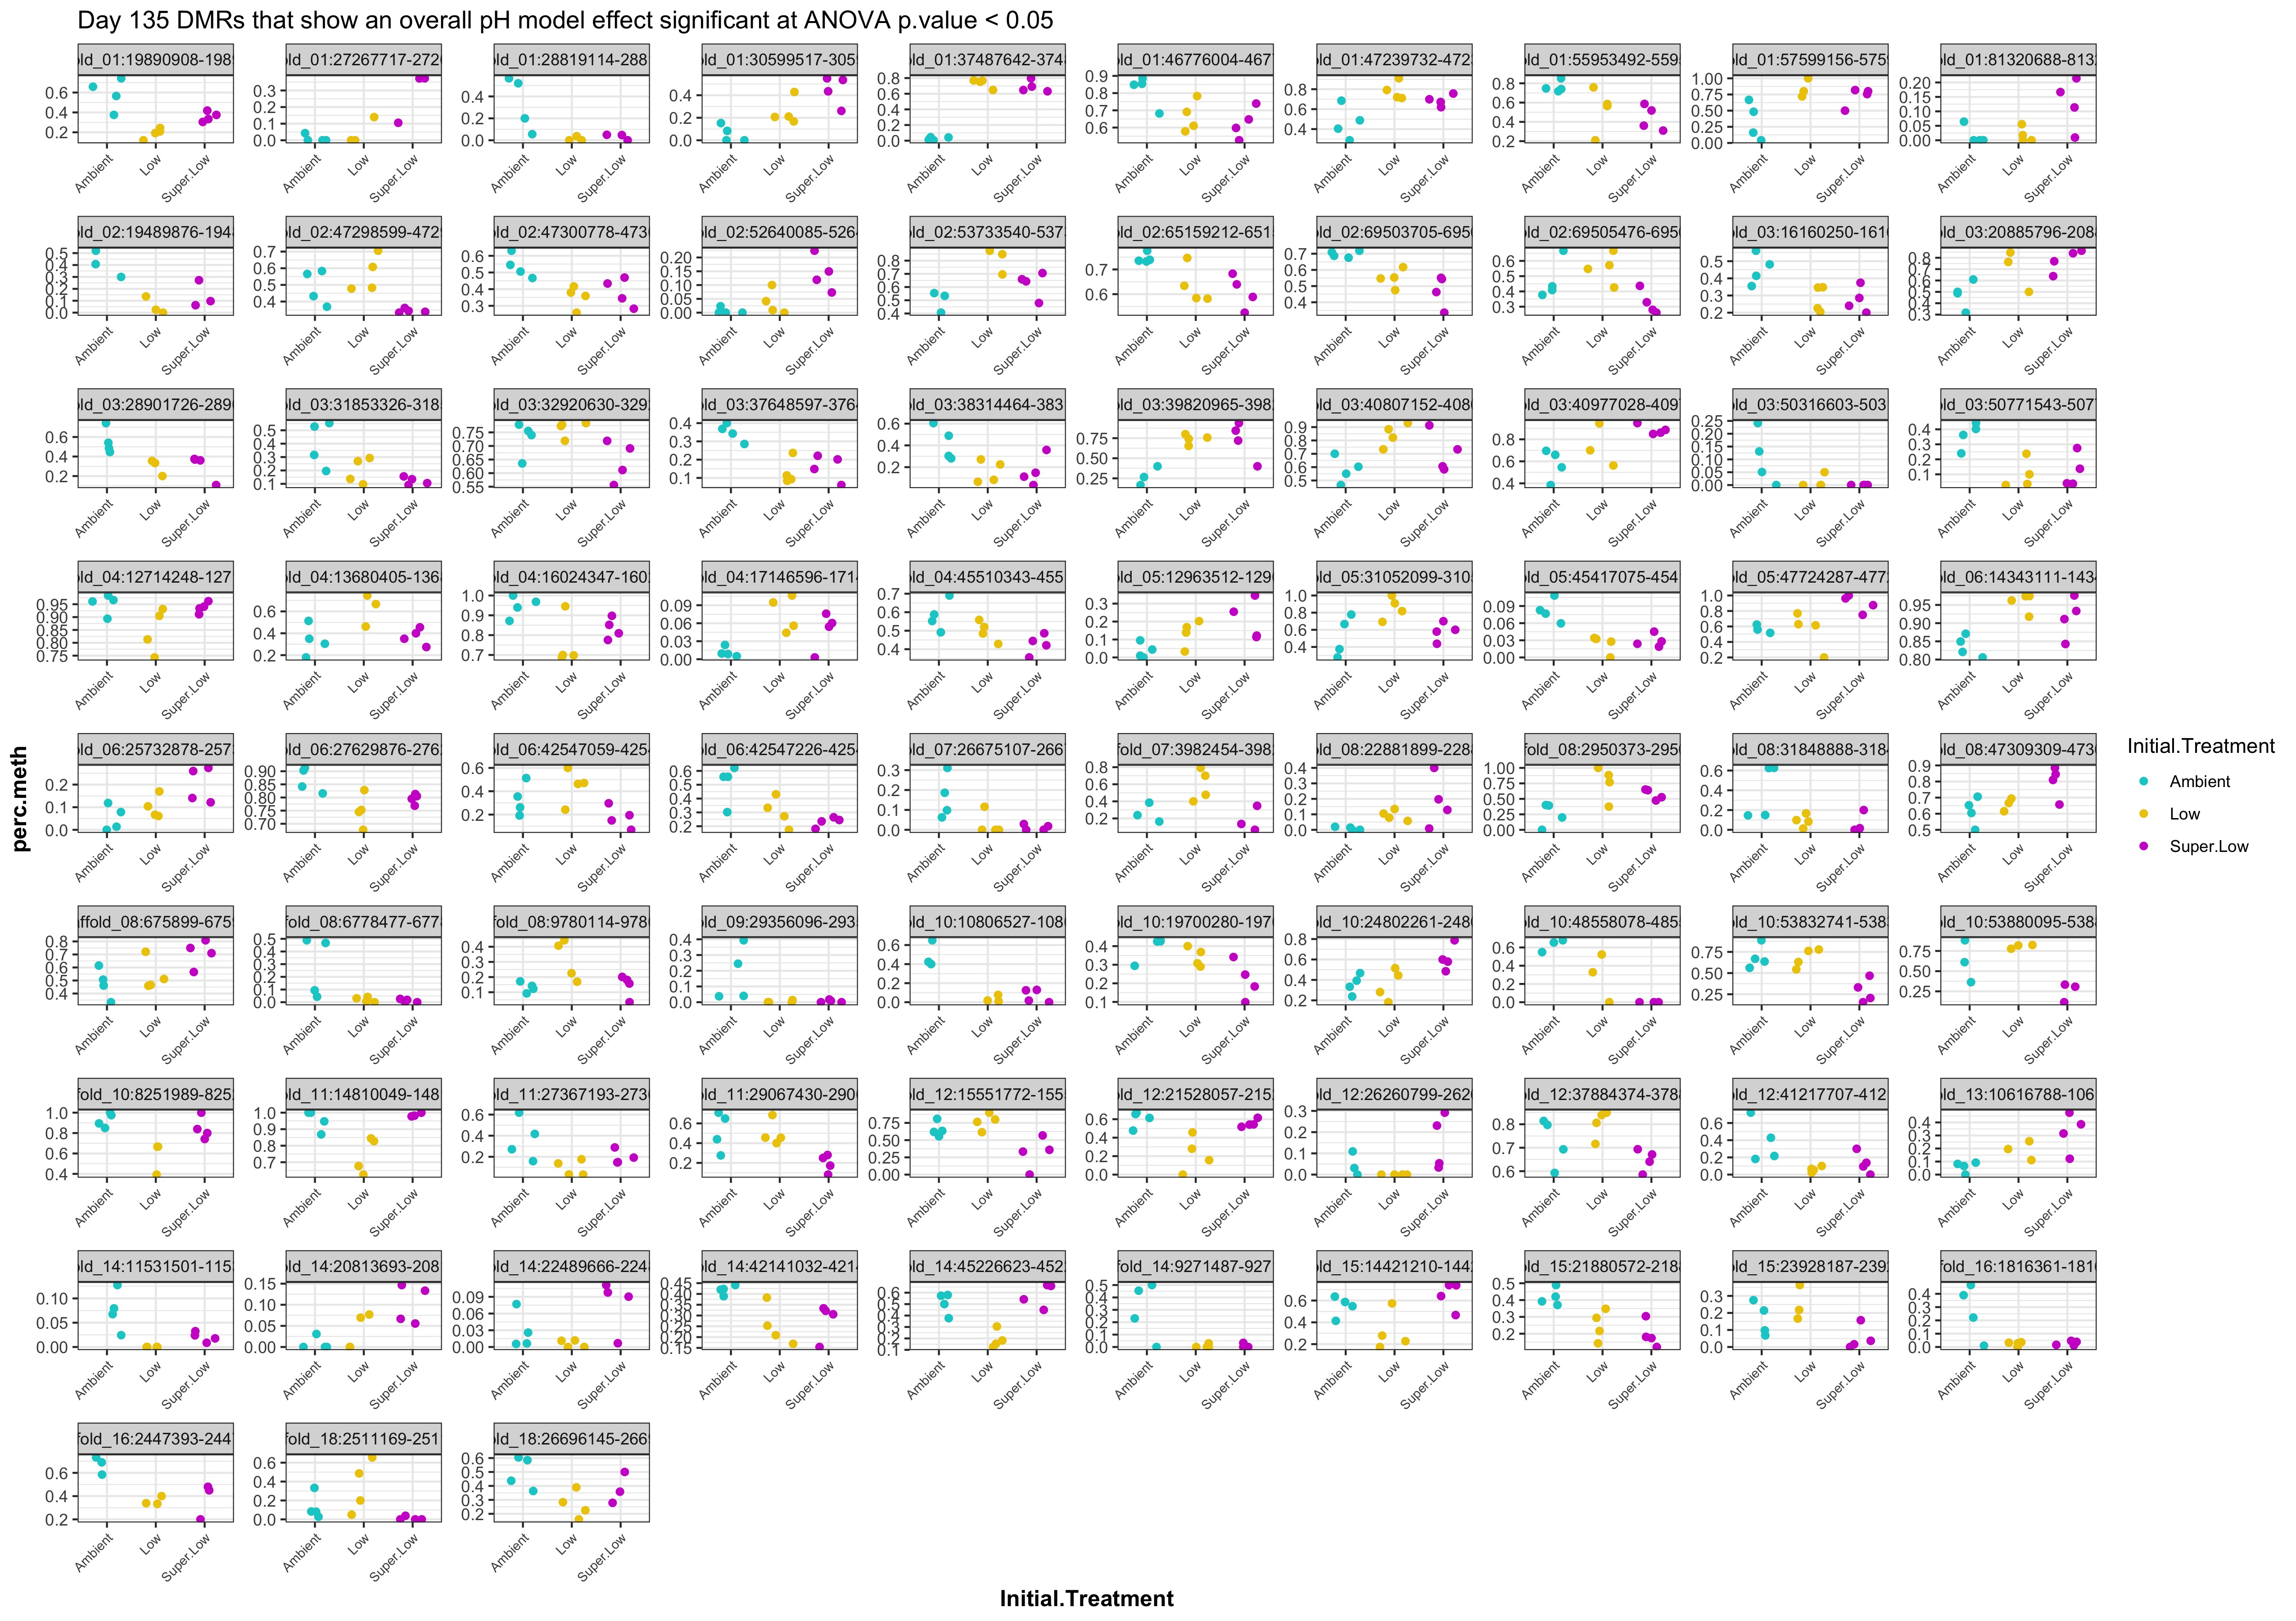
- Day 135 samples:
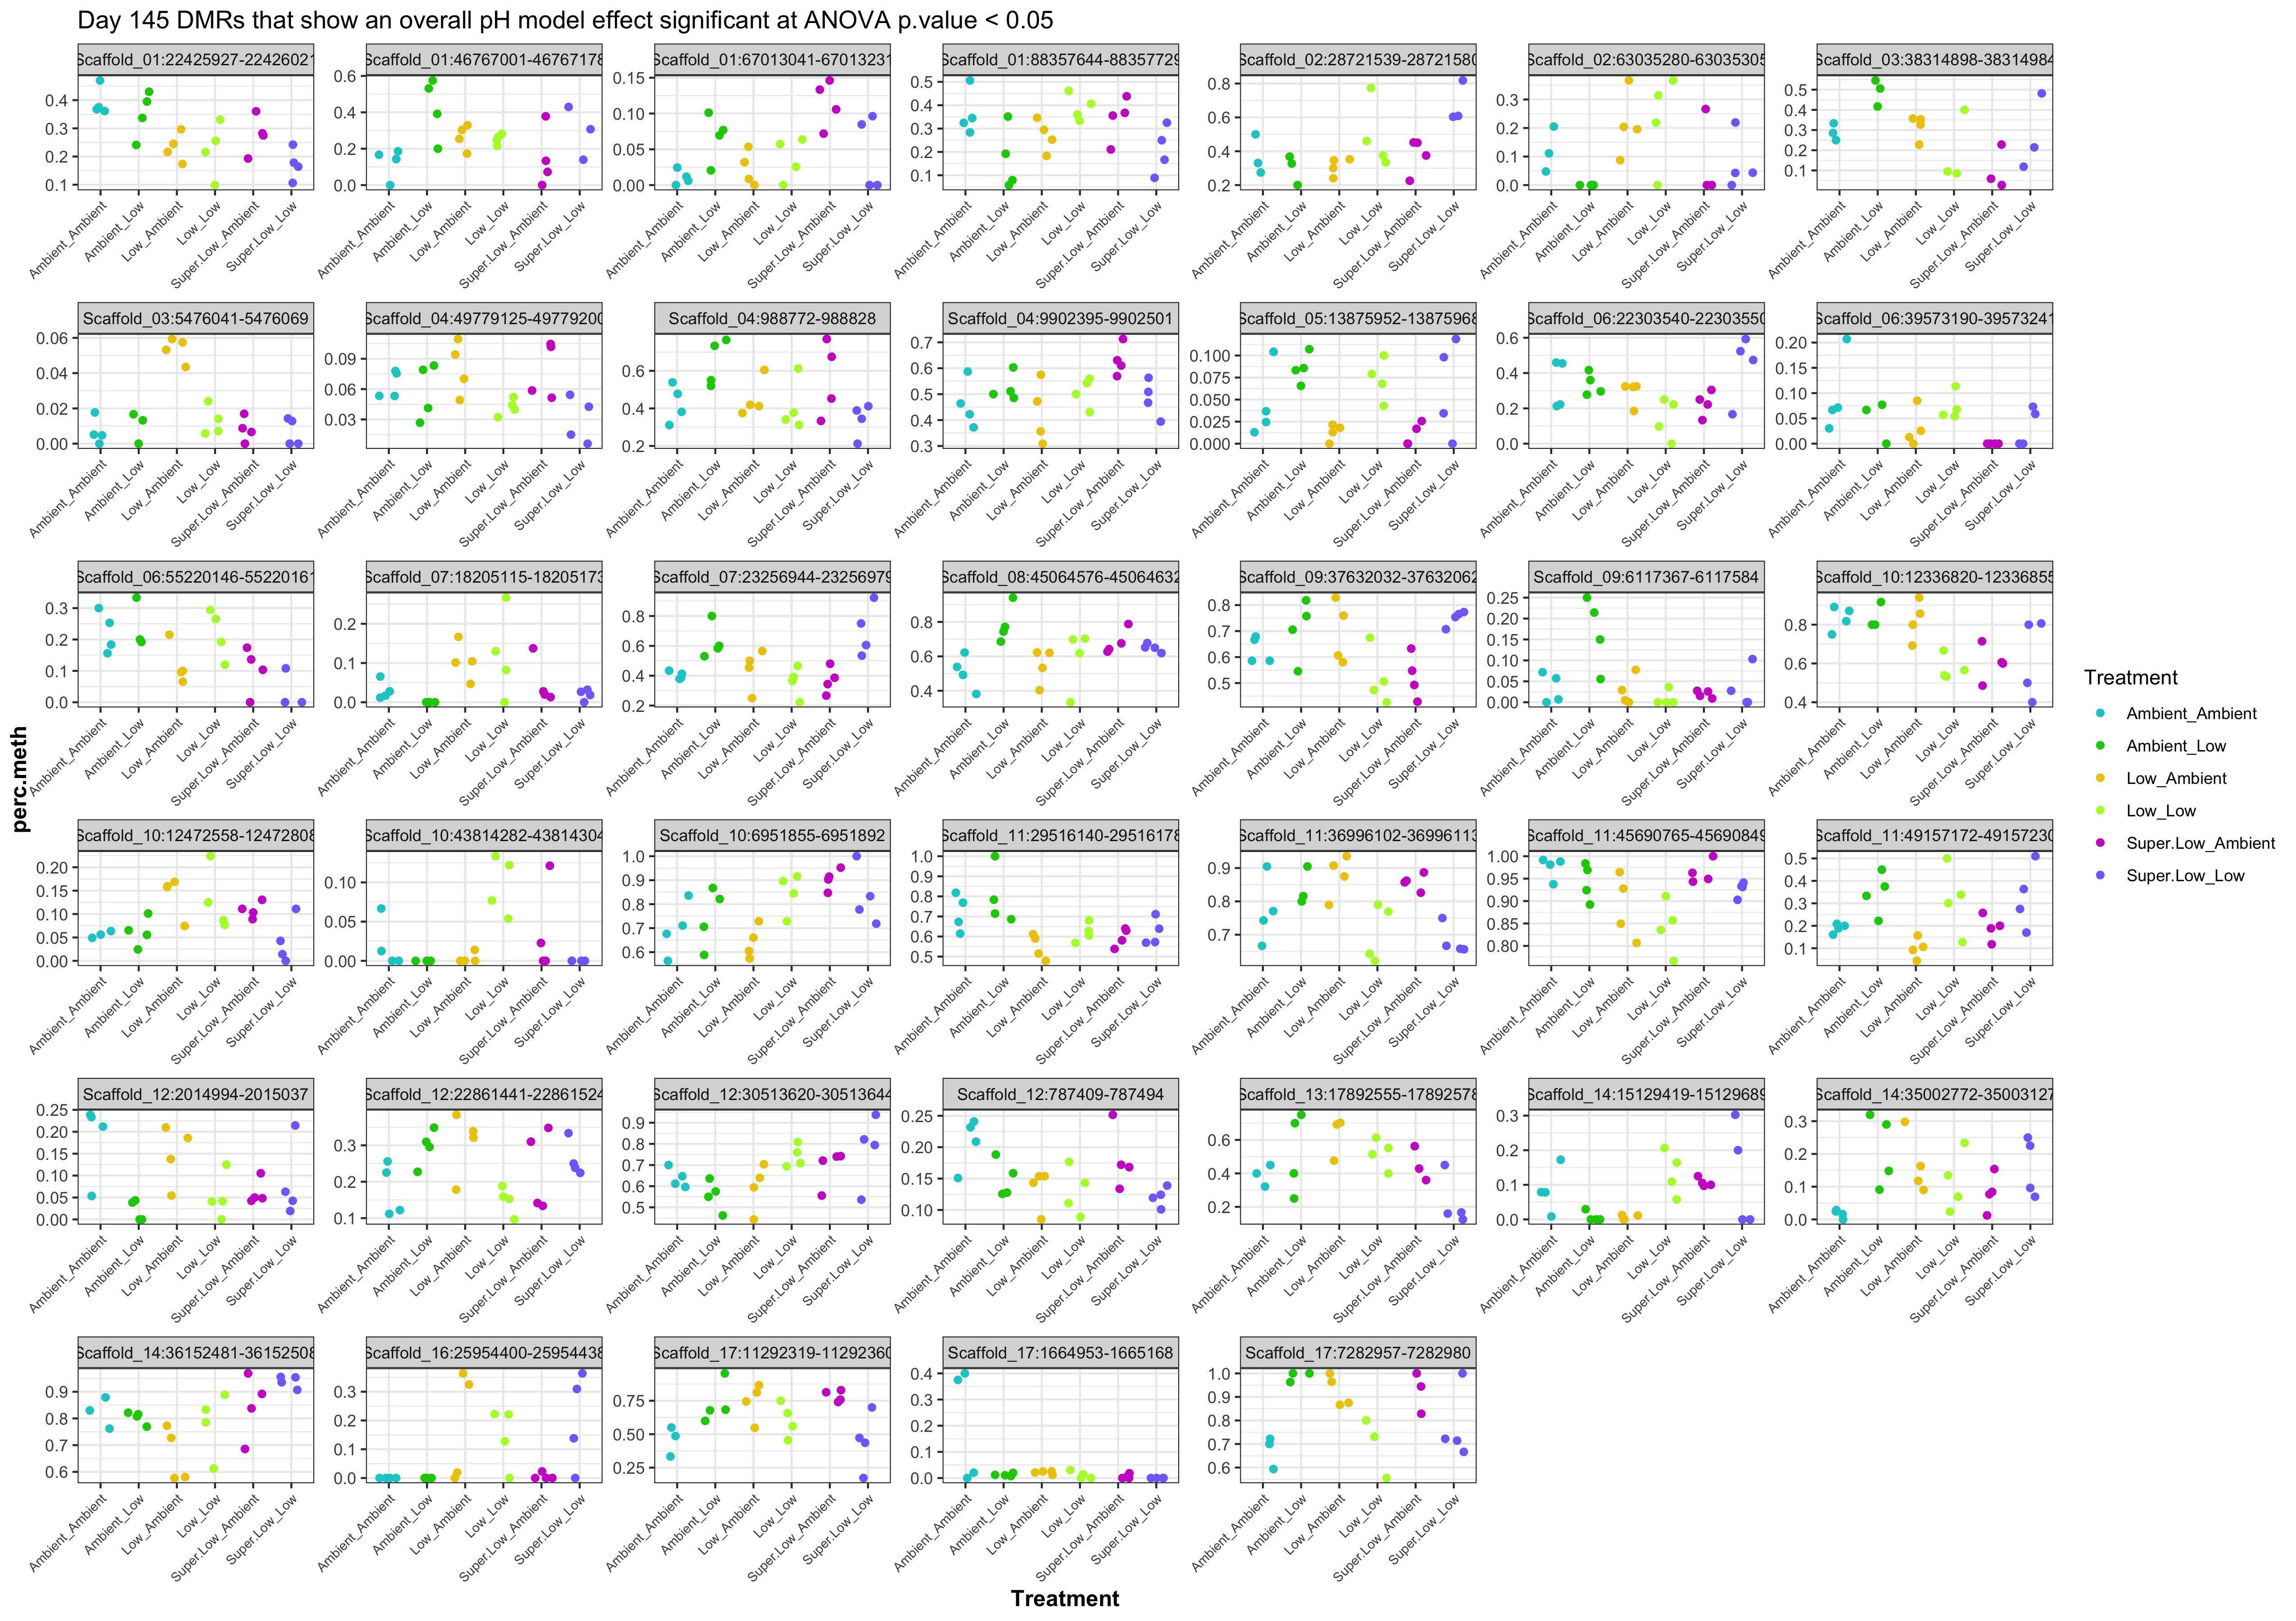
- Day 145 samples:
- All ambient samples:
- DMRs significant at p value < 0.01
- Plot heatmaps of DMRs x samples colored by % methylation
- DMRs significant at p value < 0.01
- All ambient samples:
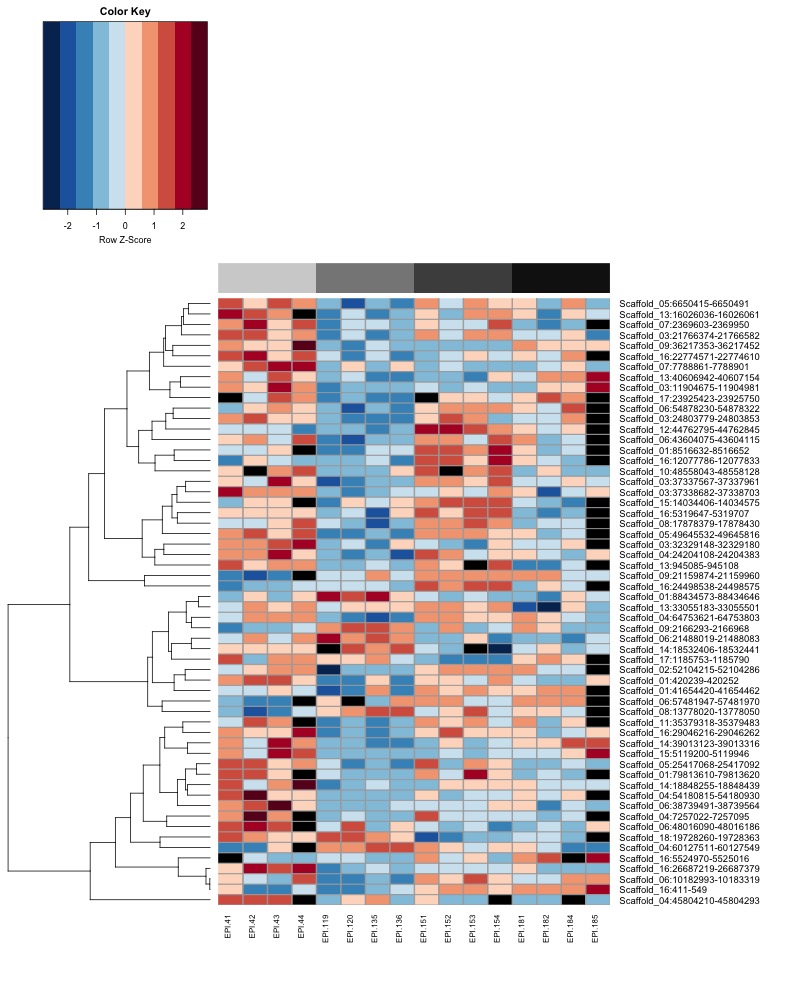
- Day 10 samples:

- Day 135 samples:
- Day 145 samples:
- All ambient samples:
- DMRs significant at p value < 0.05
- All ambient samples:
- Day 10 samples:

- Day 135 samples:
- Day 145 samples:

- All ambient samples:
- DMRs significant at p value < 0.01
- Plot heatmaps of DMRs x group means colored by % methyaltion
- DMRs significant at p value < 0.01
- All ambient samples:

- Day 10 samples:
- Day 135 samples:
- Day 145 samples:
- All ambient samples:
- DMRs significant at p value < 0.05
- All ambient samples:
- Day 10 samples:
- Day 135 samples:
- Day 145 samples:
- All ambient samples:
- DMRs significant at p value < 0.01
- Identify persistent DMRs
- Using this jupyter notebook 20191223_PersistantDMRs.ipynb I compared DMRs from day10 samples (aov_0.05pH_d10DMR.bed) and DMRs from day 135 samples (aov_0.05pH_d135DMR.bed)
- none were overlapping and the closest DMR was > 16kb away.
- realized the DMR may not be the same because all these analyses were done separately. If all samples were processed together, I could compare DMRs from different time points
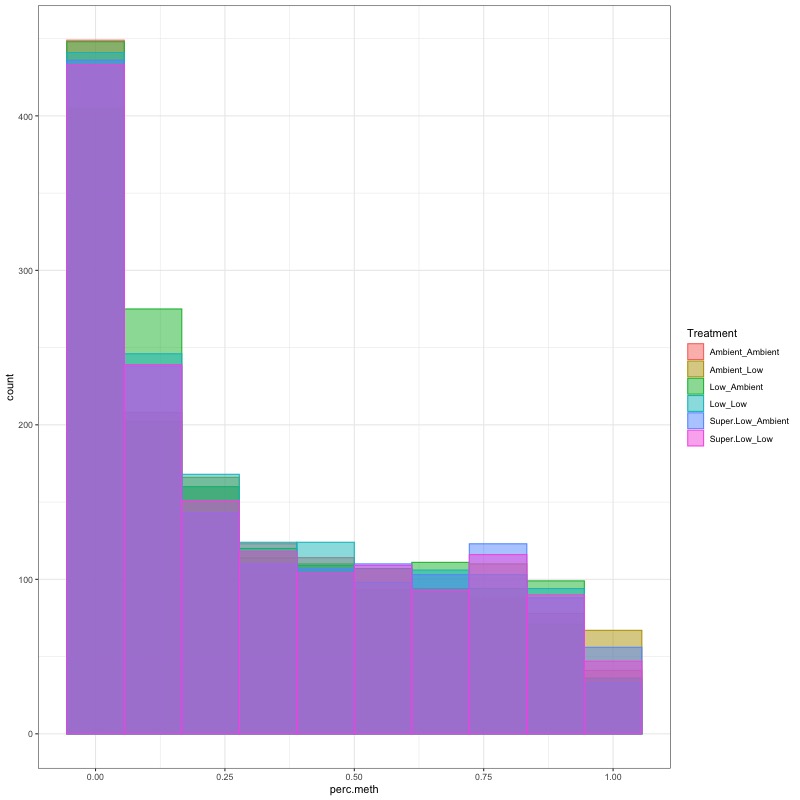
- CHECK DATA DISTRIBUTION: First looked at each groups’ % methylation distribution
Running Methylpy DMRfind on all samples together
- ran from a screen session 56367.all_samples_DMR
- command run noted in jupyter notebook 20191223_PersistantDMRs.ipynb
- output files here: https://gannet.fish.washington.edu/metacarcinus/Pgenerosa/analyses/20191223/
- summary file here: all_Samples_DMR250bp_MCmax25_cov5x_rms_results_collapsed.tsv
- filtered DMRs for coverage in 3/4 samples per group using this R markdown script: AllSamples_mcmax25_DMR_cov_in_0.75_SamplesPerCategory.Rmd
- ran group stats and made plots for filtered DMRs using this R markdown script: AllSamplesMCmax25DMR_asinT_Stats.Rmd
- day 10 data:
- arcsin square root transformed day 10 data:

- day 135 data:
- arcsin square root transformed day 135 data:
- data transformation still doesn’t make it normal, but I ran ANOVA anyways. This data should be fit with a glm
- ANOVA summary tables:
- day 10: [allDMR_d10_1way_aov_pH_modelsumm.csv
- day 135: allDMR_d135_1way_aov_pH_modelsumm.csv
- ANOVA summary tables:
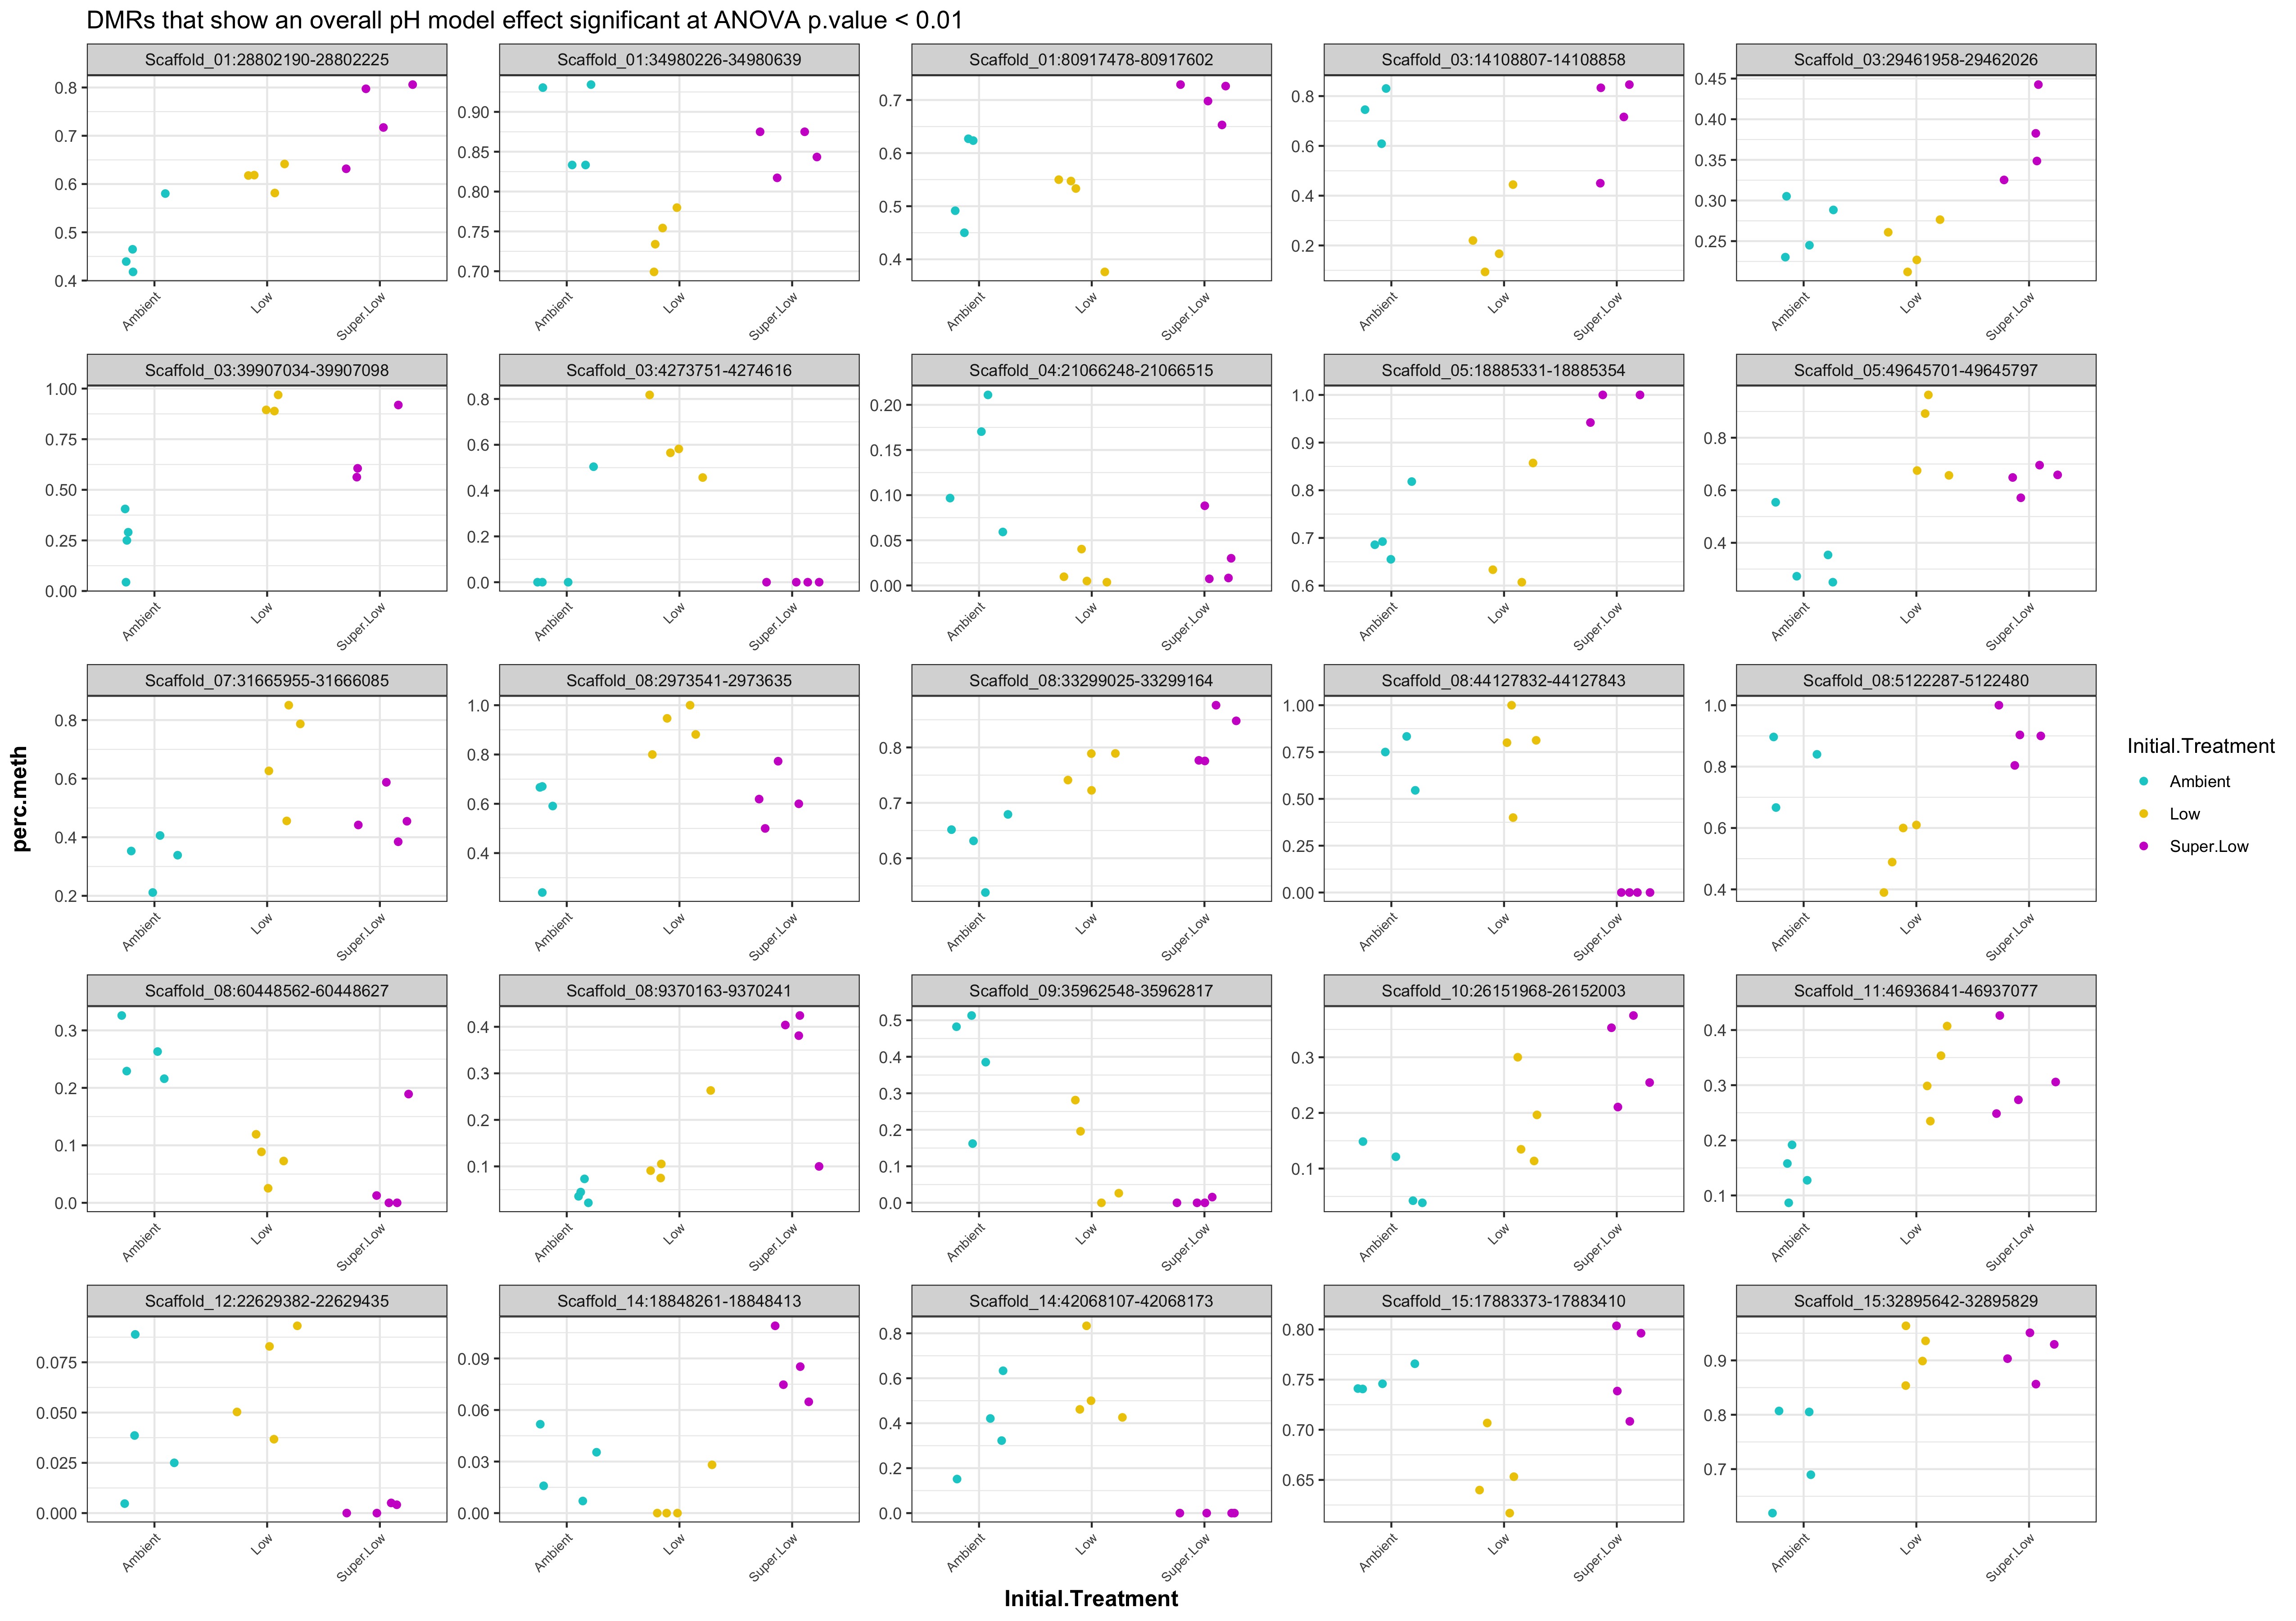
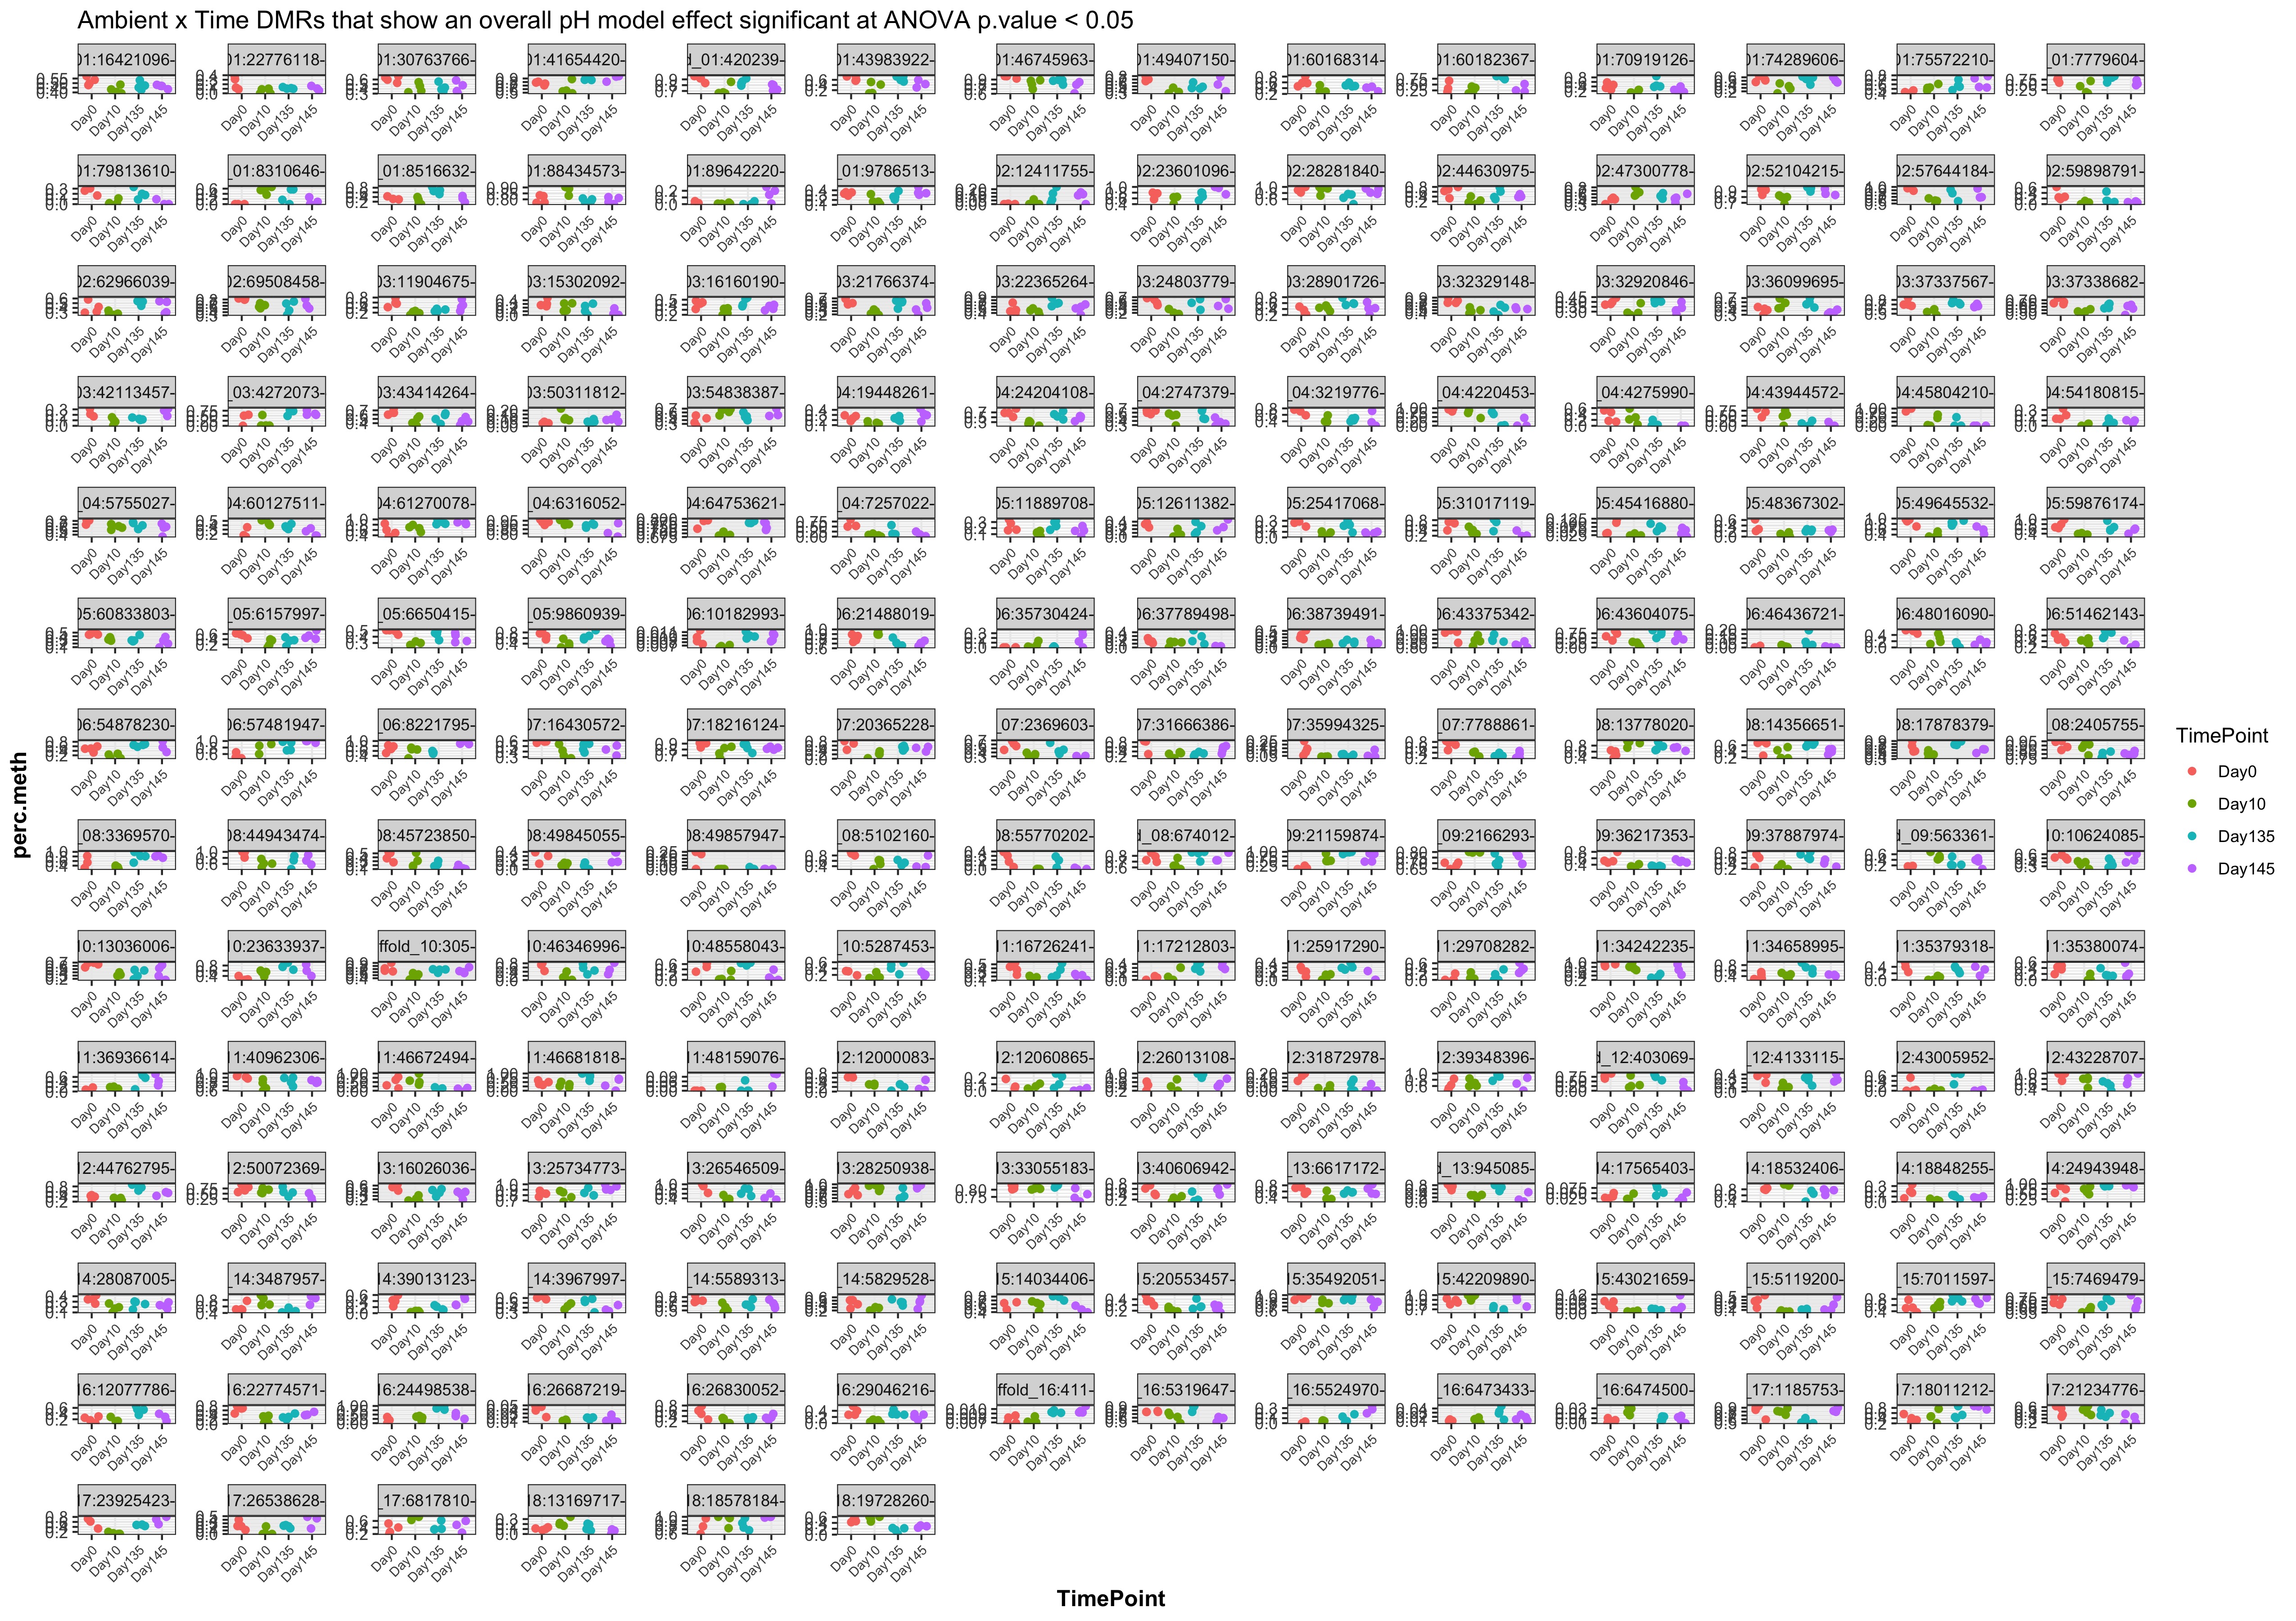
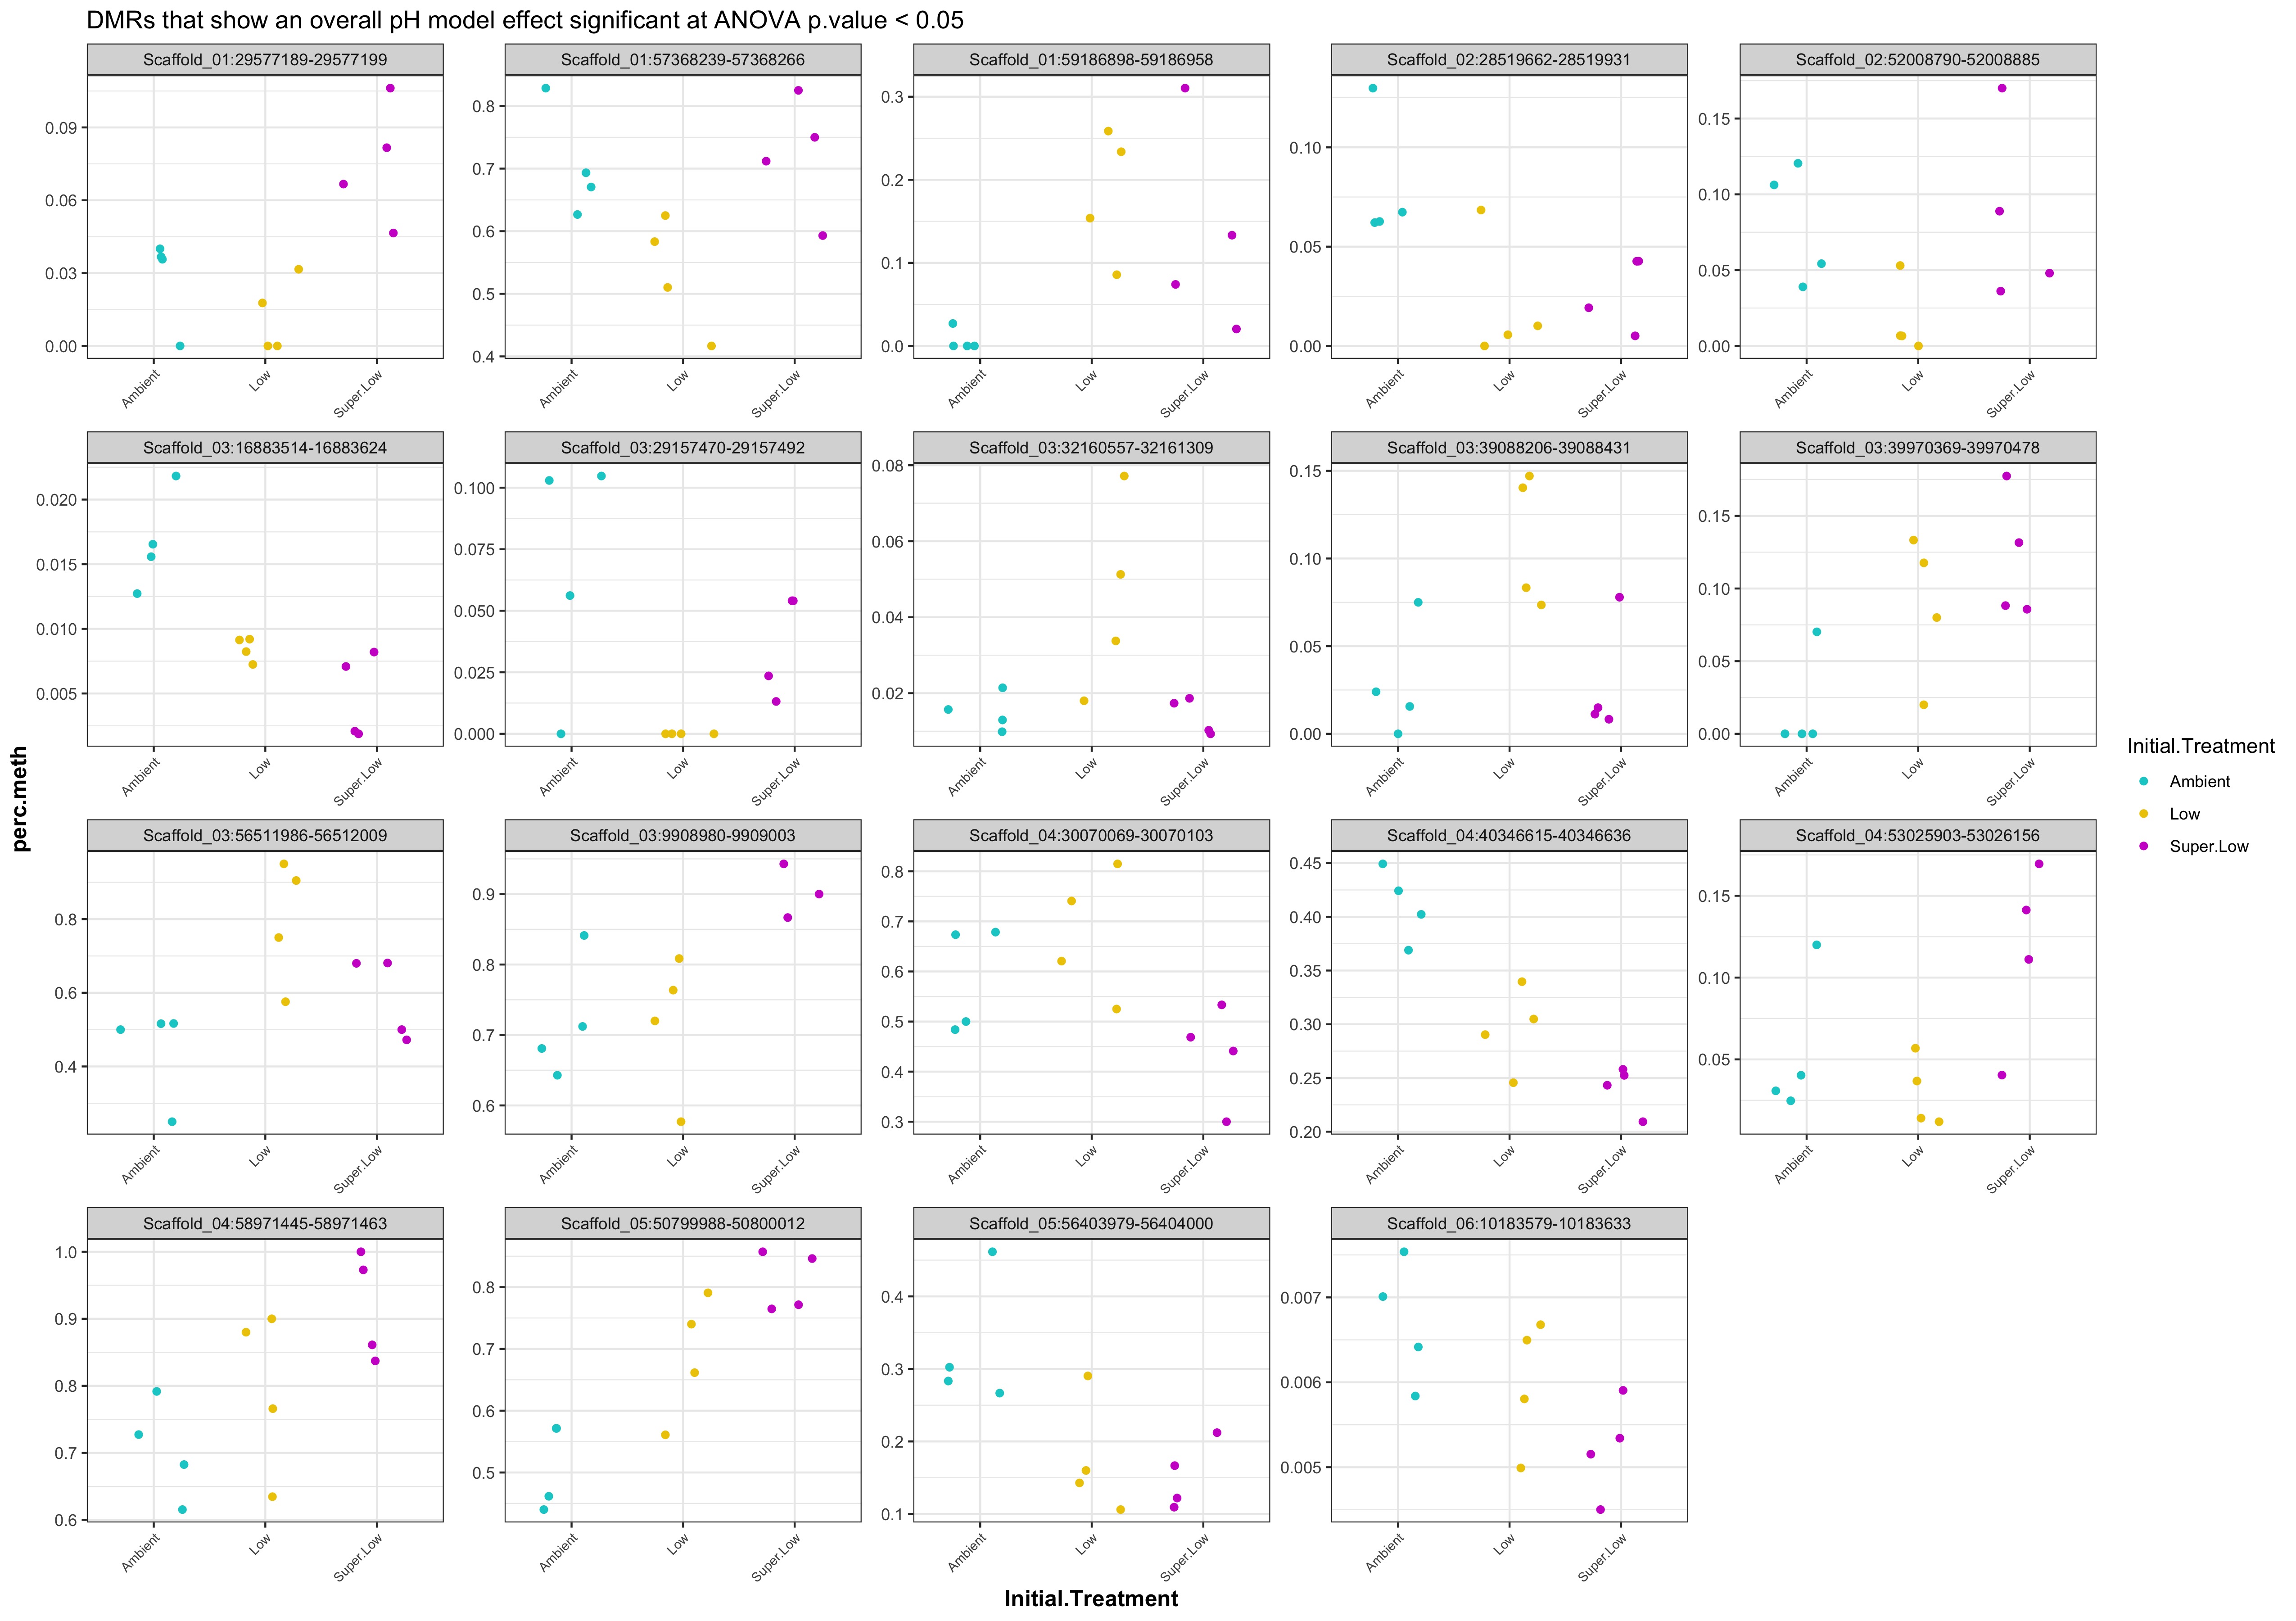
- plots of % methylation of day10 DMRs that show a significant pH effect at p < 0.05
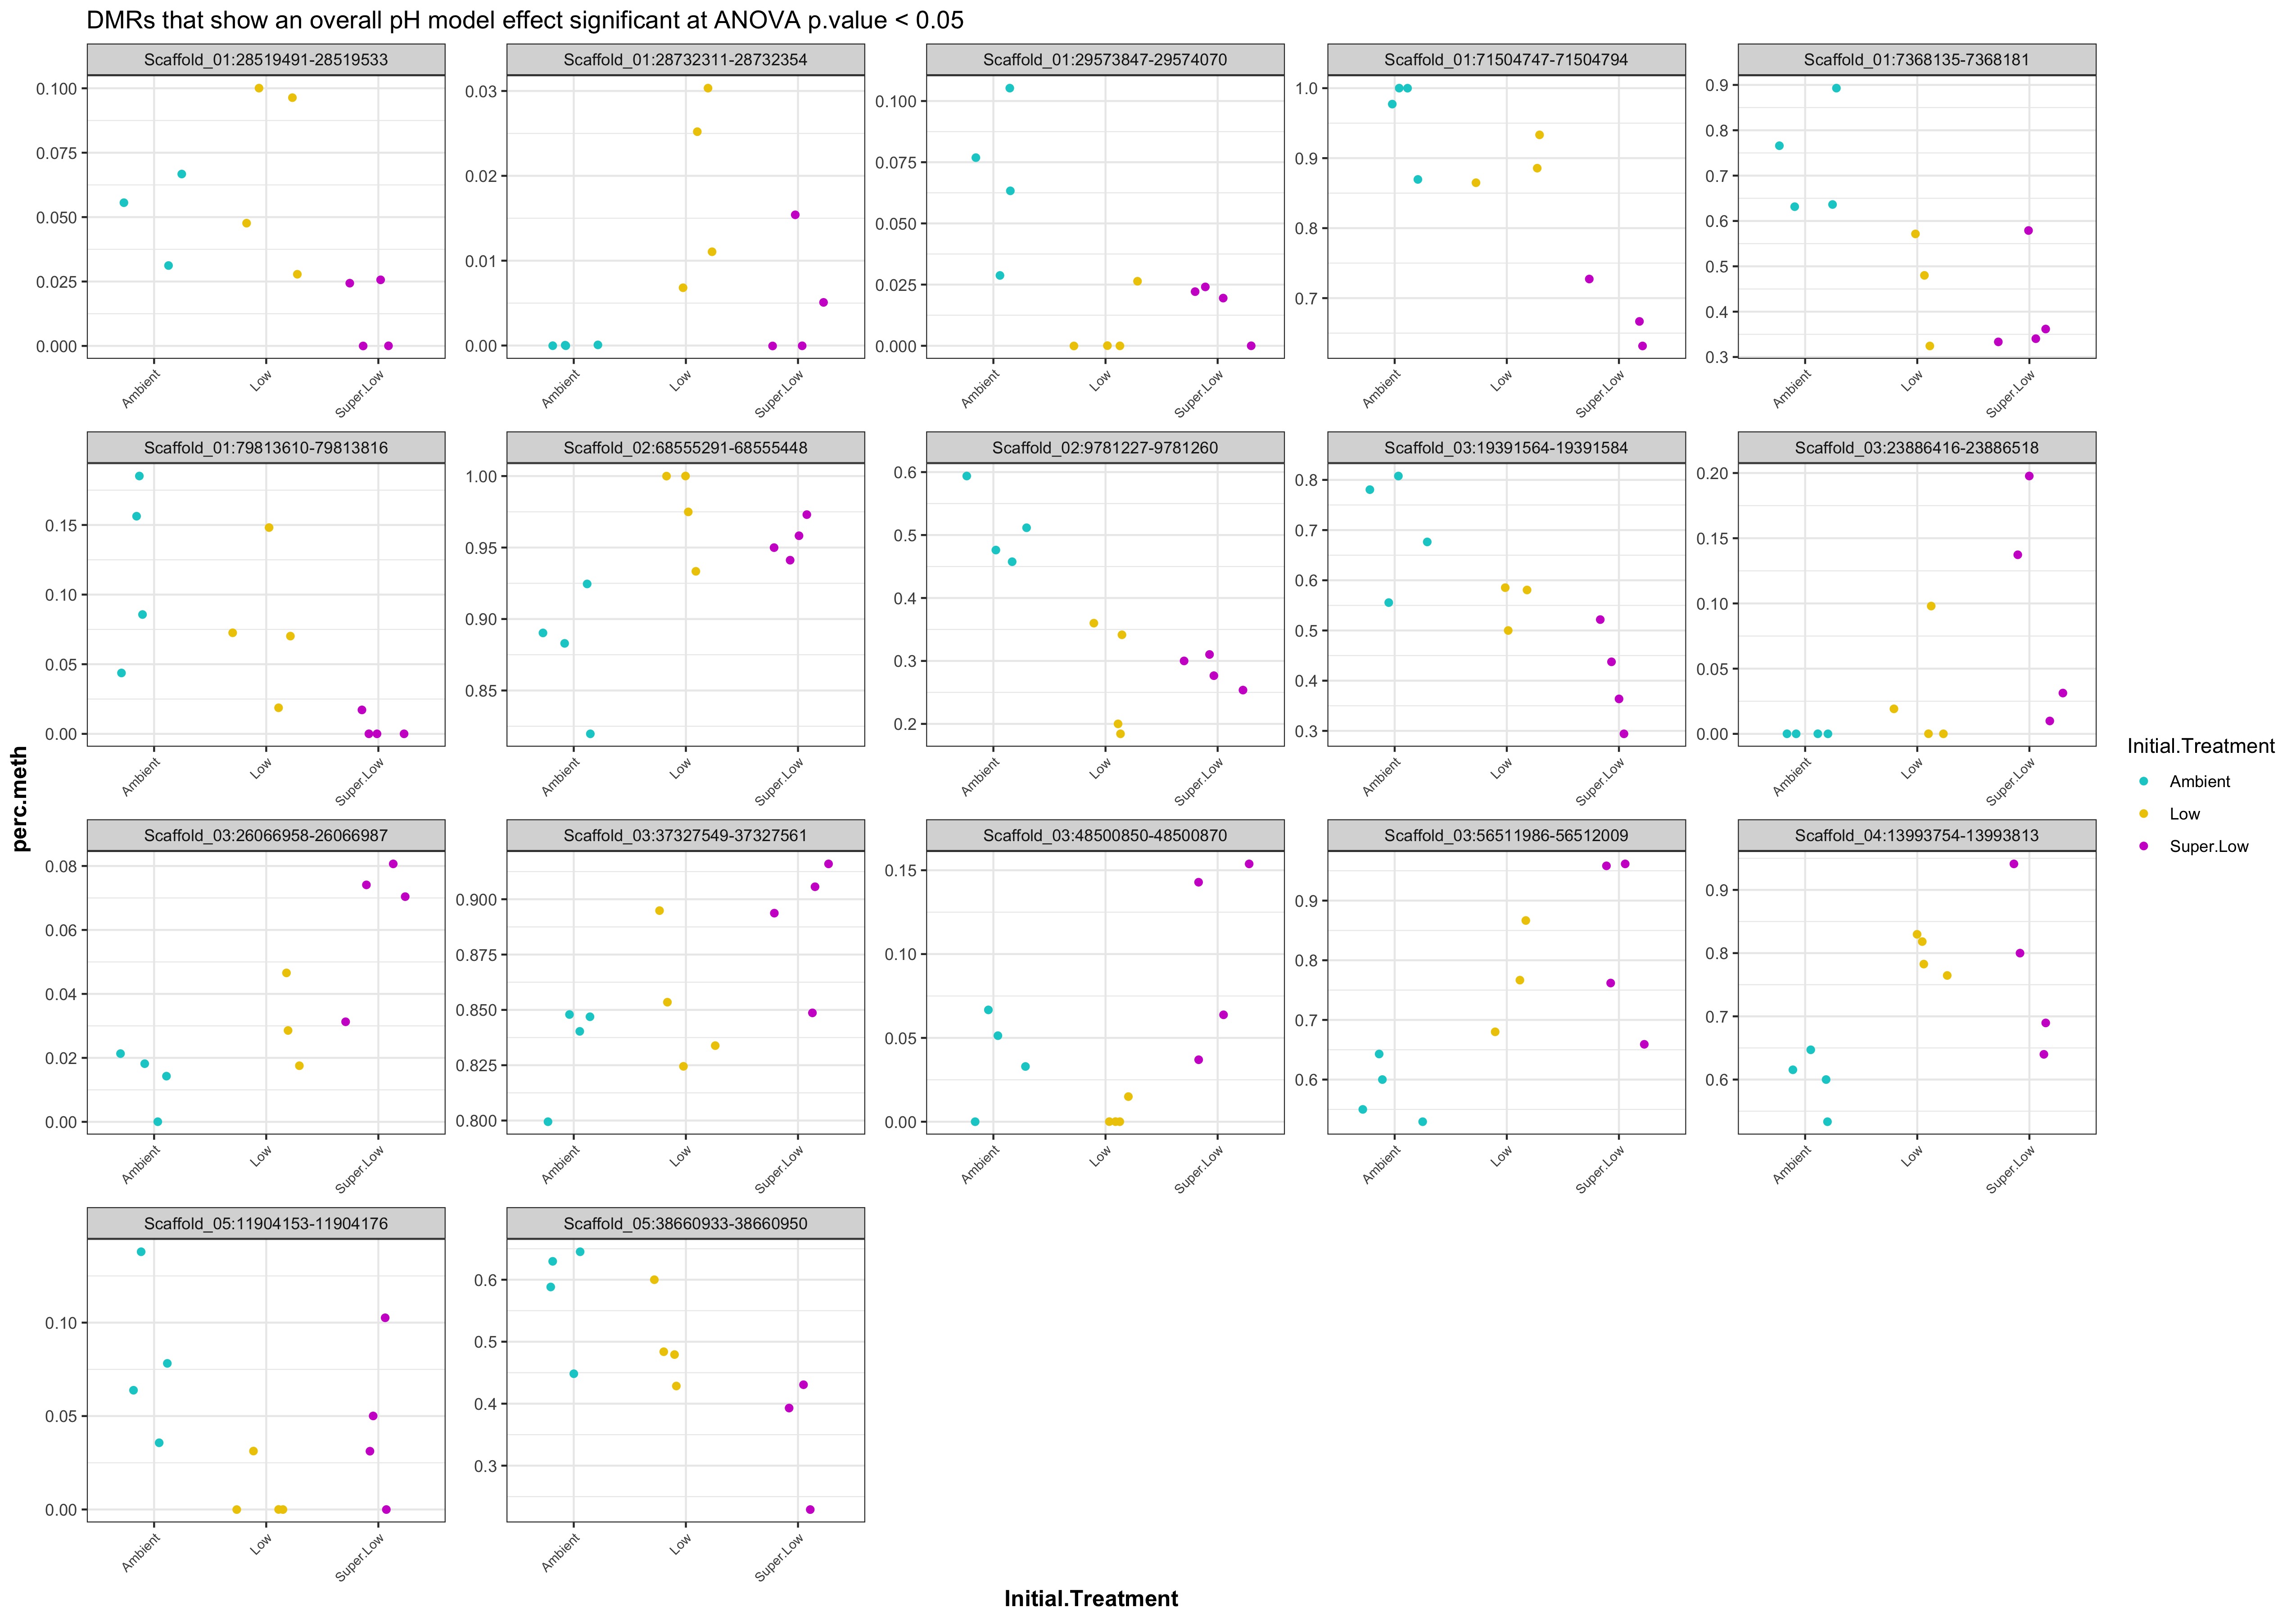
- plots of % methylation of day135 DMRs that show a significant pH effect at p < 0.05
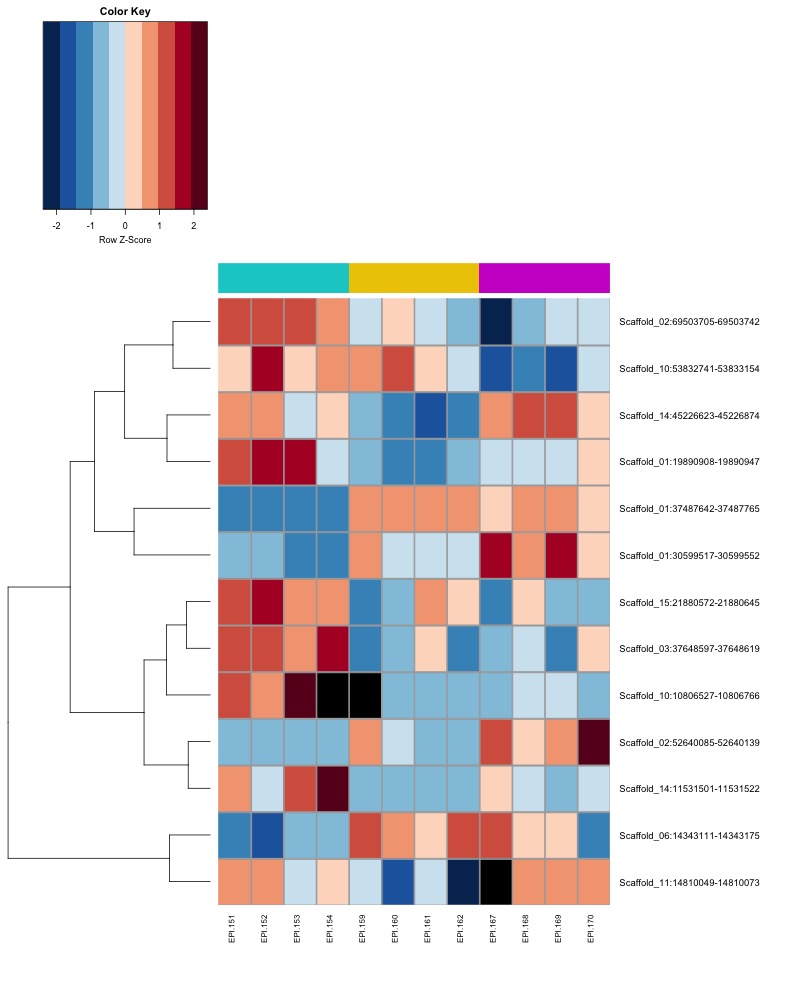
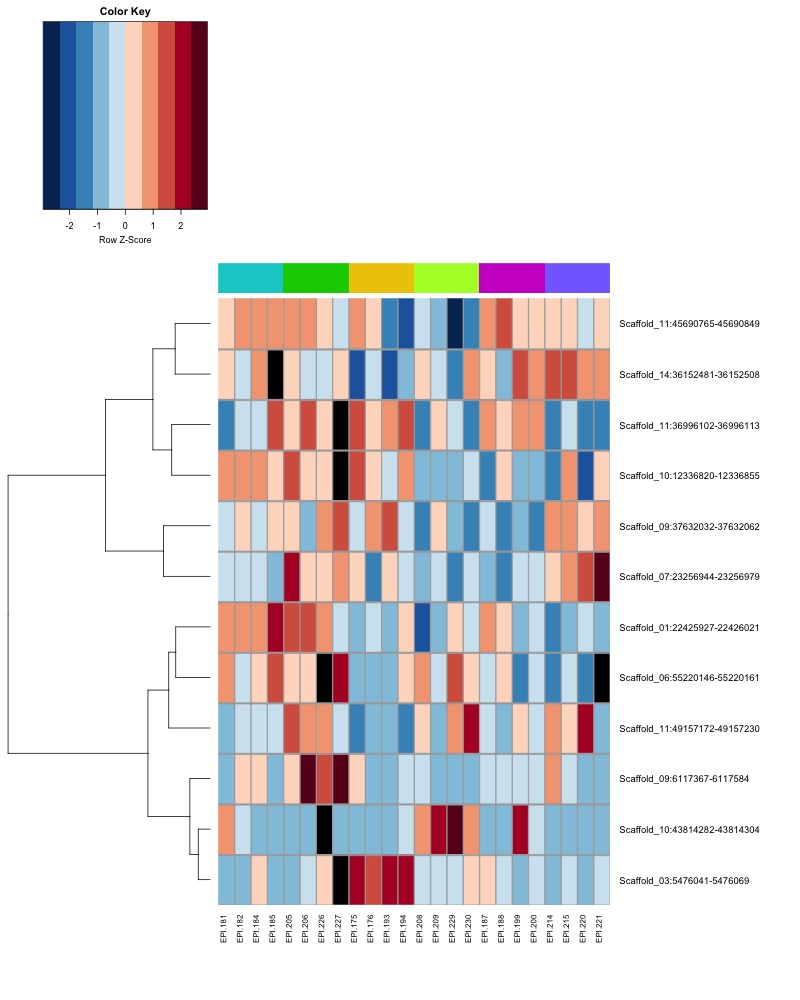
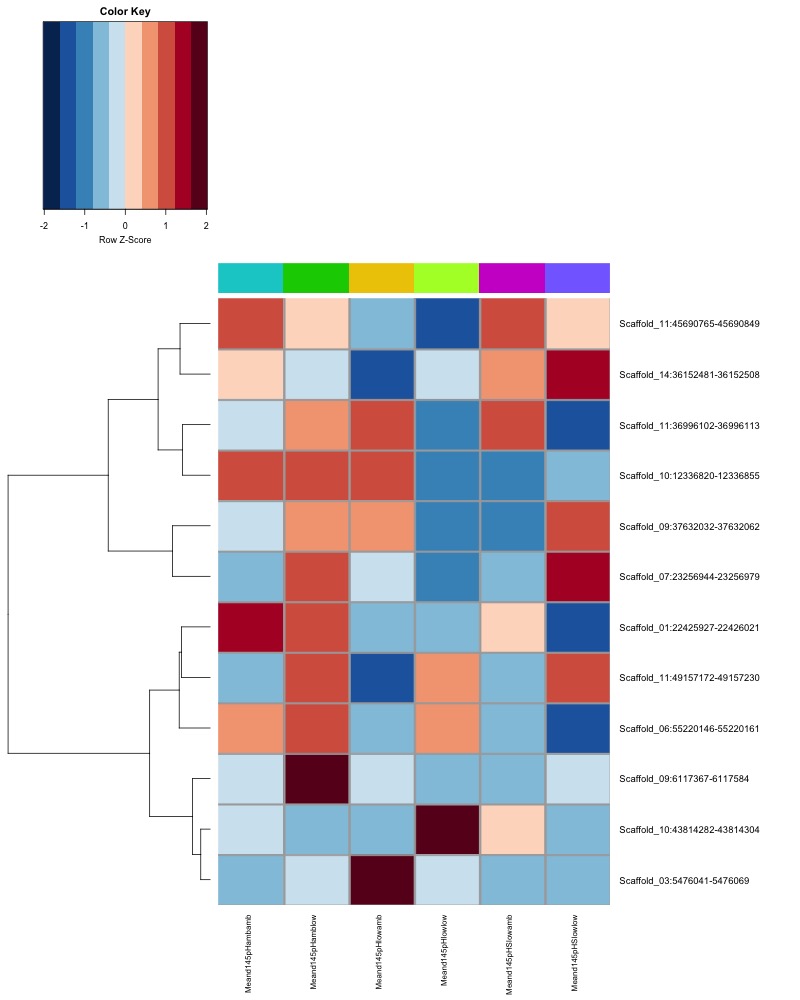
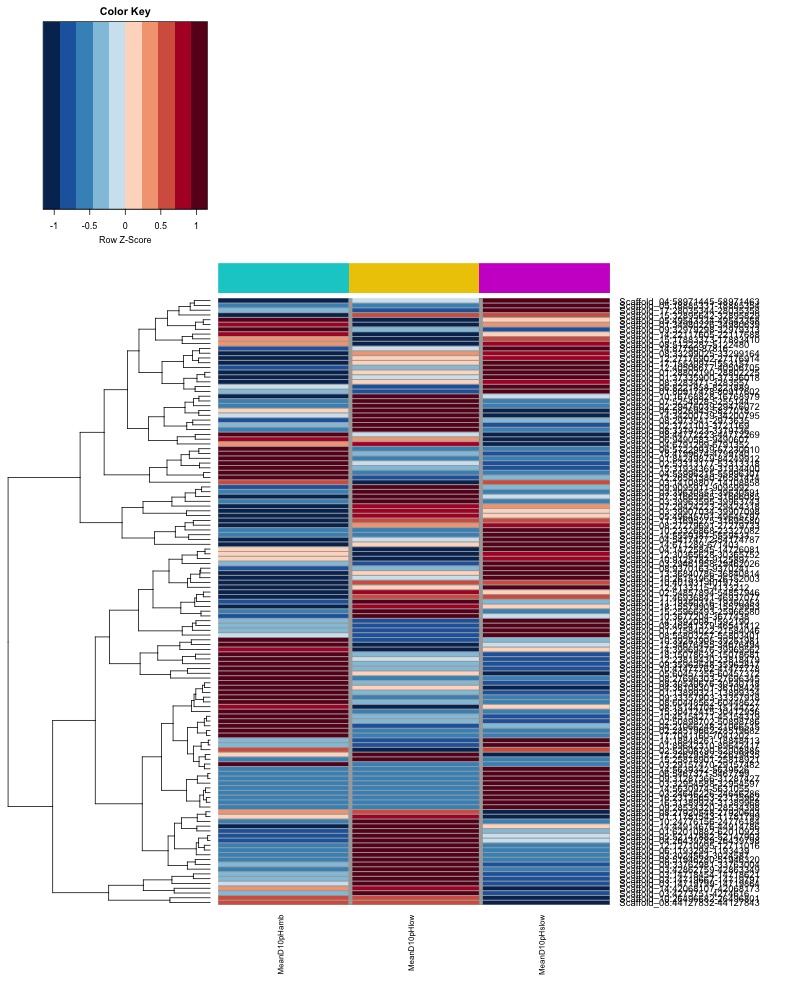
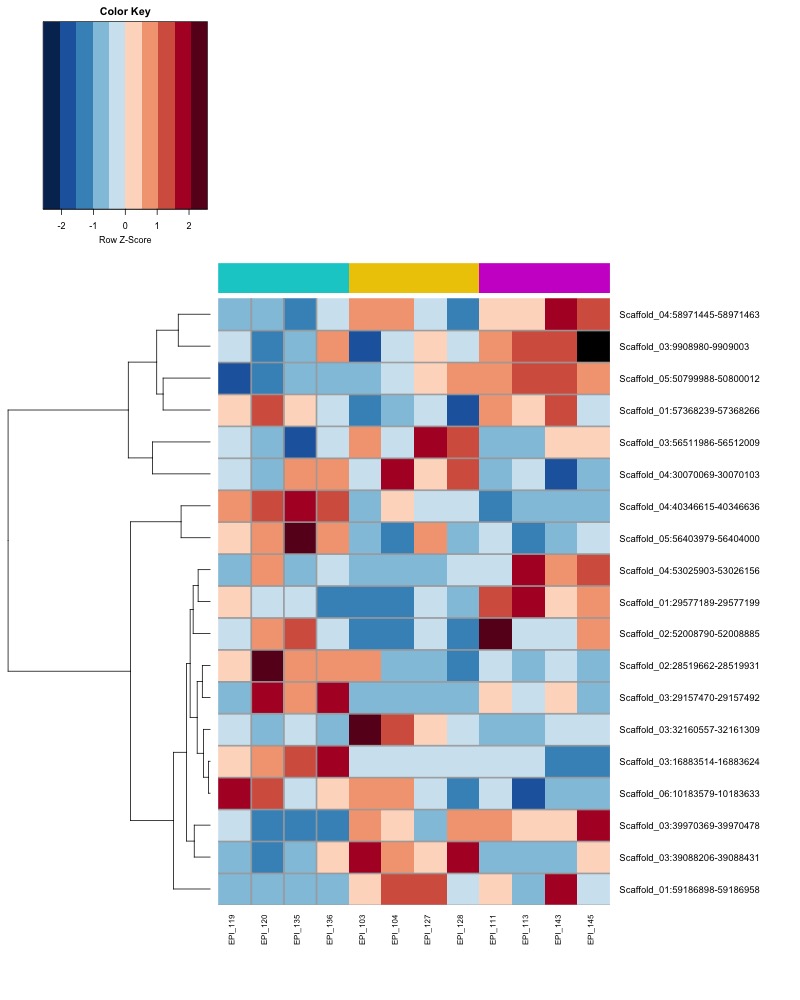
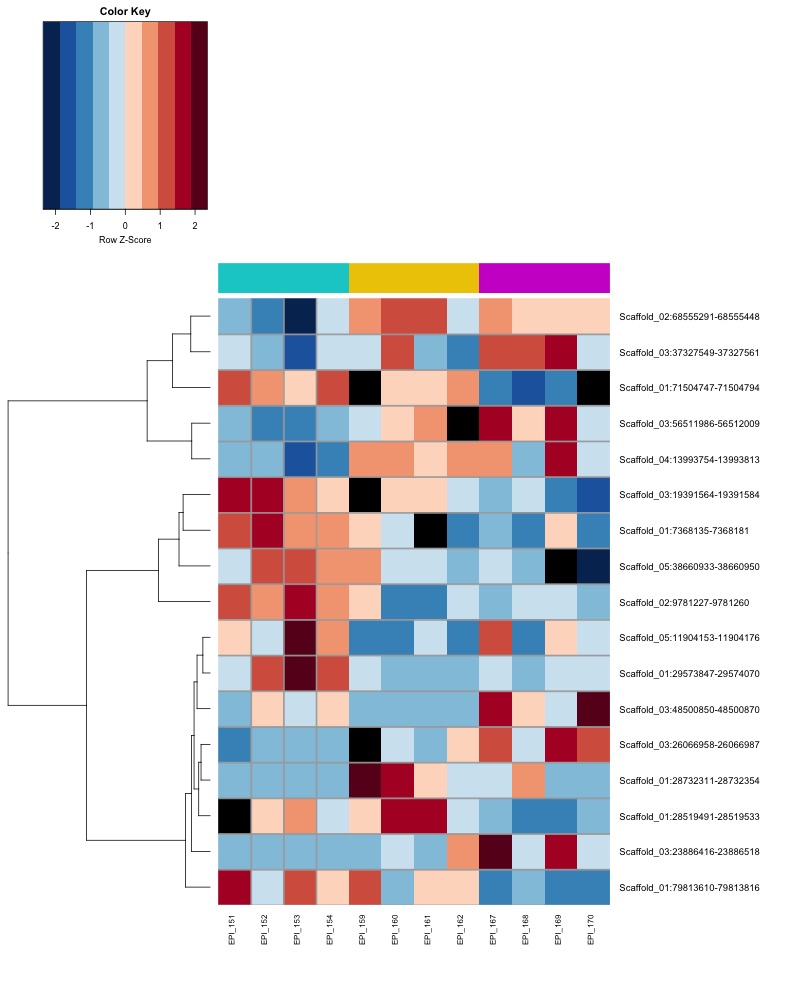
- heatmap of day10 DMRs that show a significant pH effect at p < 0.05 colored by % methylation
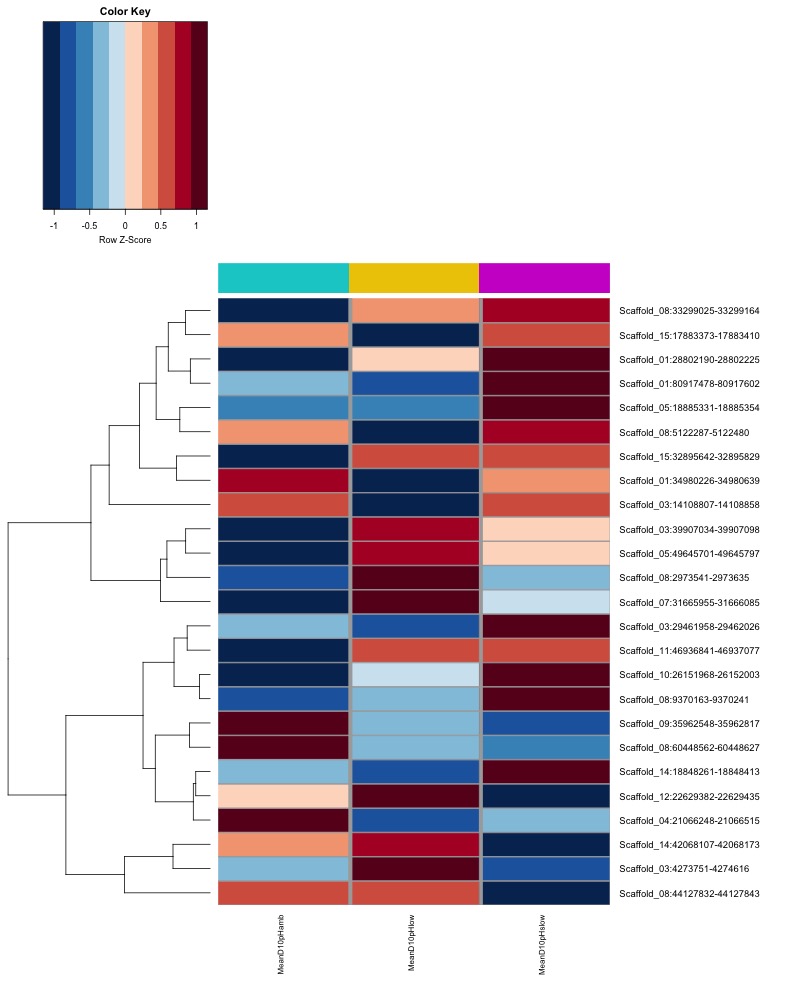
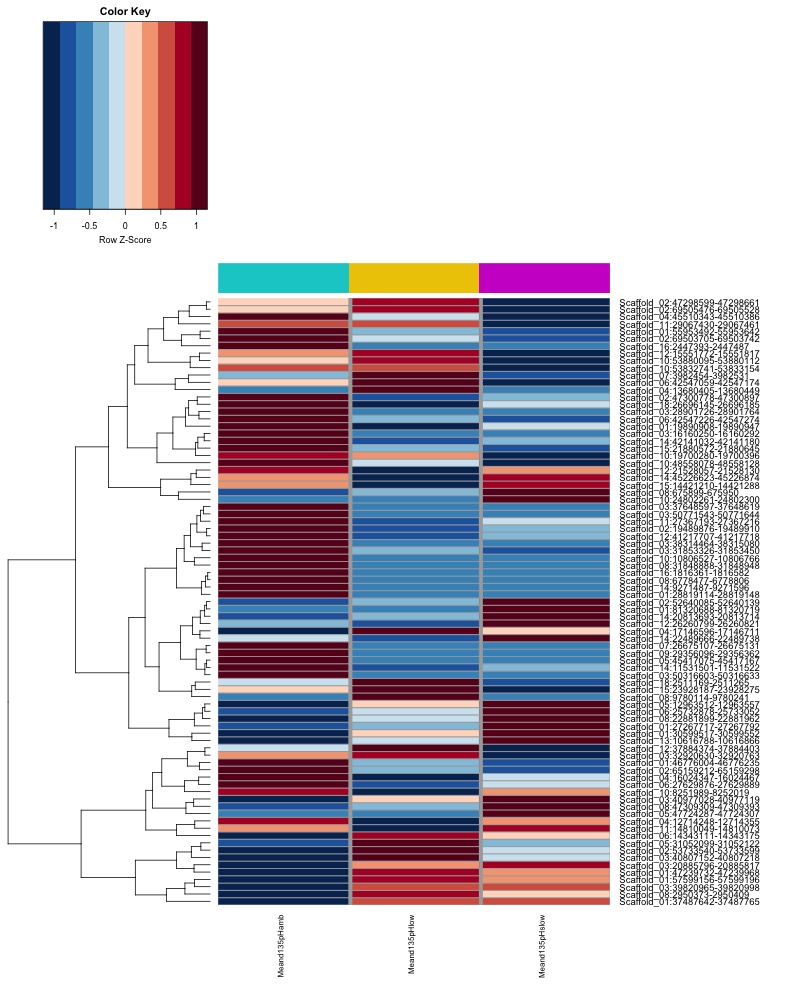
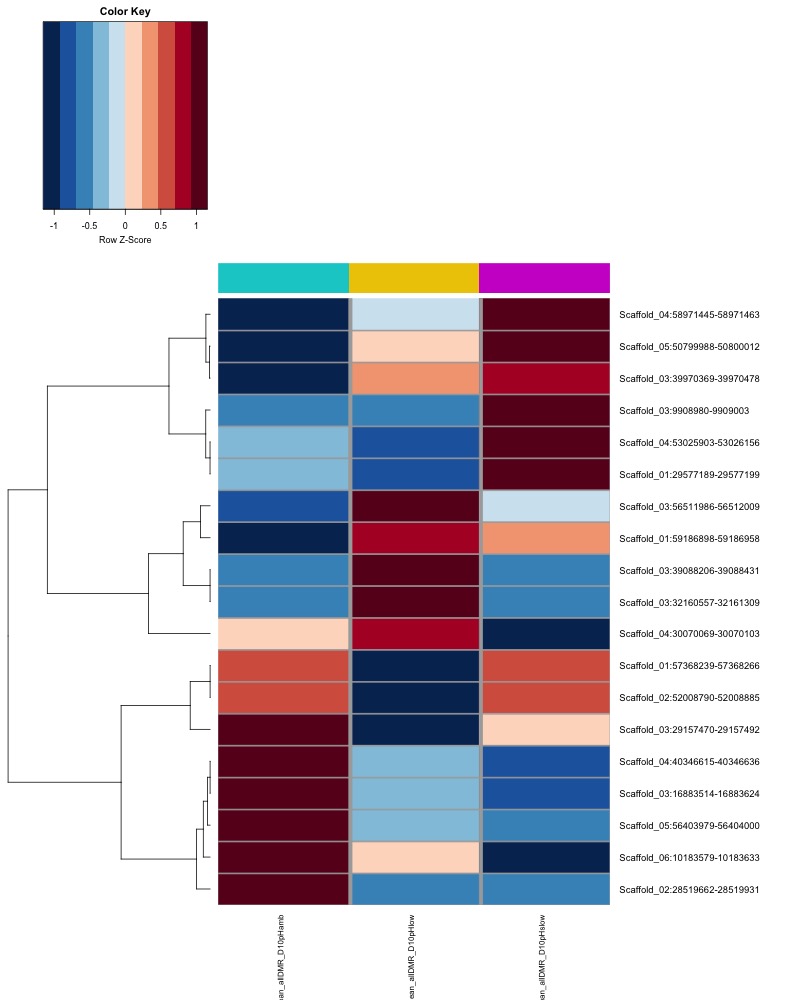
- heatmap of day10 DMRs that show a significant pH effect at p < 0.05 colored by mean % methylation
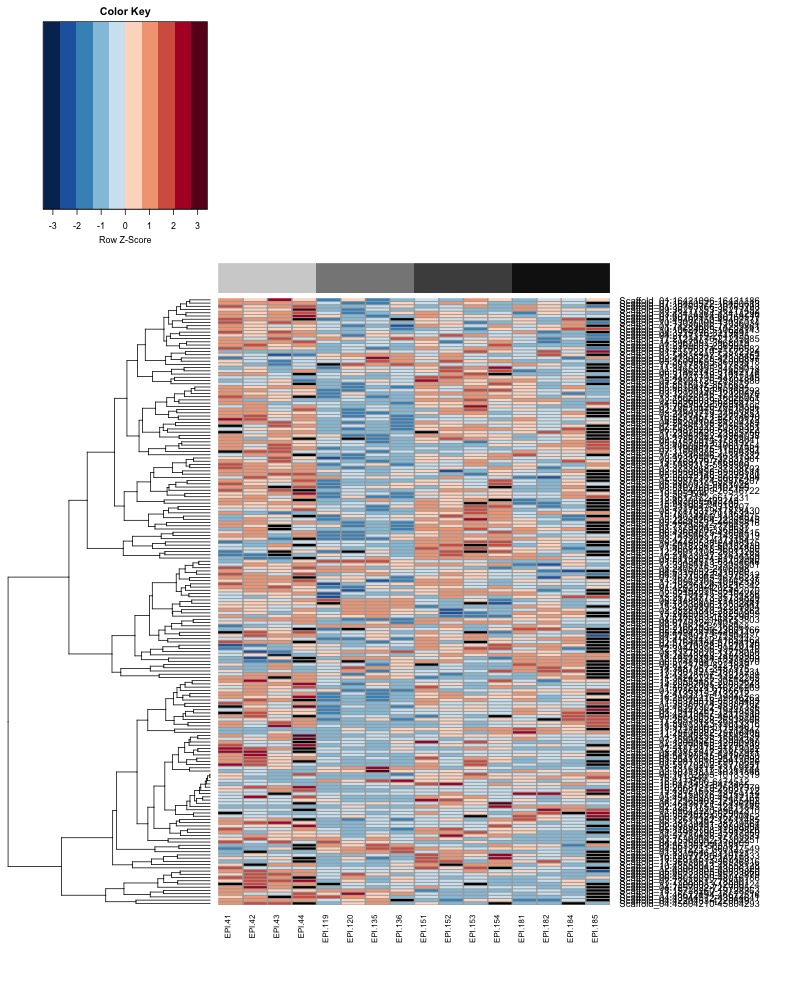
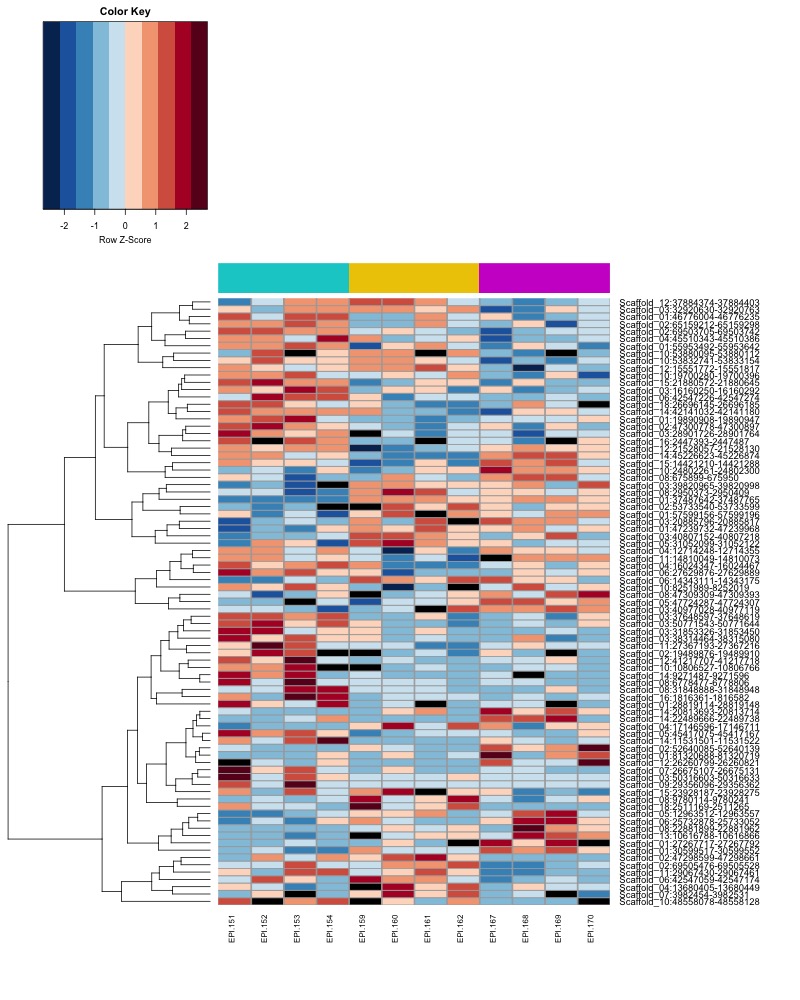
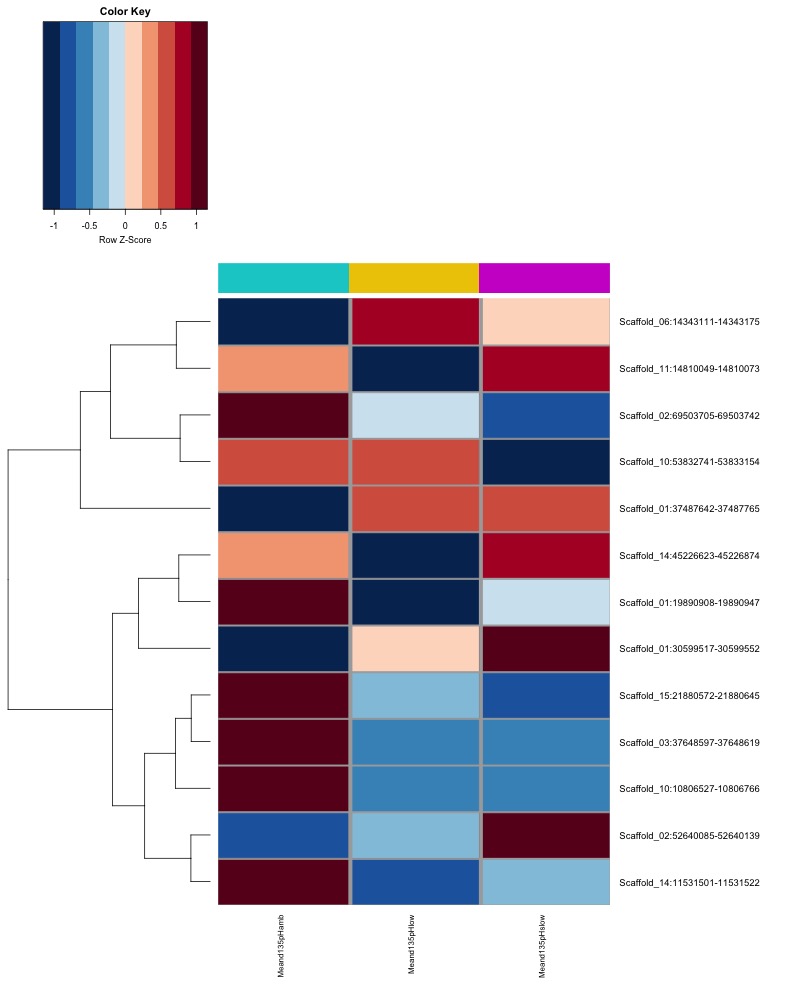
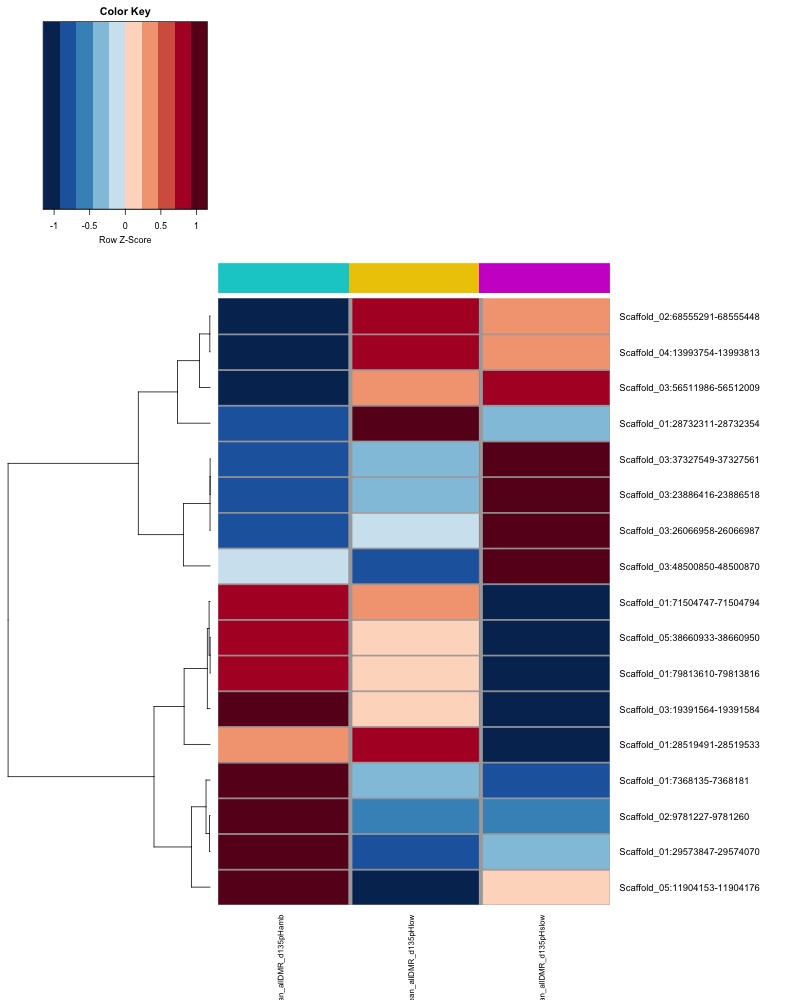
- heatmap of day135 DMRs that show a significant pH effect at p < 0.05 colored by % methylation
- heatmap of day135 DMRs that show a significant pH effect at p < 0.05 colored by mean % methylation
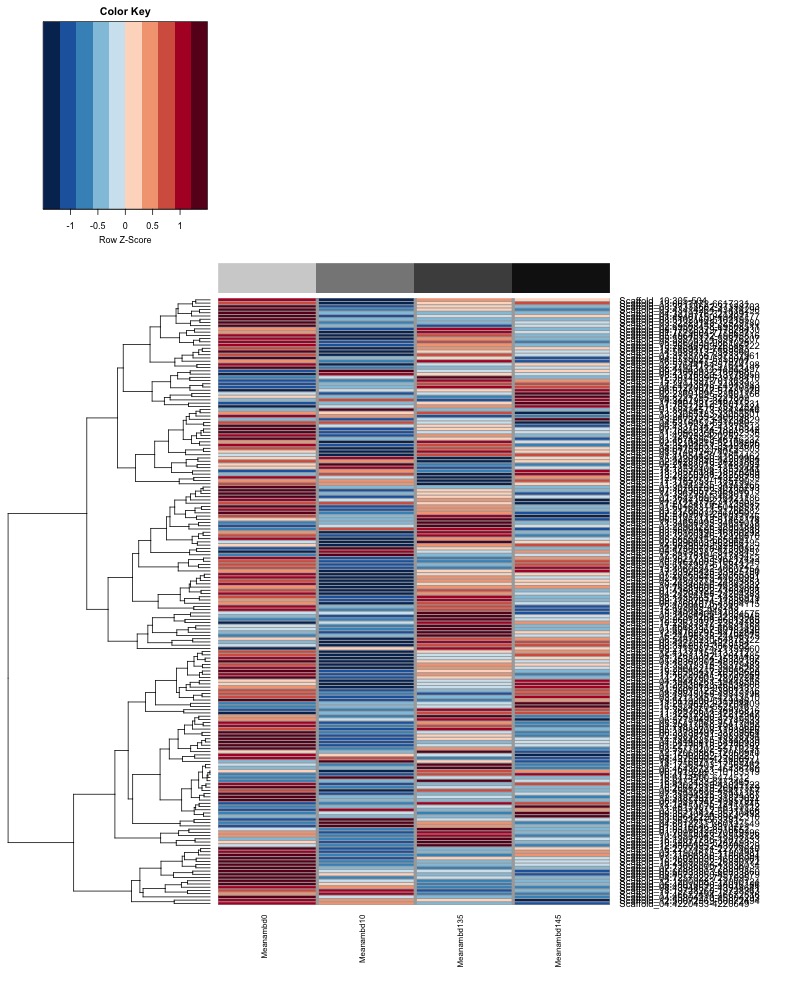
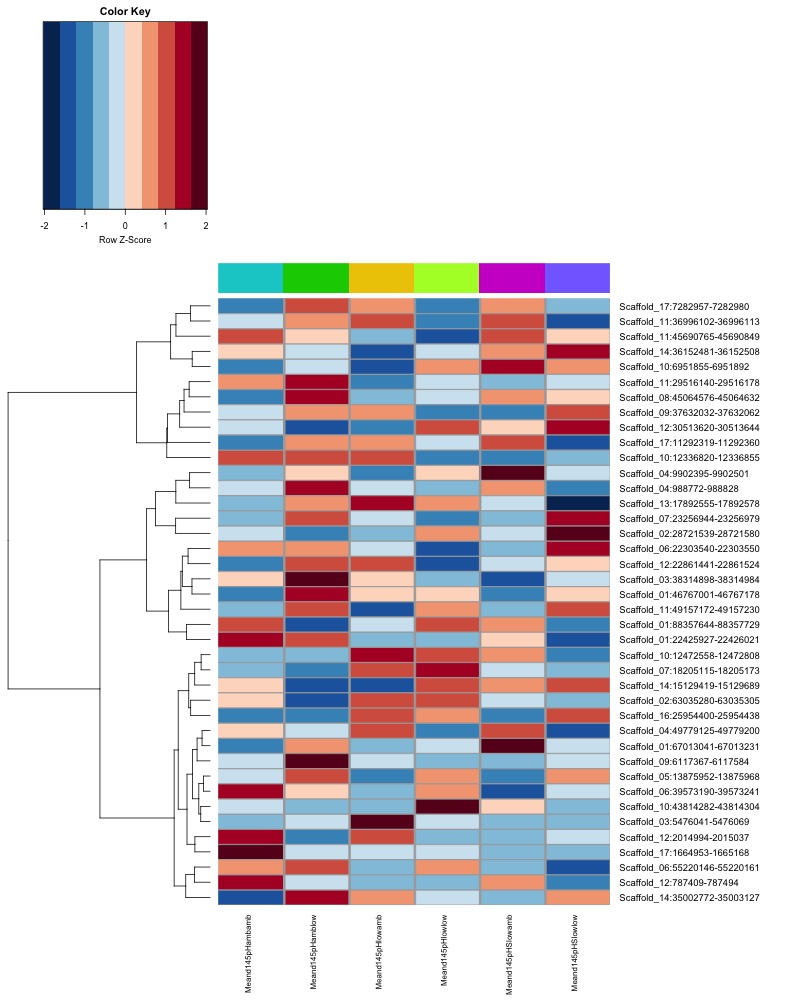
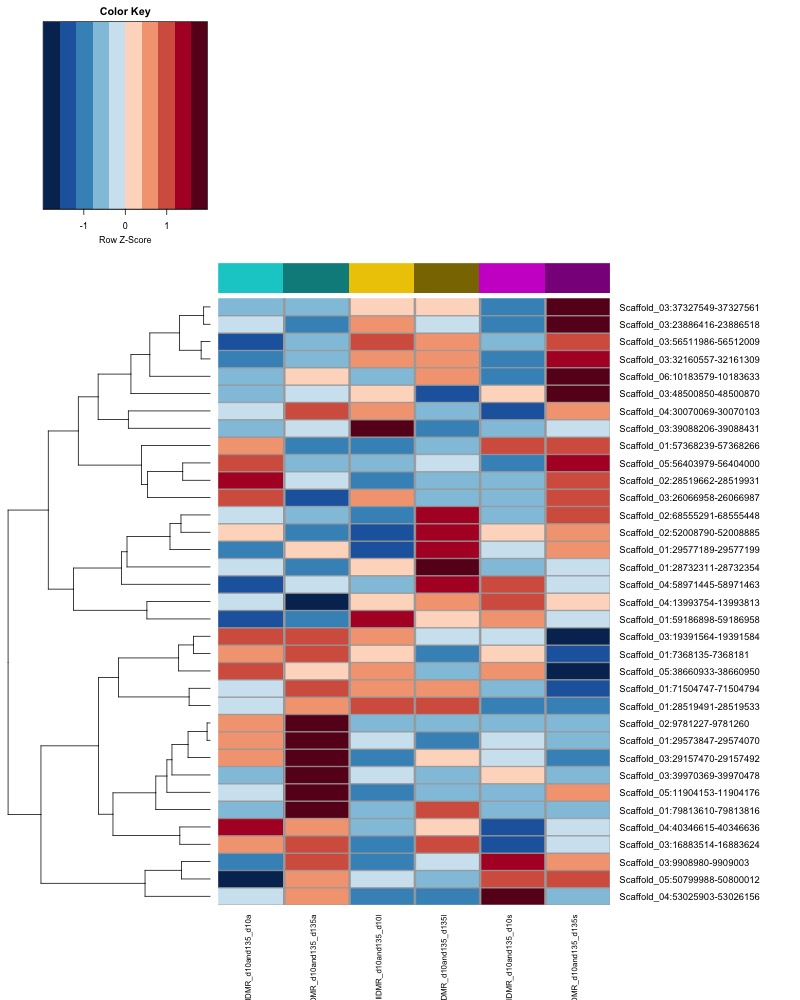
- heatmap of day 10 and day 135 DMRs that show a significant pH effect at p < 0.05 colored by mean % methylation
- day 10 data:
Conclusions:
- When I ran DMRfind on just the Day 10 samples and on just the Day 135 samples, then performed ANOVA on regions identified in each DMRfind run, there were no overlapping DMRs with significant pH effect (ANOVA p value < 0.05)
- When I ran DMRfind on all 52 samples, then performed ANOVA on regions identified, 1 DMR (scaffold 3: 56511986-56512009) showing a significant pH effect (ANOVA pvalue < 0.05) was overlapping between day 10 and day 135 samples
- ANOVA is not the best test to be using for this data because it is not normal
- a GLM would likely be more sensitive but I would need to reformat the data to run this test (determine # Cs and # mCs for each region).
- This is possible by running bedtools intersect or closest on DMR bedfile and counts (5x.tab) files https://osf.io/yem8n/files/ and then collapsing/summing the counts for DMRs. But I would need to code it.
- a GLM would likely be more sensitive but I would need to reformat the data to run this test (determine # Cs and # mCs for each region).
- For now, I’m just going to go with the results from running Methylpy DMRfind on all samples together.