Plotting % methylation of DMRs ID’d with ANOVA
I added lines 312-365 to this R markdown script MCmax30_asinT_groupStats.Rmd to plot group means of % methylation for each of the 4 comparisons (all ambient samples, all day 10 samples, all day 135 samples, and all day 145 samples).
I changed the heat colors to match more closely with the heatmaps Hollie has been generating. We determined that row scaling in the heatmap is the best way to visualize group differences in methylation for each comparison and that pheatmap defaults to no scaling
Significant DMRs from all ambient samples:
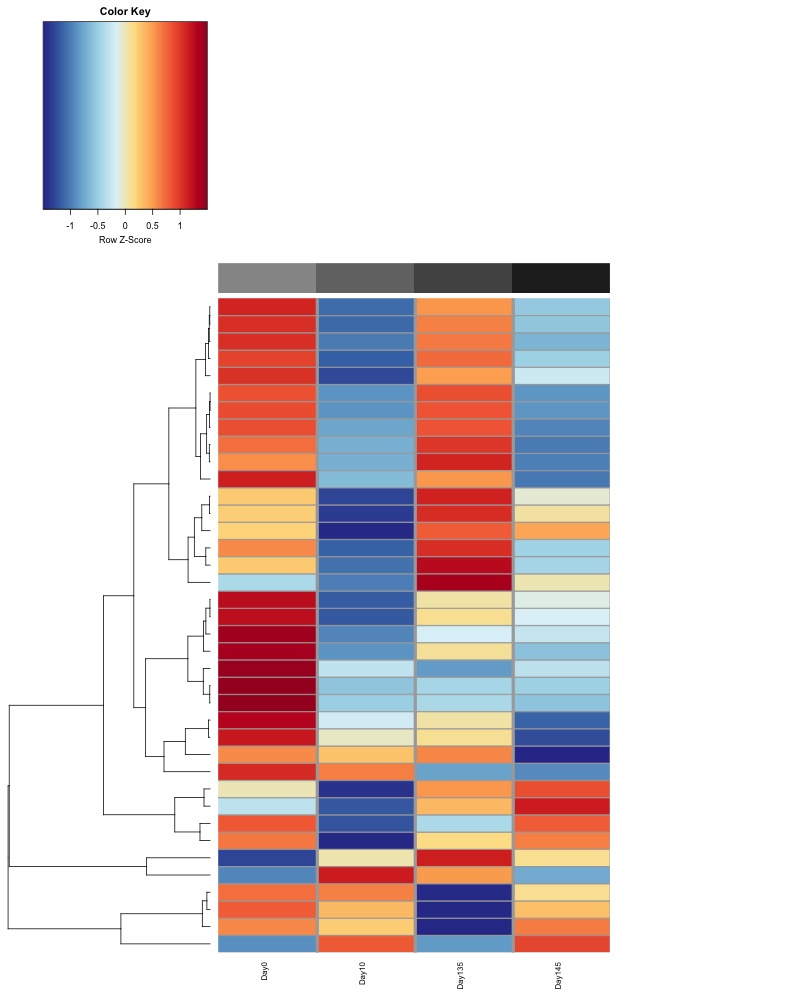
Significant DMRs from all Day 10 samples:
Significant DMRs from all Day 135 samples:

Significant DMRs from all Day 145 samples:

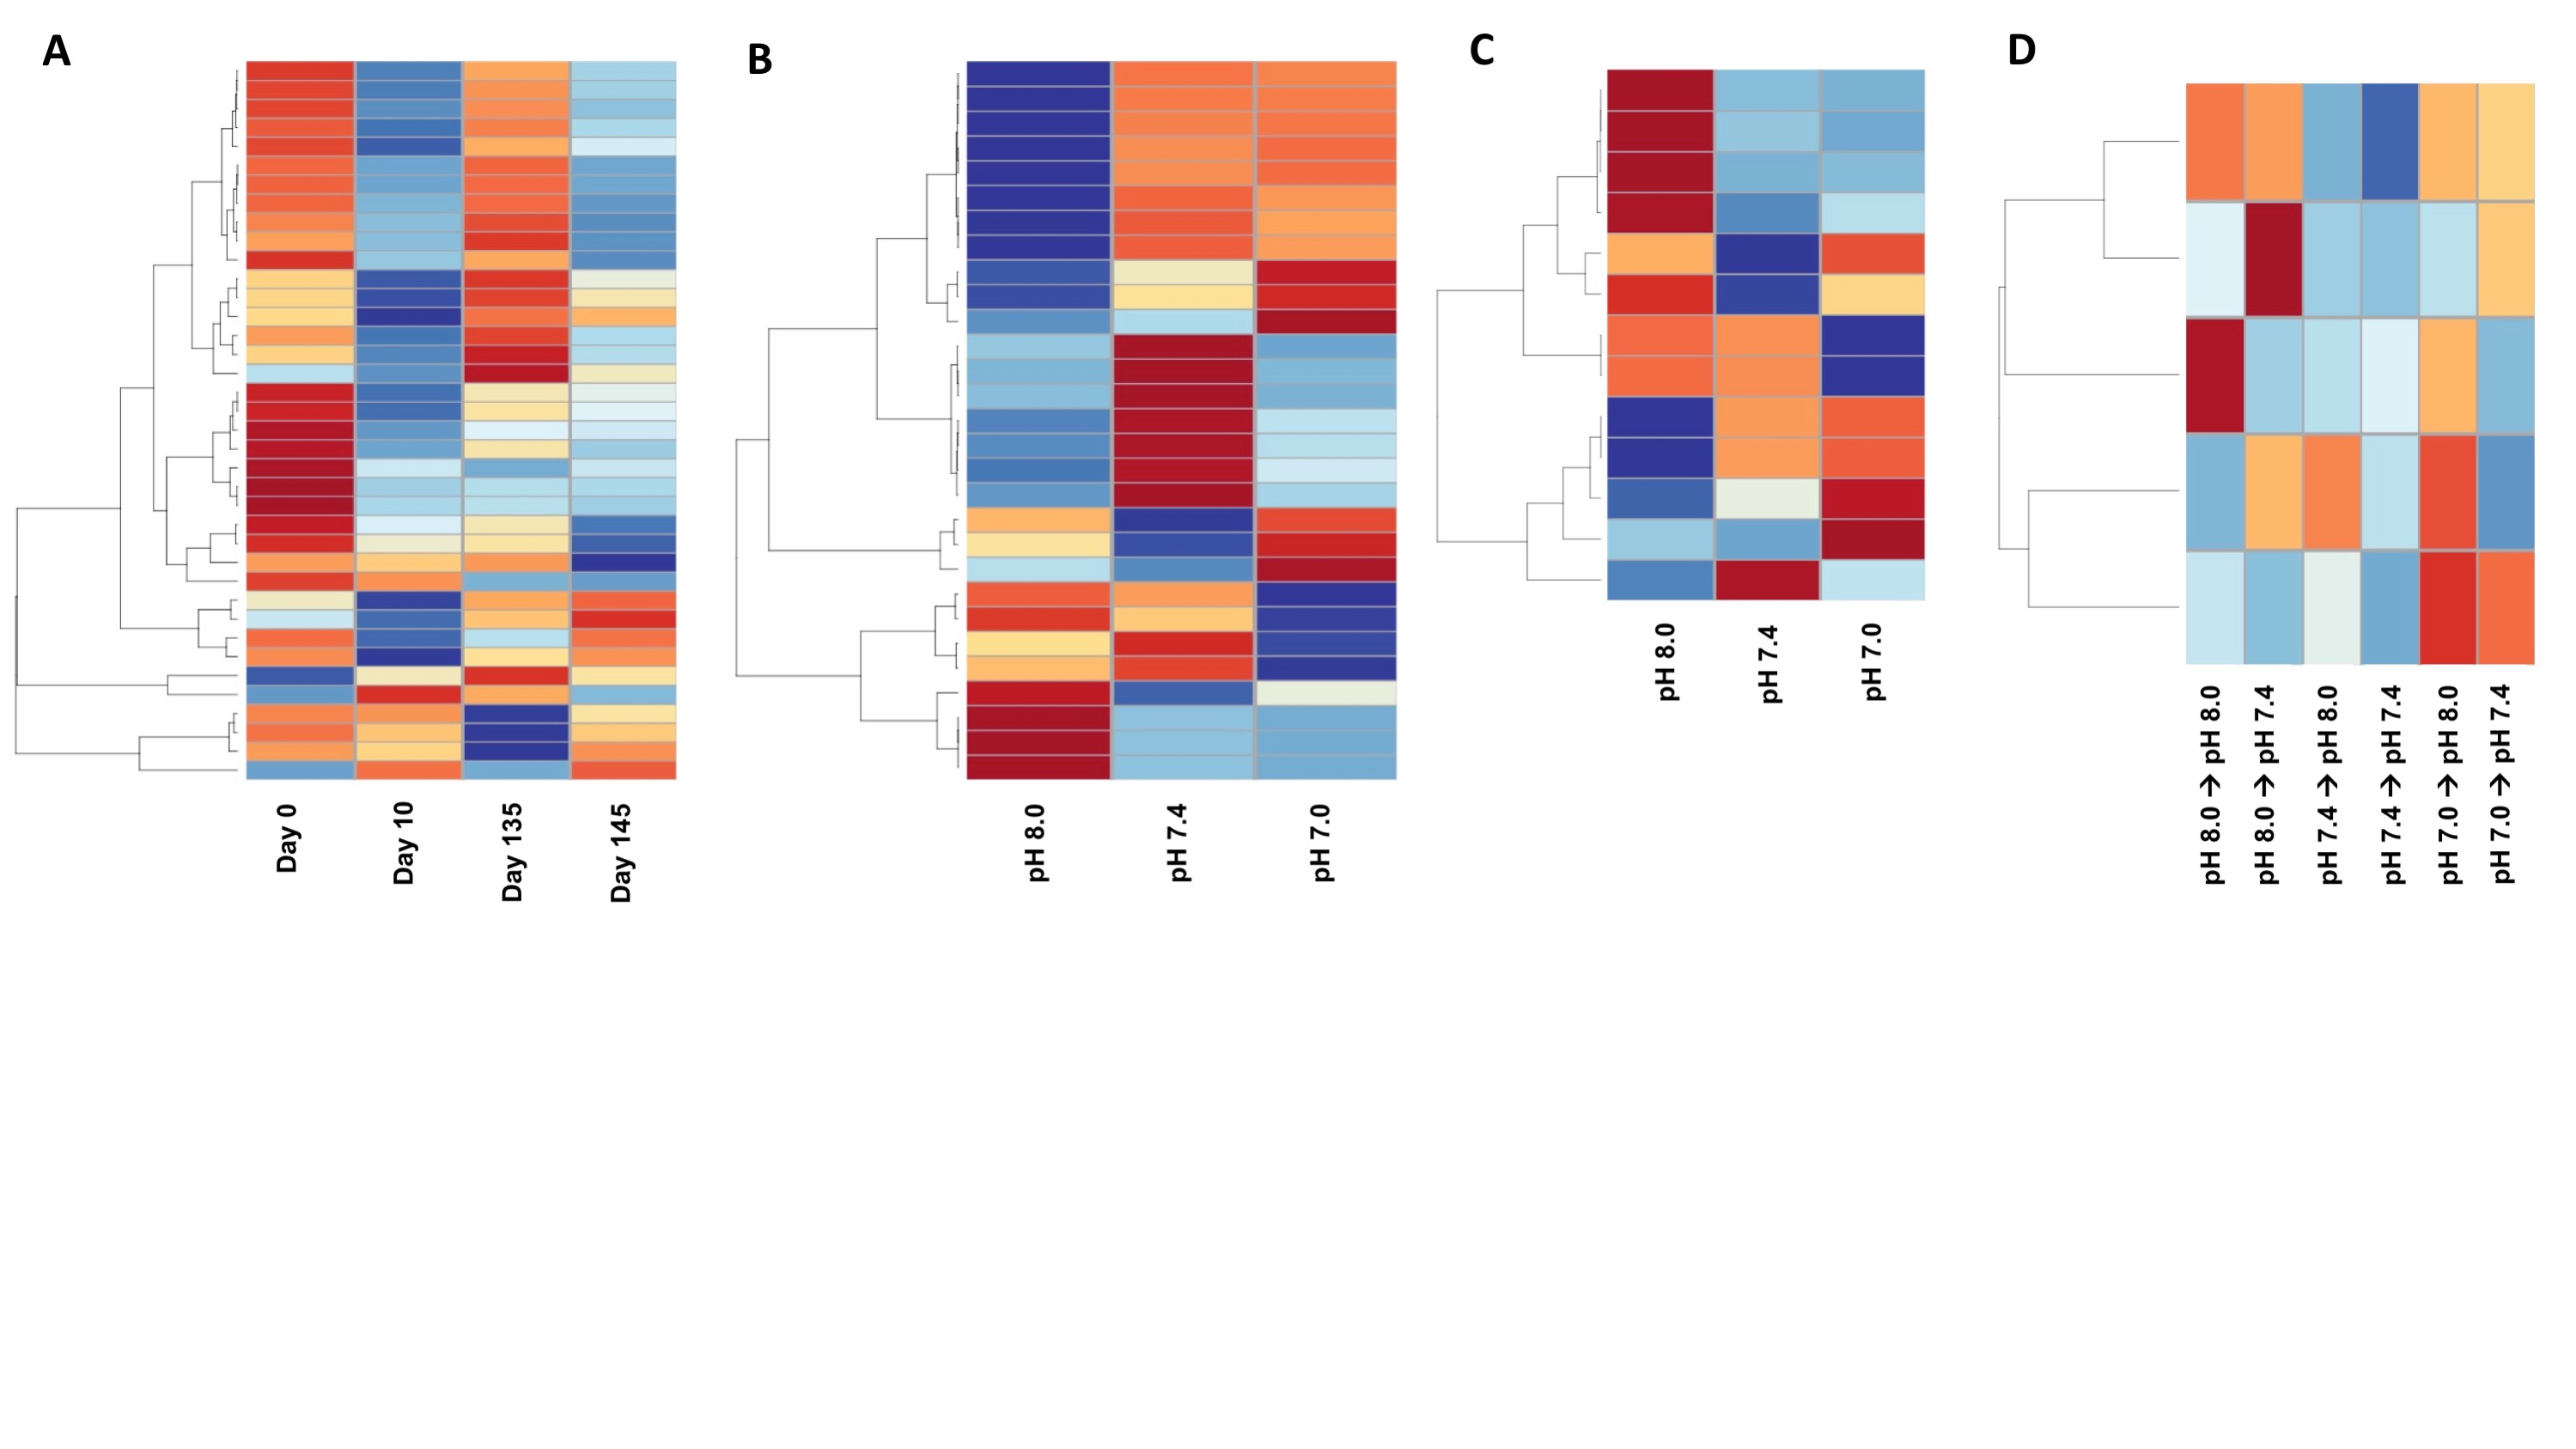
Finally I created a figure for the manuscript with these heatmaps:
Next steps are to:
- determine from GO enrichment which DMRs in which genes are mainly contributing to enriched terms
- compare DMRs with Hollie’s DMGs and determine overlap (will do this at meeting on Friday)
- compare GO enrichment results for DMRs with Hollie’s results for DMGs
- There is defintely a difference in the number of DMGs identified by the binomial glm that Hollie ran (>1000 gene significant at FDR adj. p value < 0.05) and the number of DMRs identified by the ANOVA I ran (38 DMRs signficant at uncorrected ANOVA p value < 0.1). Determine if a different method (e.g. binomial glm) should be used for identifying significant DMRs.