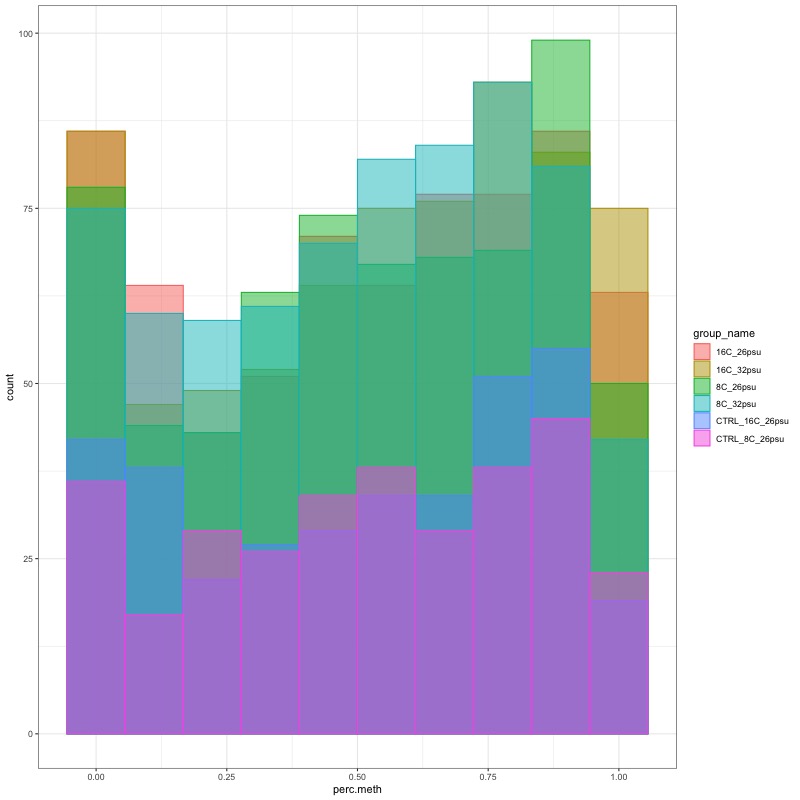
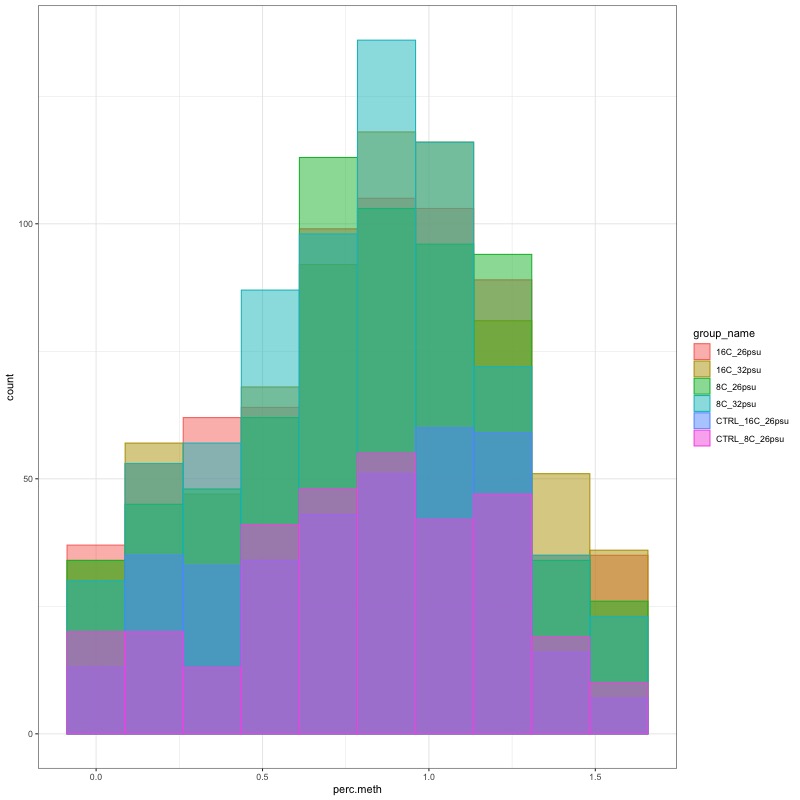
filtered DMRs for those showing >=5x coverage in 3/4 samples per group. I didn’t use this cutoff for the control samples since these each only has two individuals.
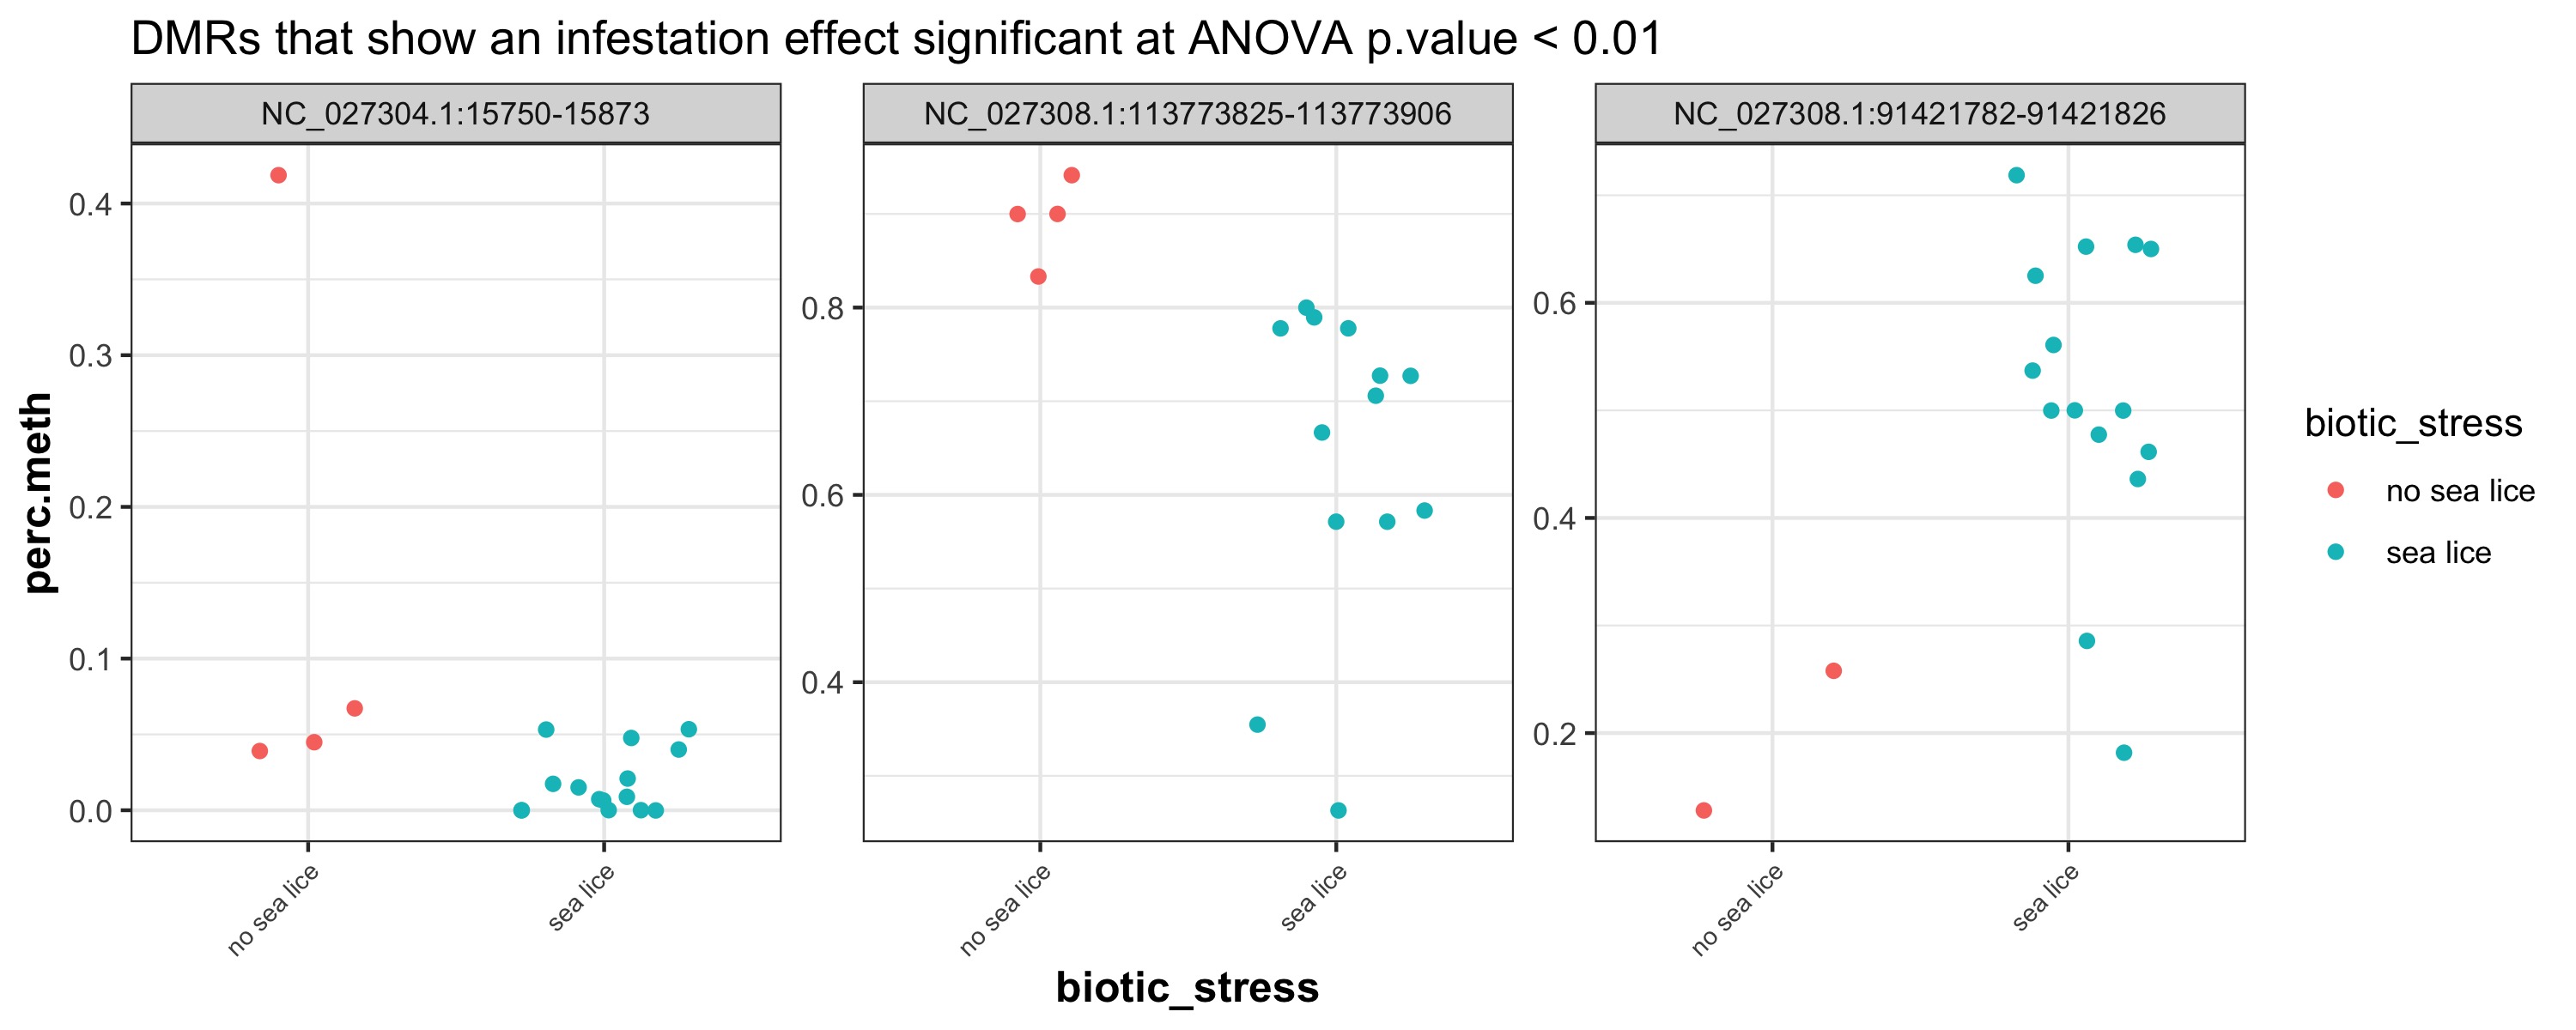
3 DMRs showed a significant infestation effect at 1way ANOVA p-value of < 0.01
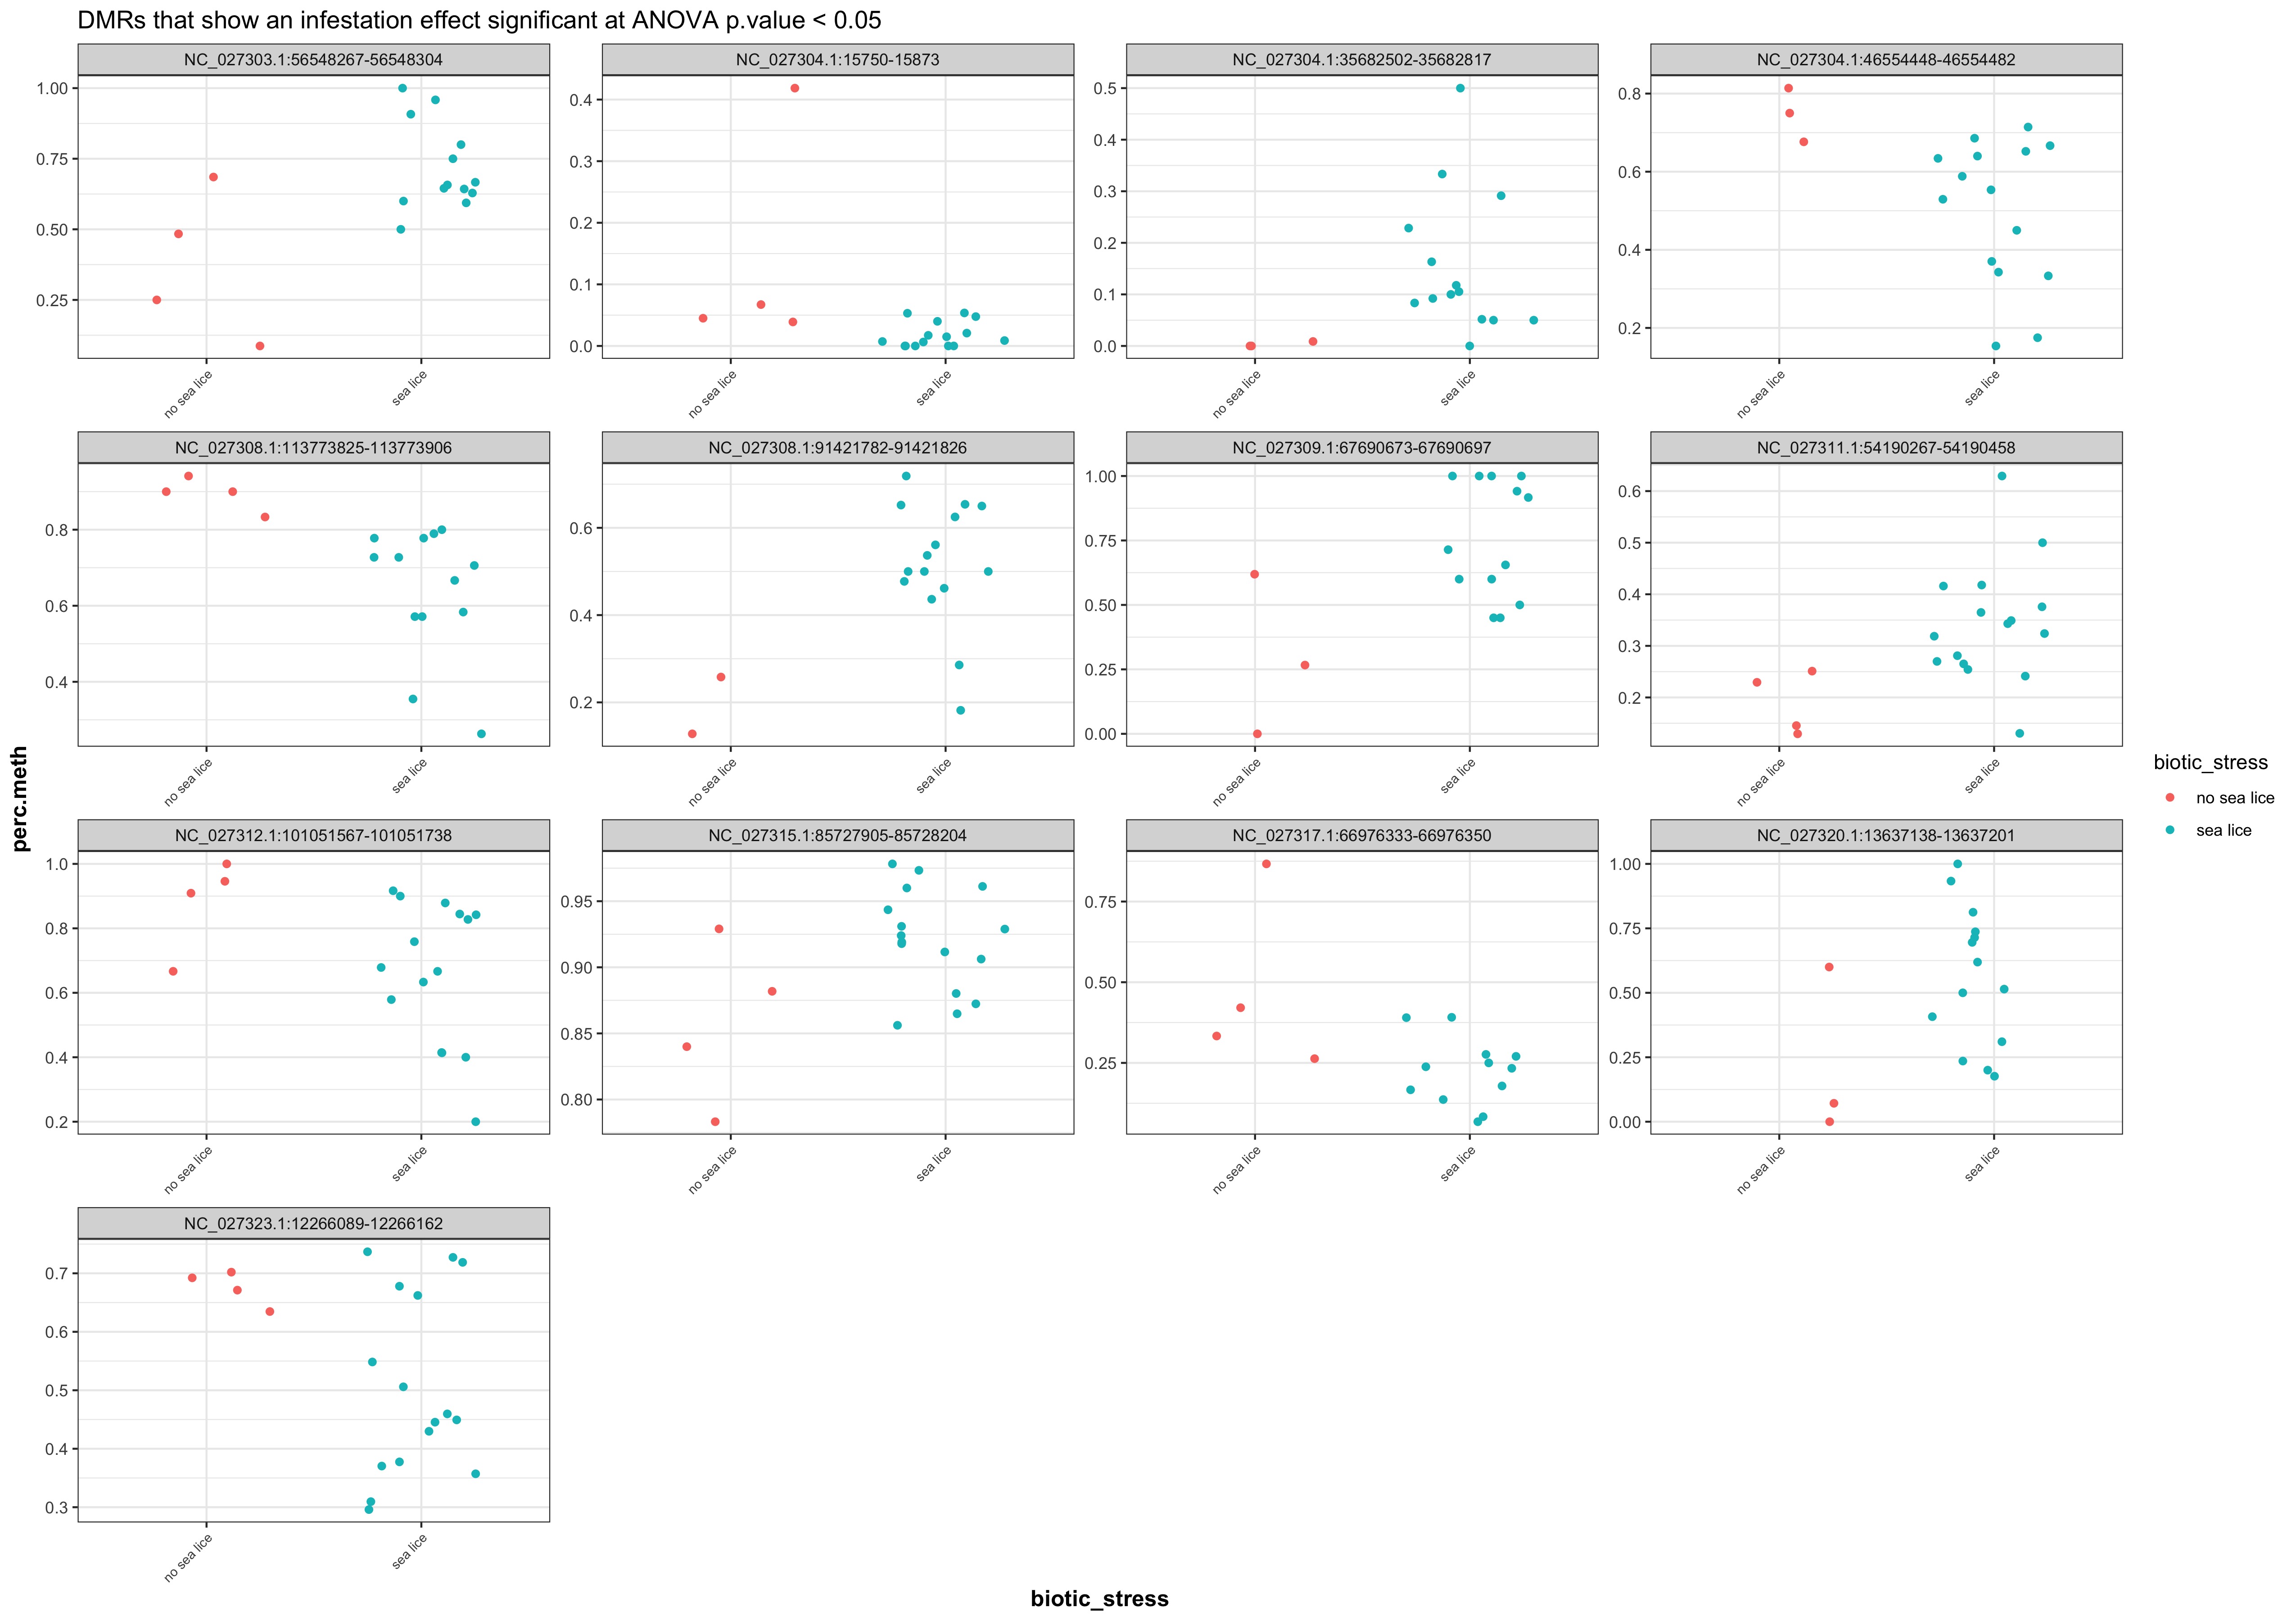
13 DMRs showed a significant infestation effect at 1way ANOVA p-value of < 0.05
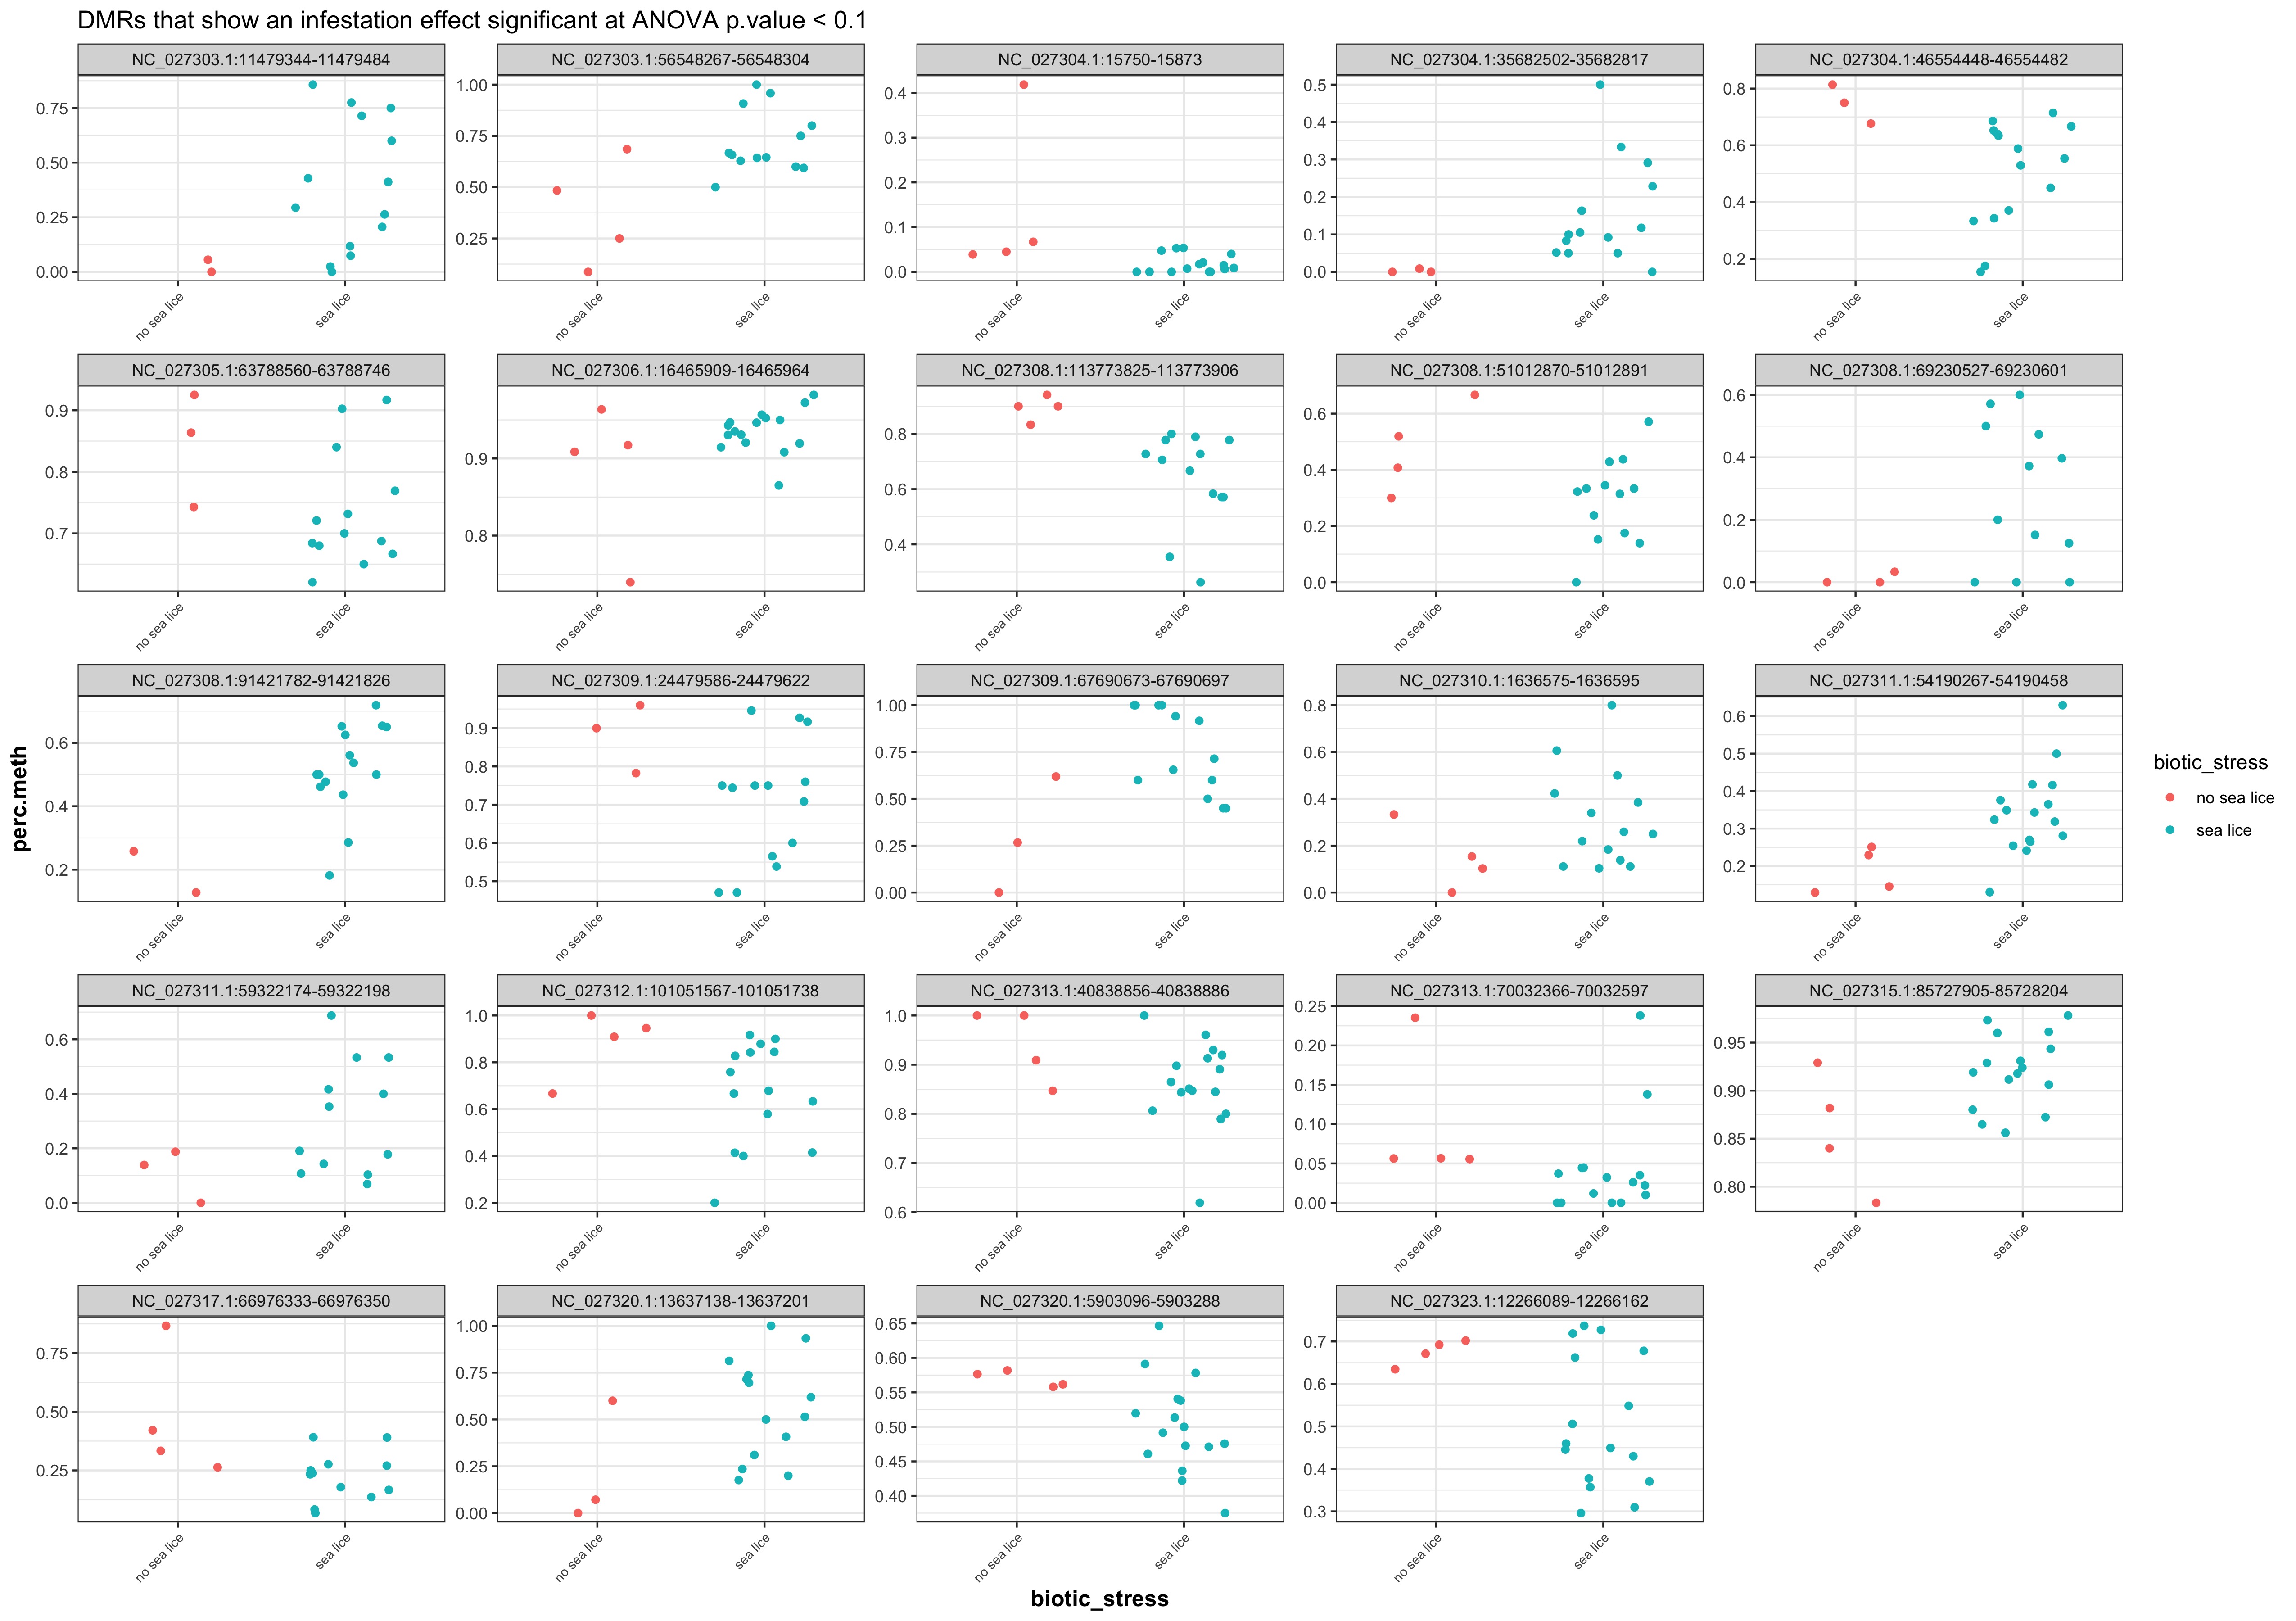
24 DMRs showed a significant infestation effect at 1way ANOVA p-value of < 0.1
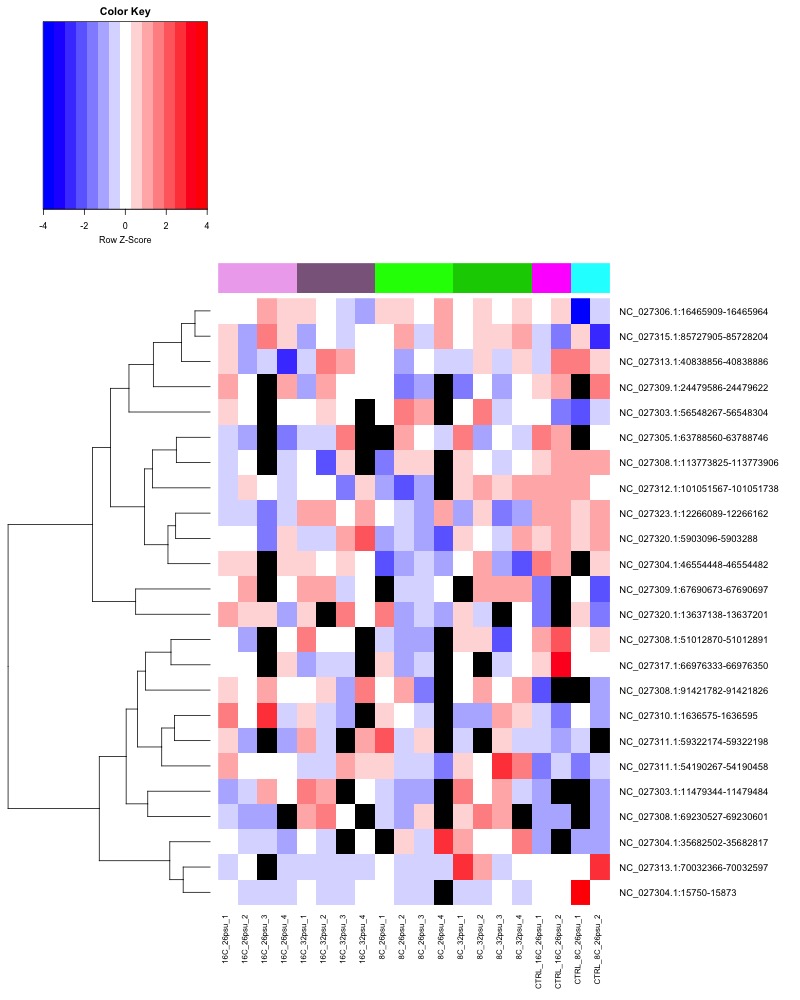
Heatmap of 24 DMRs that showed a significant infestation effect at 1way ANOVA p-value of < 0.1. Heatmap key:Column color bar in heat maps below: light pink = 16C_26psu, dark pink = 16C_32psu, light green = 8C_26psu, dark green = 8C_32psu, magenta = CTRL_16C_26psu, cyan = CTRL_8C_26psu. heatmap color: Red = more methylation, blue = no methylation, black = no data.
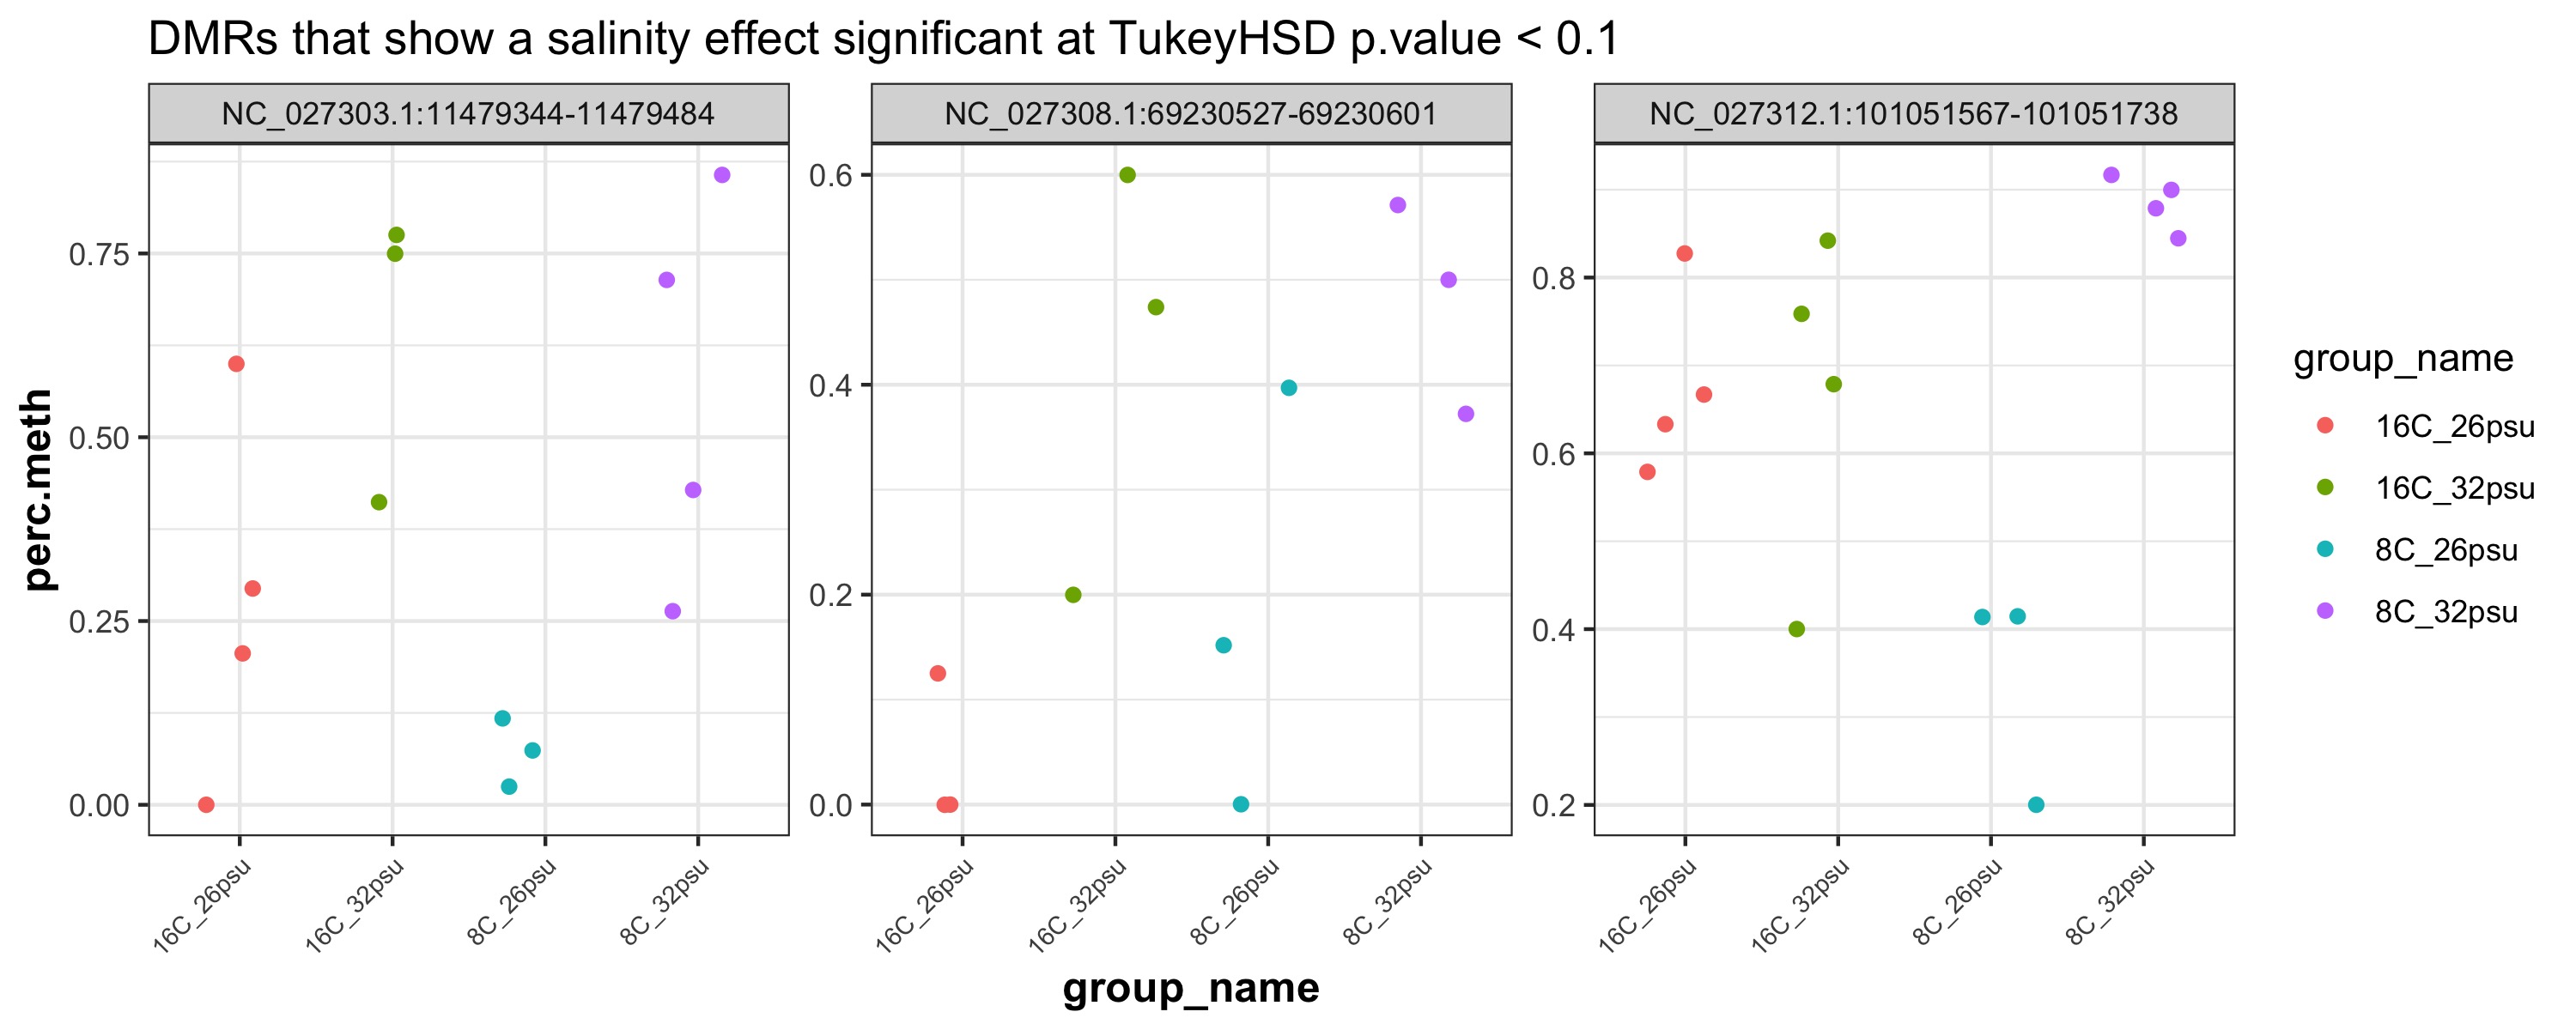
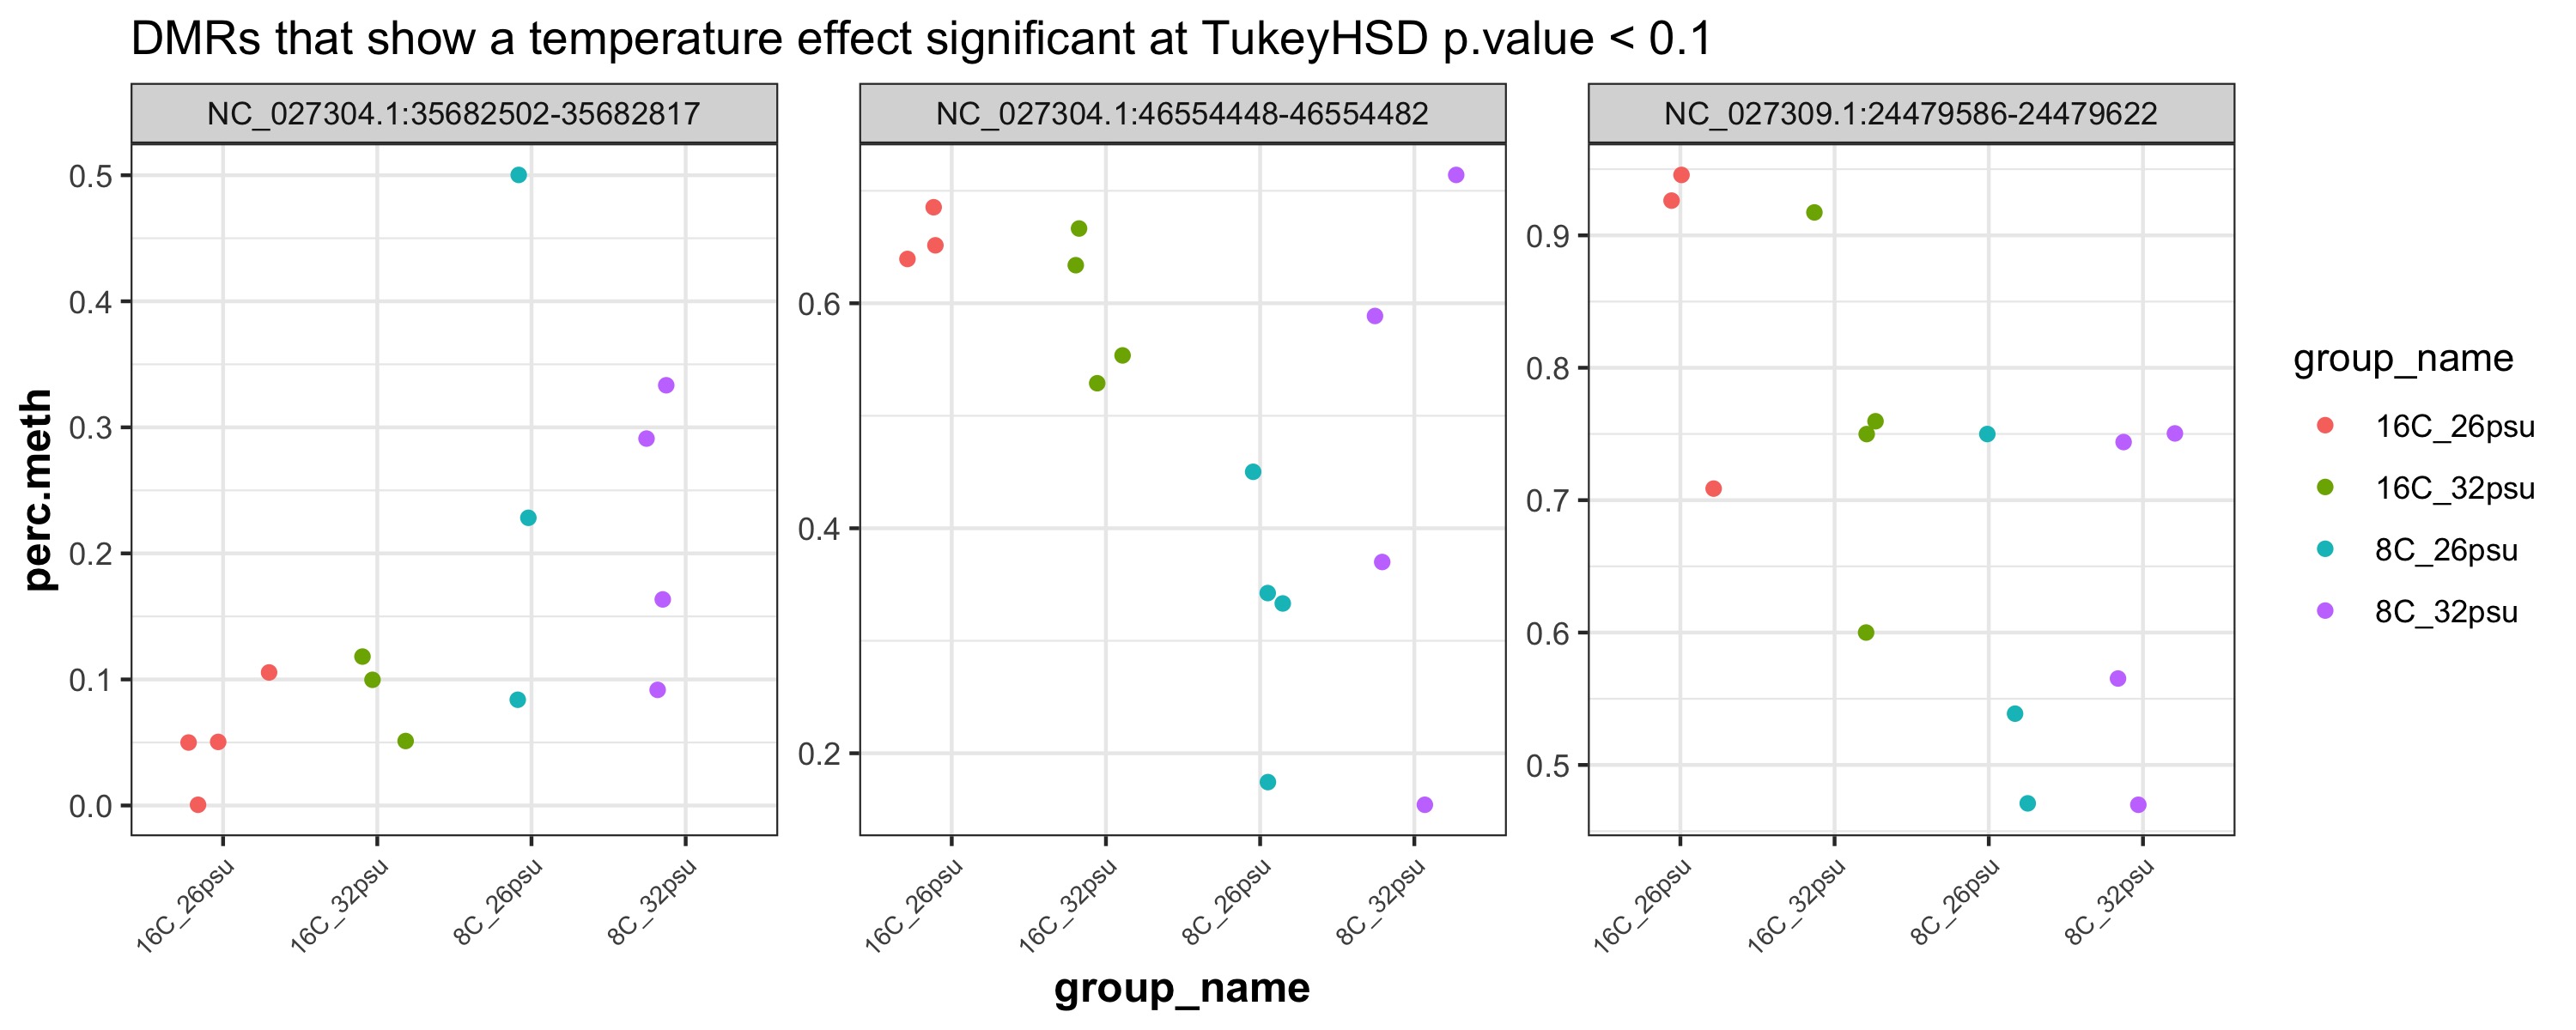
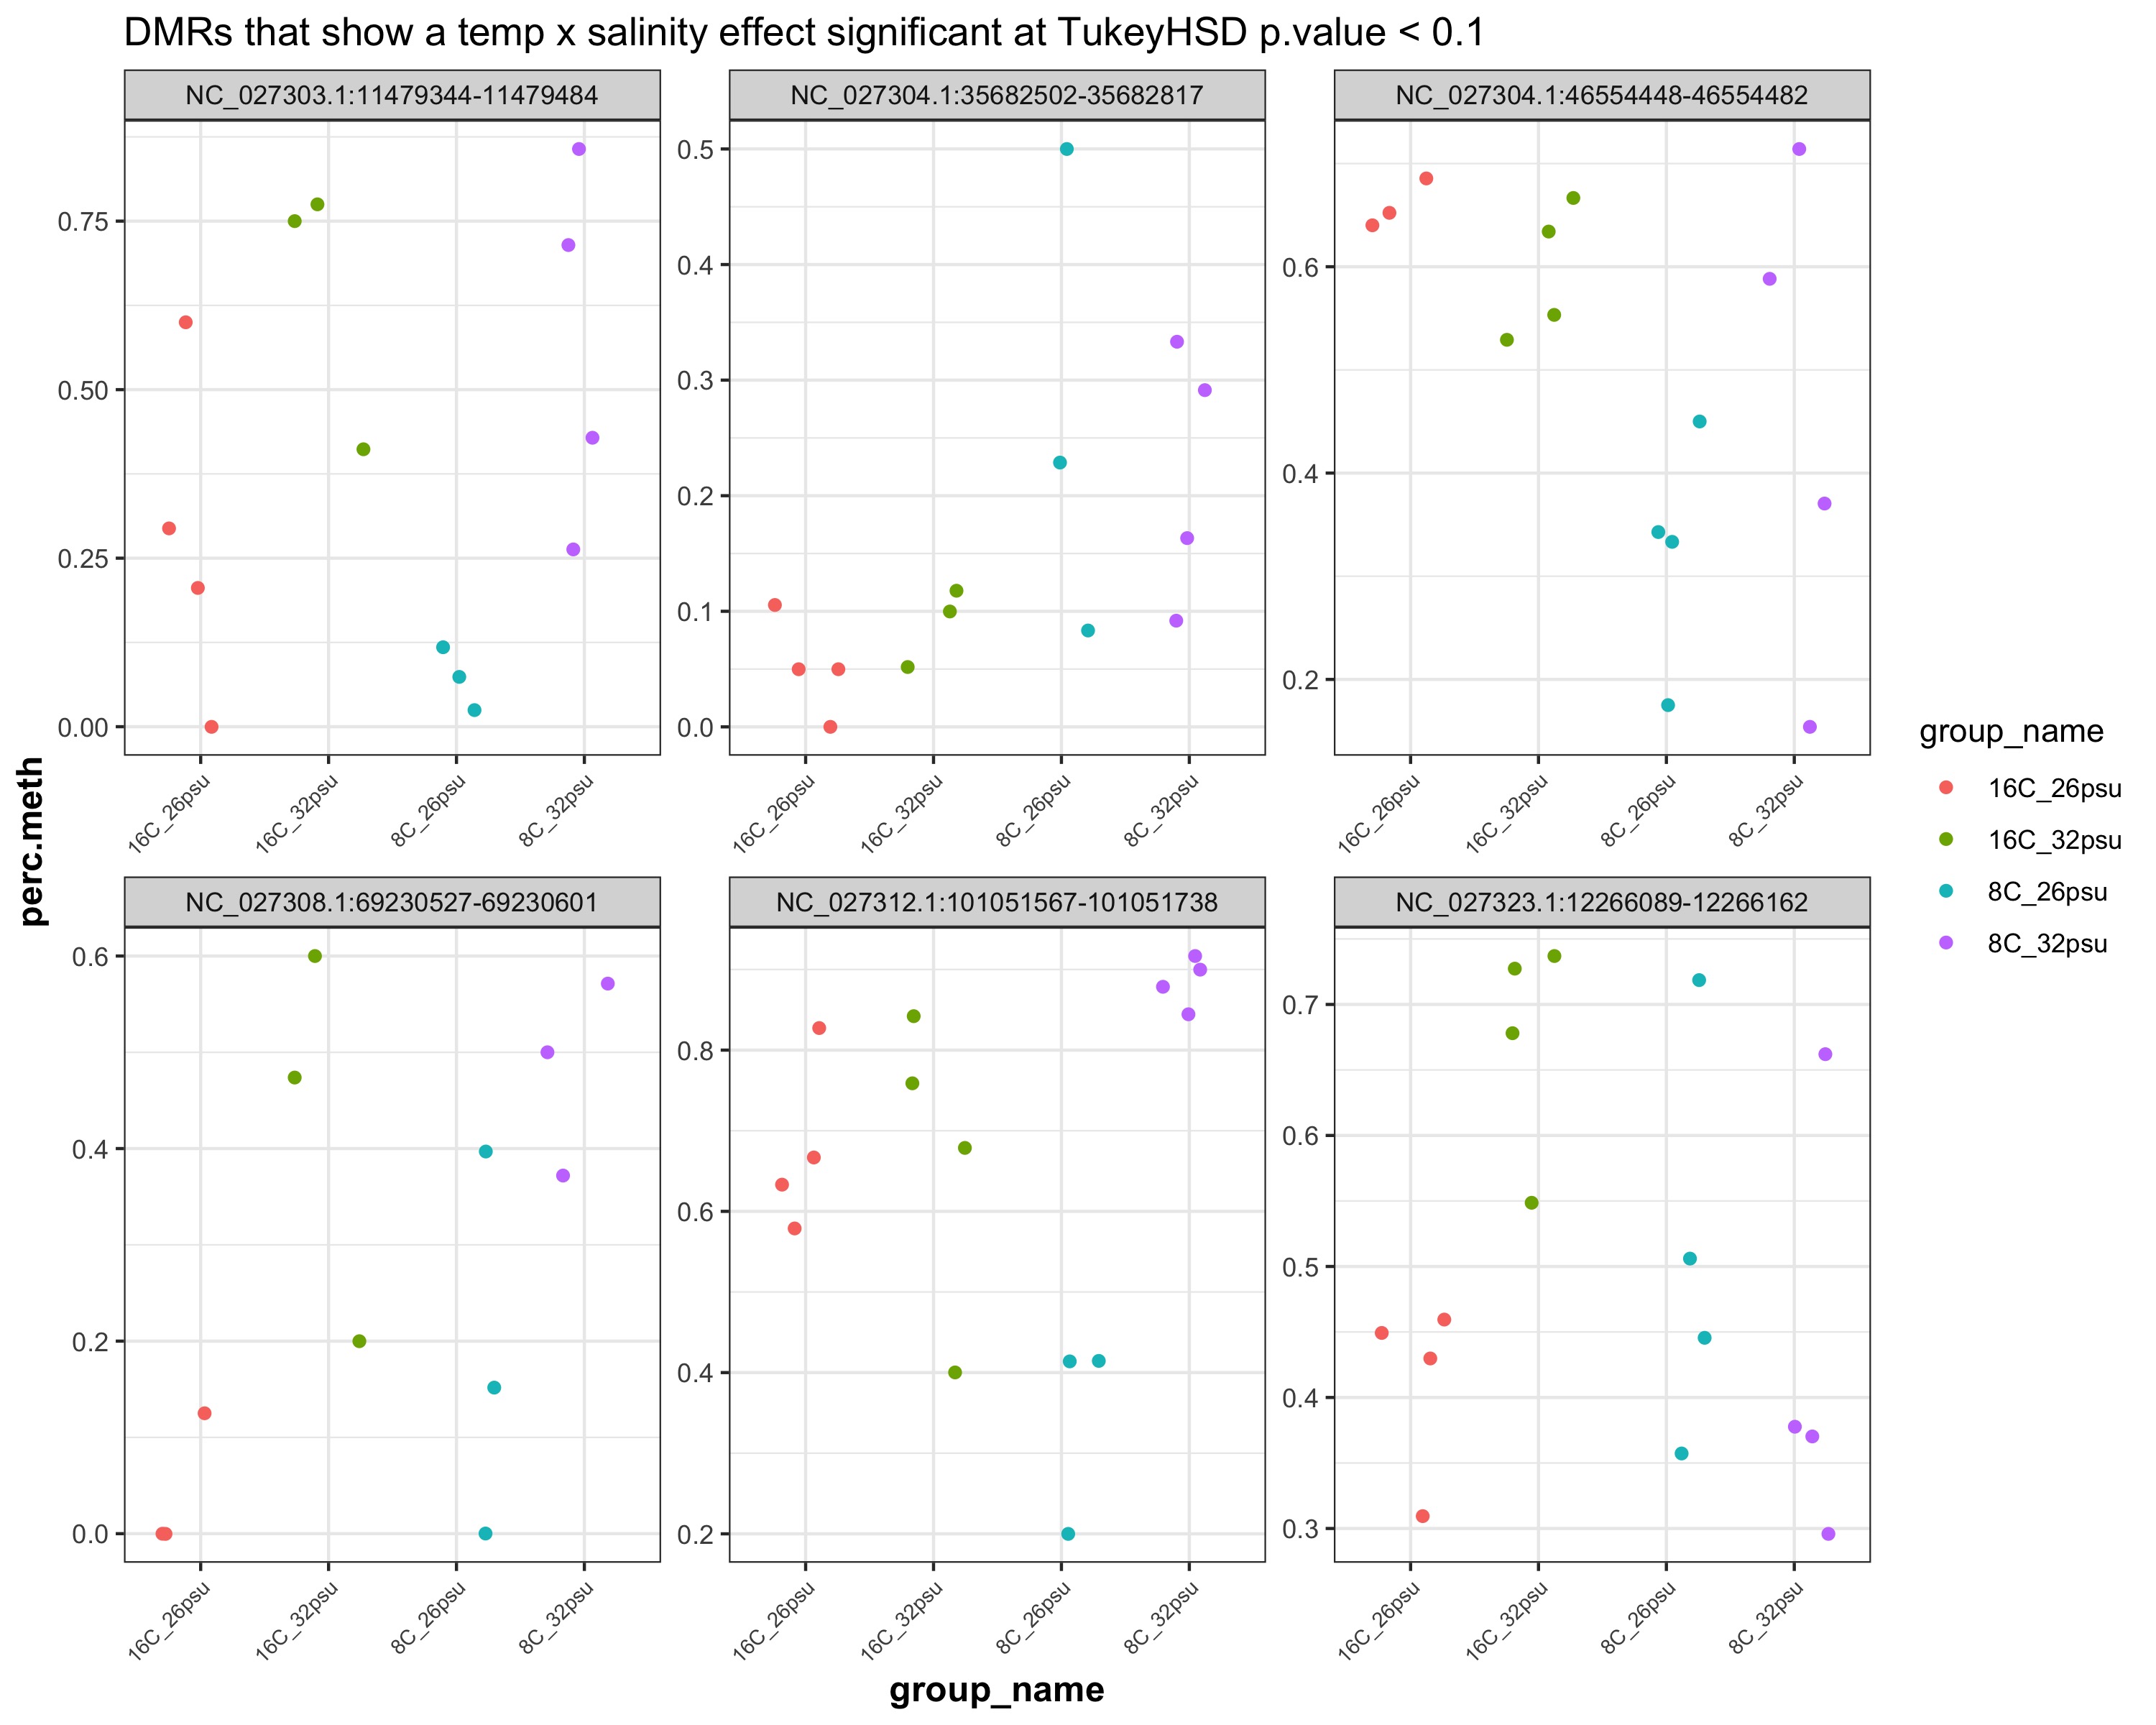
For the 24 DMRs that showed a significant infestation effect at 1way ANOVA p-value of < 0.1, I ran a two way ANOVA on their percent methylation to see if temperature, salinity, or their interaction showed a significant effect.