Summary of DMRs
- Within-sample DMRs were called (mox script here: 20191024_DMRfindAllEPI.sh; DMR output files here: https://gannet.fish.washington.edu/metacarcinus/Pgenerosa/analyses/20191024/, see files ending in _DMR250bp_MCmax30_cov5x_rms_results_collapsed.tsv) and the total number of DMRs called for each of the following comparisons were:
- All ambient samples over time: 249
- All day 10 samples: 182
- All day 135 samples: 109
- All day 145 samples: 213
- Filtered DMRs: Within-sample DMRs were filtered for those that show coverage in at least 3/4 individuals per experimental group (R script here: mcmax30_DMR_cov_in_0.75_SamplesPerCategory.R, Rproj here: DMR_cov_in_0.75_SamplesPerCategory.Rproj). After these steps the total number of DMRs that went into the ANOVA test for experimental group differences for each of the following comparisons were:
- All ambient samples over time: 82
- All day 10 samples: 99
- All day 135 samples: 42
- All day 145 samples: 26
- Significant DMRs After running group statistics (post here: https://shellywanamaker.github.io/209th-post/), the fraction of DMRs with an experimental group effect significant at a 1way ANOVA p.value of < 0.1 for each of the following comparisons were:
- 38/82
- 29/99
- 13/42
- 5/26
DMR Summary Table:
| comparison | num.exp.groups | num.within.sample.DMRs | num.DMRs.filtered.0.75X.indv.per.group | num.DMRs.AOV.sig.at0.1 | num.DMRs.AOV.sig.at0.05 | fraction.filtered.DMRs | fraction.total.DMR.sig.at0.1 | fraction.filtered.DMR.sig.at0.1 | fraction.total.DMR.sig.at0.05 | fraction.filtered.DMR.sig.at0.05 | |———————|—————-|————————|—————————————-|————————|————————-|————————|——————————|———————————|——————————-|———————————-| | all ambient samples | 4 | 249 | 82 | 38 | 33 | 0.33 | 0.15 | 0.46 | 0.13 | 0.40 | | all day 10 samples | 3 | 182 | 99 | 29 | 14 | 0.54 | 0.16 | 0.29 | 0.08 | 0.14 | | all day 135 samples | 3 | 109 | 42 | 13 | 9 | 0.39 | 0.12 | 0.31 | 0.08 | 0.21 | | all day 145 samples | 6 | 213 | 26 | 5 | 3 | 0.12 | 0.02 | 0.19 | 0.01 | 0.12 |
- no DMR was significant at FDR corrected p.value < 0.05
- 5 DMRs from all-ambient samples and 1 DMR from Day 10 samples were significant at FDR corrected p.value of < 0.1
Feature analysis including non-significant DMRs
My previous post looked into the number of different genomic features that significant DMRs overlap with. This analysis looks at the number of different genomic features that all DMRs (significant + non-significant) overlap with and compares to that of significant DMRs.
-
I matched filtered DMRs to the most recent GFF Panopea-generosa-vv0.74.a4-merged-2019-10-07-4-46-46.gff3 using this jupyter notebook: 20191106_functional_analysis.ipynb and created files with genome feature annotations in this directory: 20191106_anno
-
I added on the Rmarkdown script I previously started 20191102_anno.Rmd to plot the filtered DMRs (“All DMRs”, left side) next to the ANOVA significant DMRs (“significant DMRs”, right side). Each sample comparison (all ambient samples, day10 samples, day135 samples, and day145 samples) is plotted row-wise.
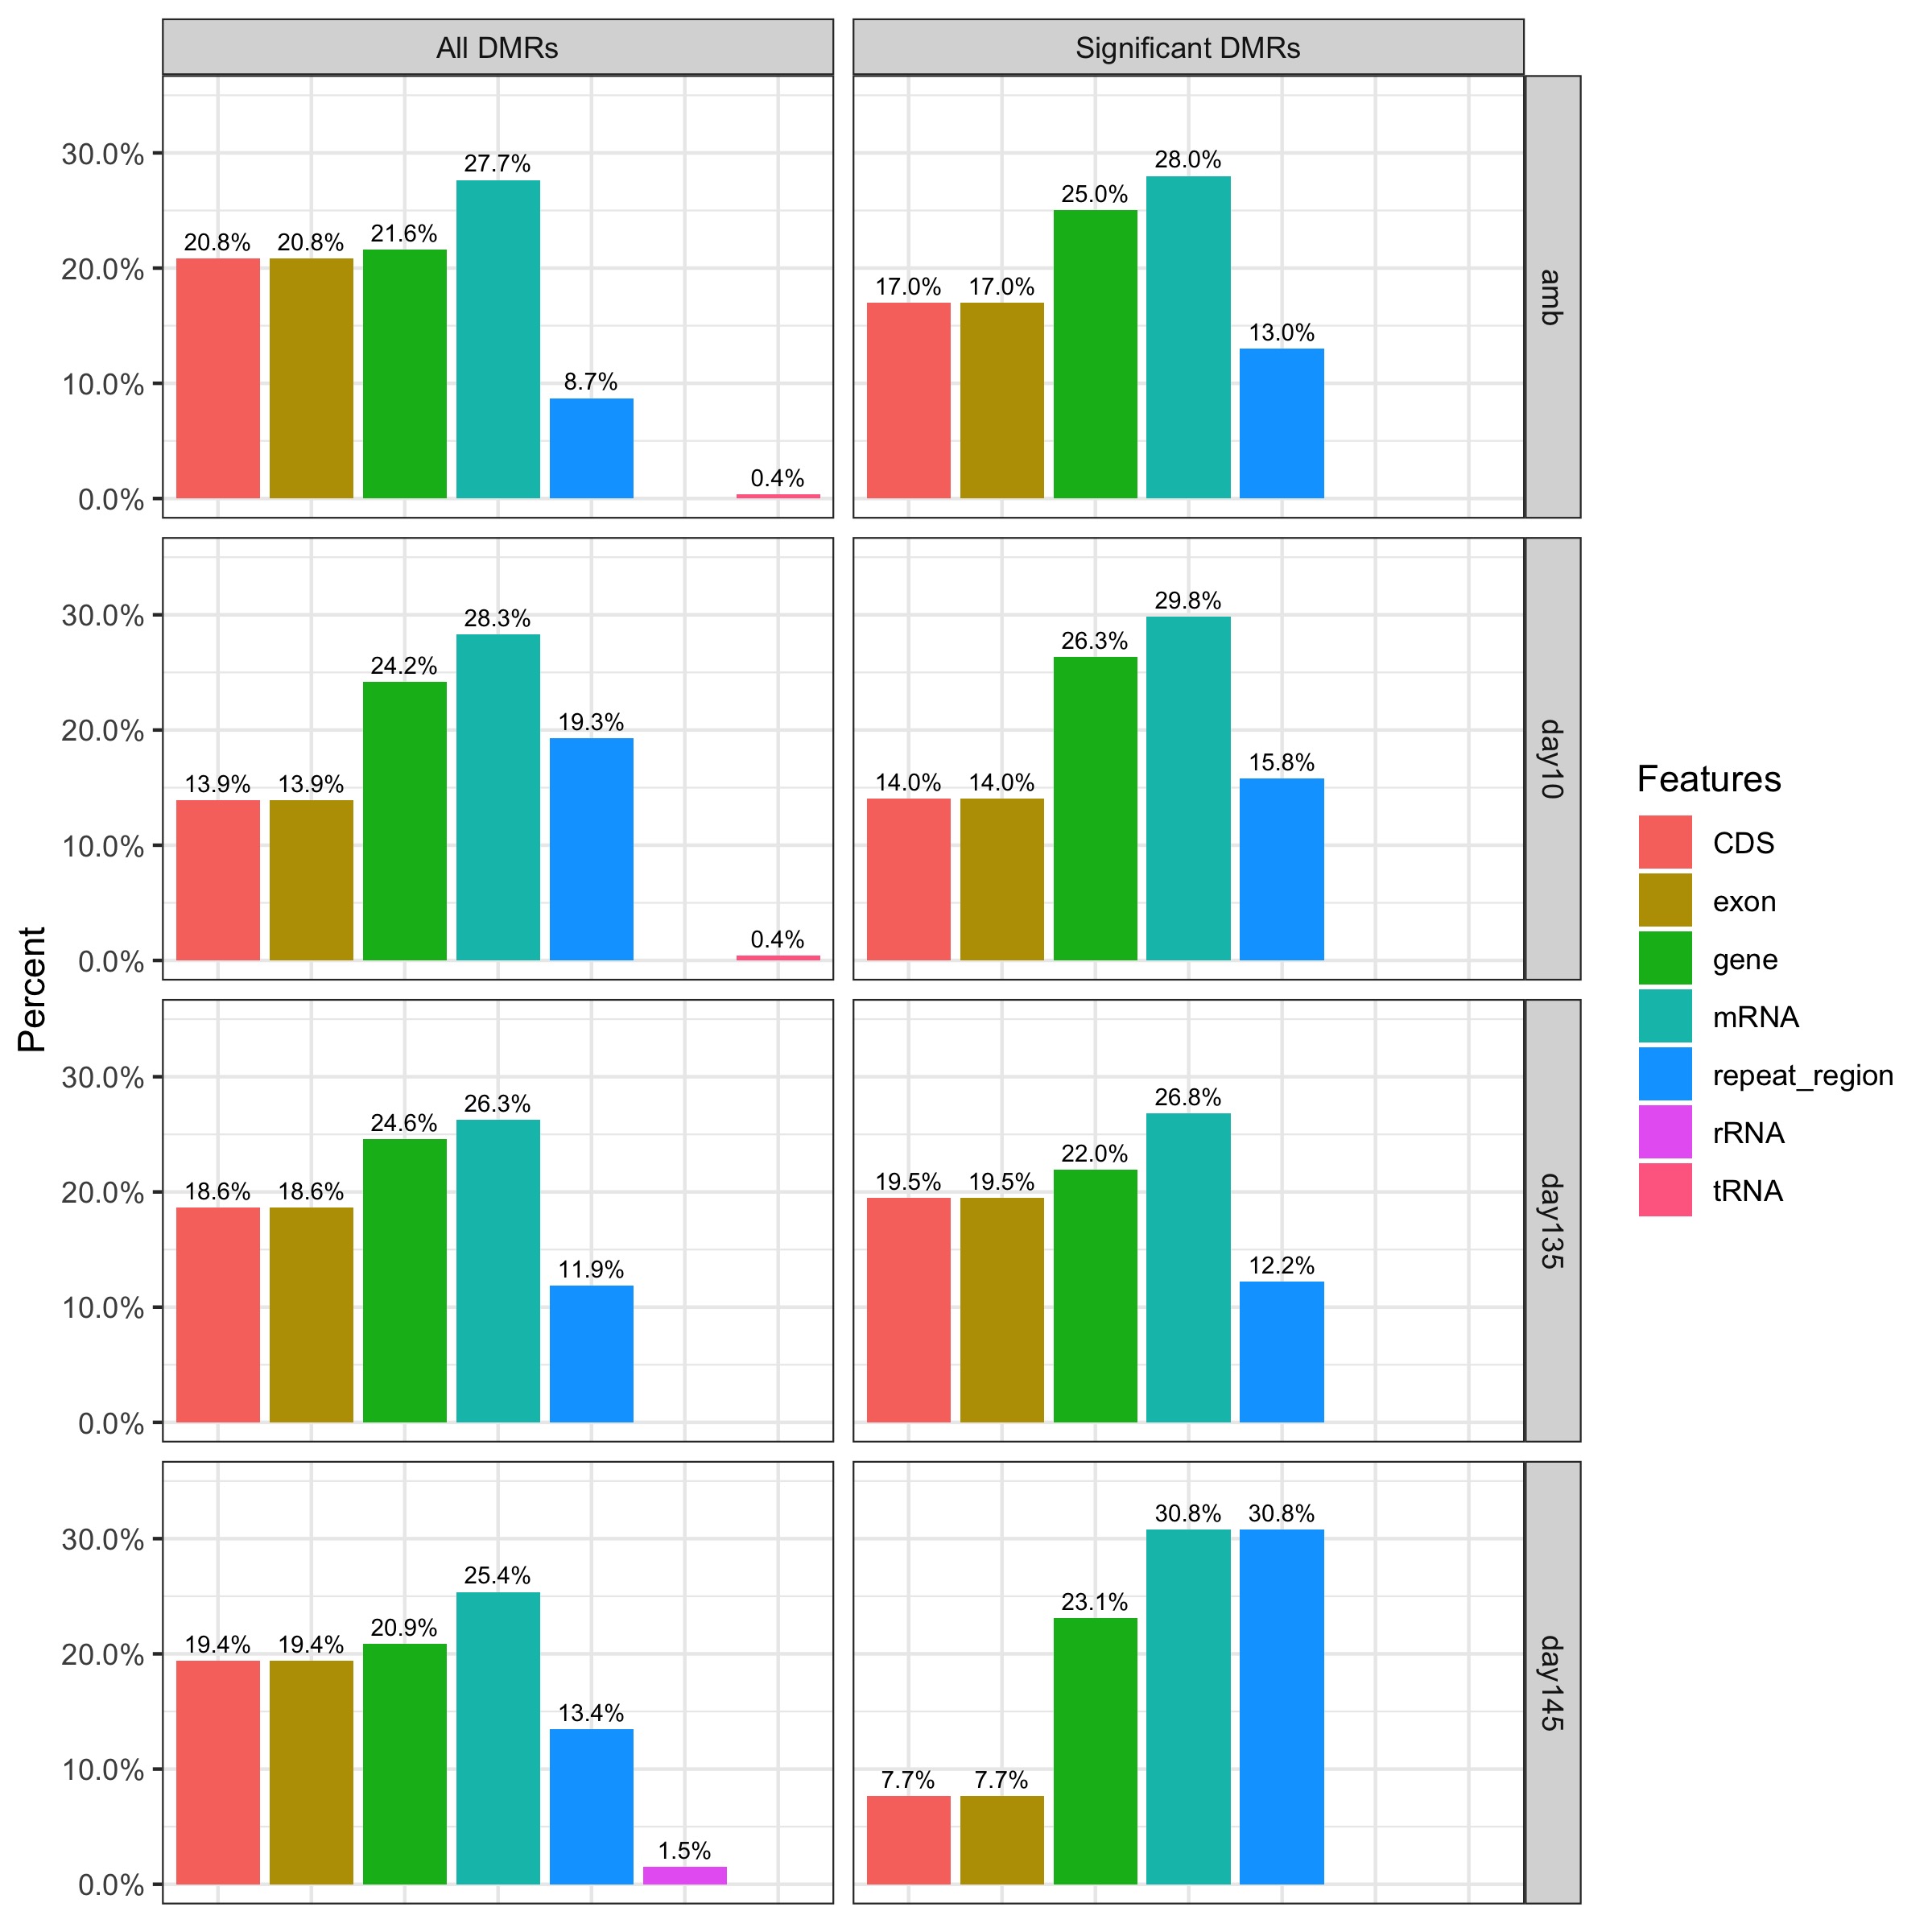
- There are no obvious differences between significant DMRs and all DMRs in the proportion of features they overlap with, except for the Day145 comparison where CDS and exon features are under-represented, and mRNA and repeat_region are over-represented.
Next steps
- Look deeper into repeat regions (there are ~6 different catagories, so can see if any are particularly different)
- For DMRs no in features, check the nearest features
- Compare genes with DMRs to the ones identified by Hollie’s method
- Continue GO analysis
- generate appropriate GO background to use for each comparison
- run TopGO
- Go through manuscript methods section
- update new stuff
- add comments to areas of concern