This post is in reference to the histology done on the Fall-Winter 2018-2019 Broodstock conditioned in constant low pH. This is data analysis for the manuscript on pH effect on reproductive development
Methods: Scoring females with imageJ
- Open image2 (fiji)
- Open one image
- use the line tool to trace the scale bar in the image; zoom in to be precise
- Under Analyze, select set scale and enter 100 under known length and micrometer under unit. Select global option so that the scale is applied to all images. Then click ok
- Close the image used to set the scale
- Crop images to remove underexposed corners in preview
- Open cropped images in imageJ
- The following are the steps taken for analyzing each photo
- Select measure under the analyze menu
- this will measure the area of the entire image
- Under the image menu, select adjust -> brightness/contrast and click auto
- Record min and max display settings
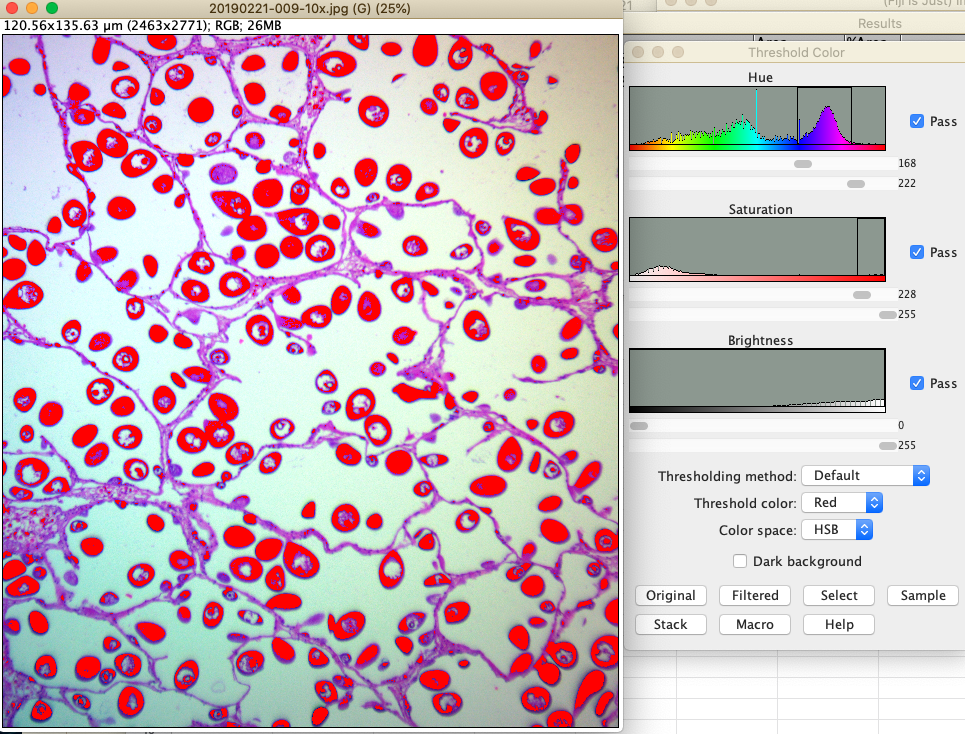
- Under the image menu, select adjust -> color threshold
- Adjust hue, brightness, and saturation min and max thresholds to highlight all eggs while reducing the amount of non-egg tissue highlighted. Once the optimal thresholds are found, click select. Then go to the analyze menu and click measure. This will record the area taken up by egg tissue. Take a screenshot with the optimal threshold settings
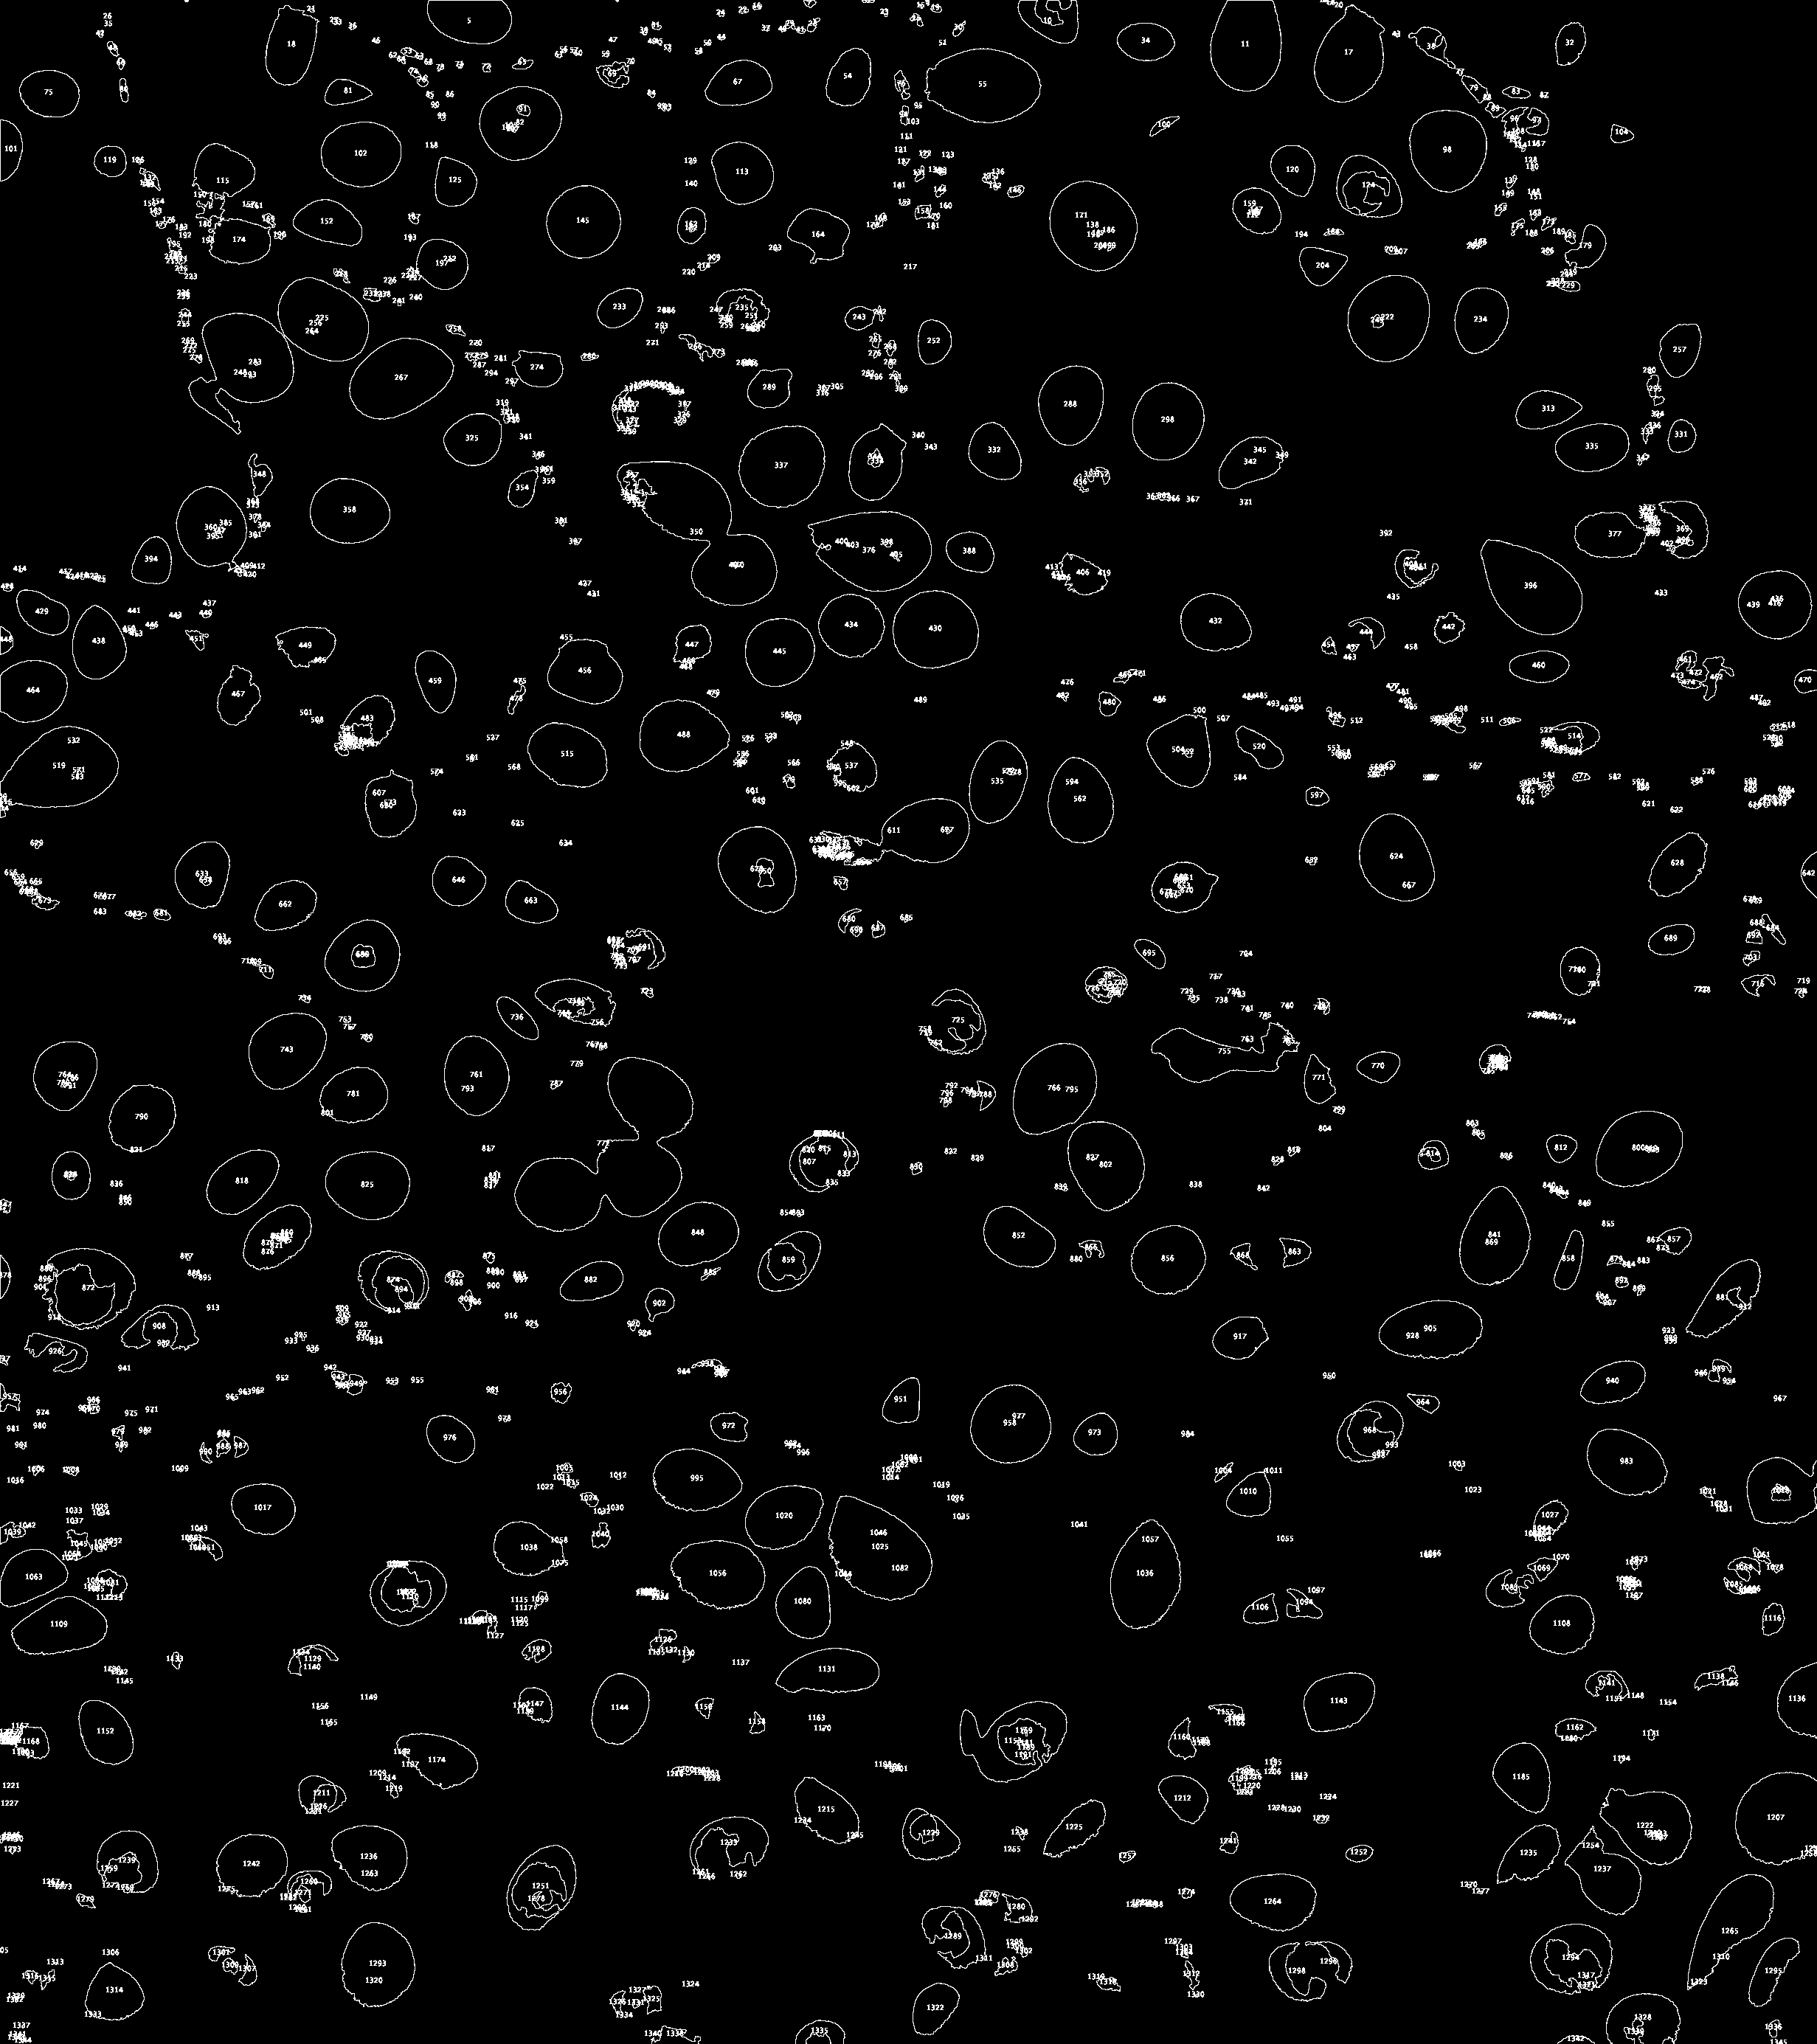
- Next, go to the analyze menu and click analyze particles. Select outlines under the show dropdown menu, select display results and in situ show, then click ok
- To save the image with measured eggs highlighted and numbered, go to file -> save as -> tiff
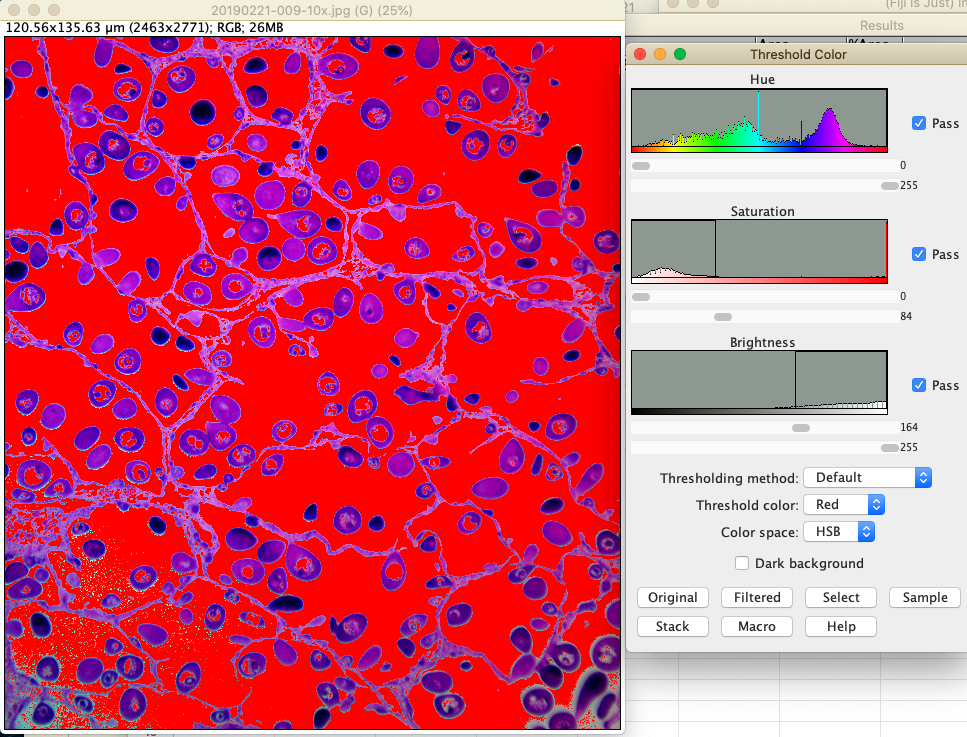
- To measure non-tissue area, adjust the color thresholds again, this time optimizing for highlighting everything that is not tissue. Then go to the analyze menu and click measure. This will record the area that does not contain tissue. Take a screenshot when optimal thresholds are set.
- Finally, save the measurements table as a txt file.
- Select measure under the analyze menu
Results
- original images are here:
- cropped images are here:
- egg measurements, screenshots, and results tables are in individual directories for each sample here:
- propagated this googlesheet with imageJ settings and measurements:
Examples of measurements:
- original image
- cropped image

- egg area
- egg measurements
- For measurements from each image, I excluded all eggs < 0.9 um because these particles appeared to be mostly cells and not eggs. In scanning through the image, I would find the smallest egg which was typically around 1um. I could increase the threshold to 1um. I did not include an upper threshold limit here, which maybe I should have.
- area with no tissue
Metrics
- proportion egg area (based on total selection)
- proportion egg area (based on particle selection and thresholding)
- number of eggs
- mean egg size
- proportion area without tissue (proxy for follicle area)
- connective tissue = total area - egg area - area with no tissue
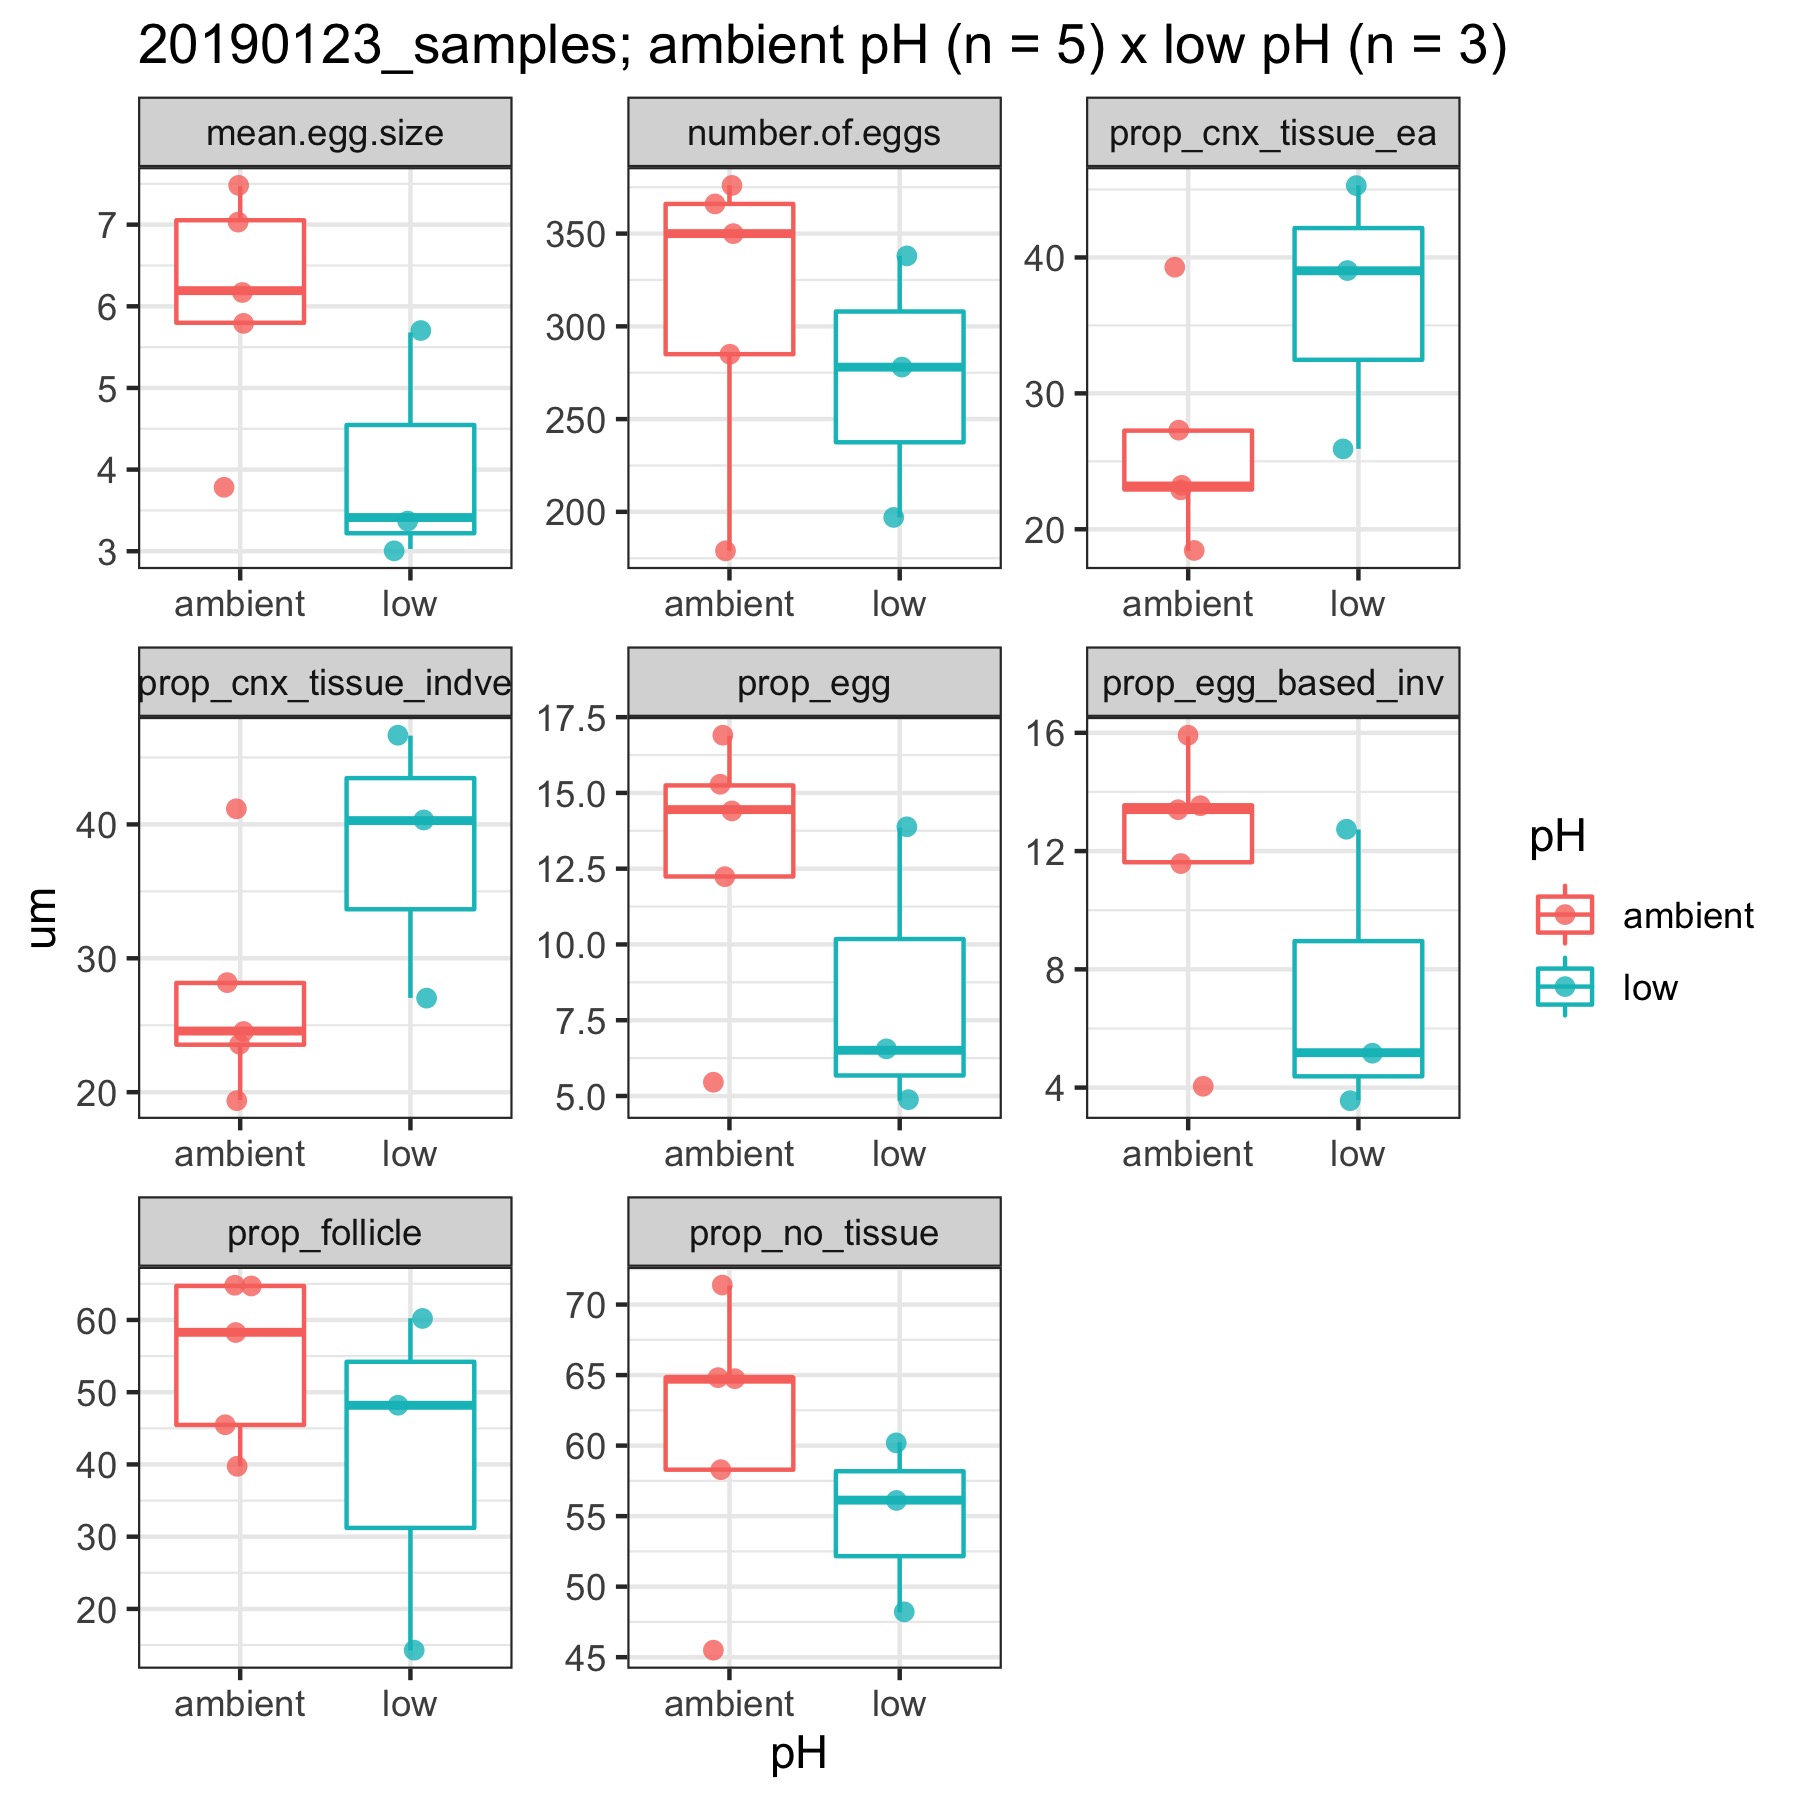
plots
Jan 23 samples:
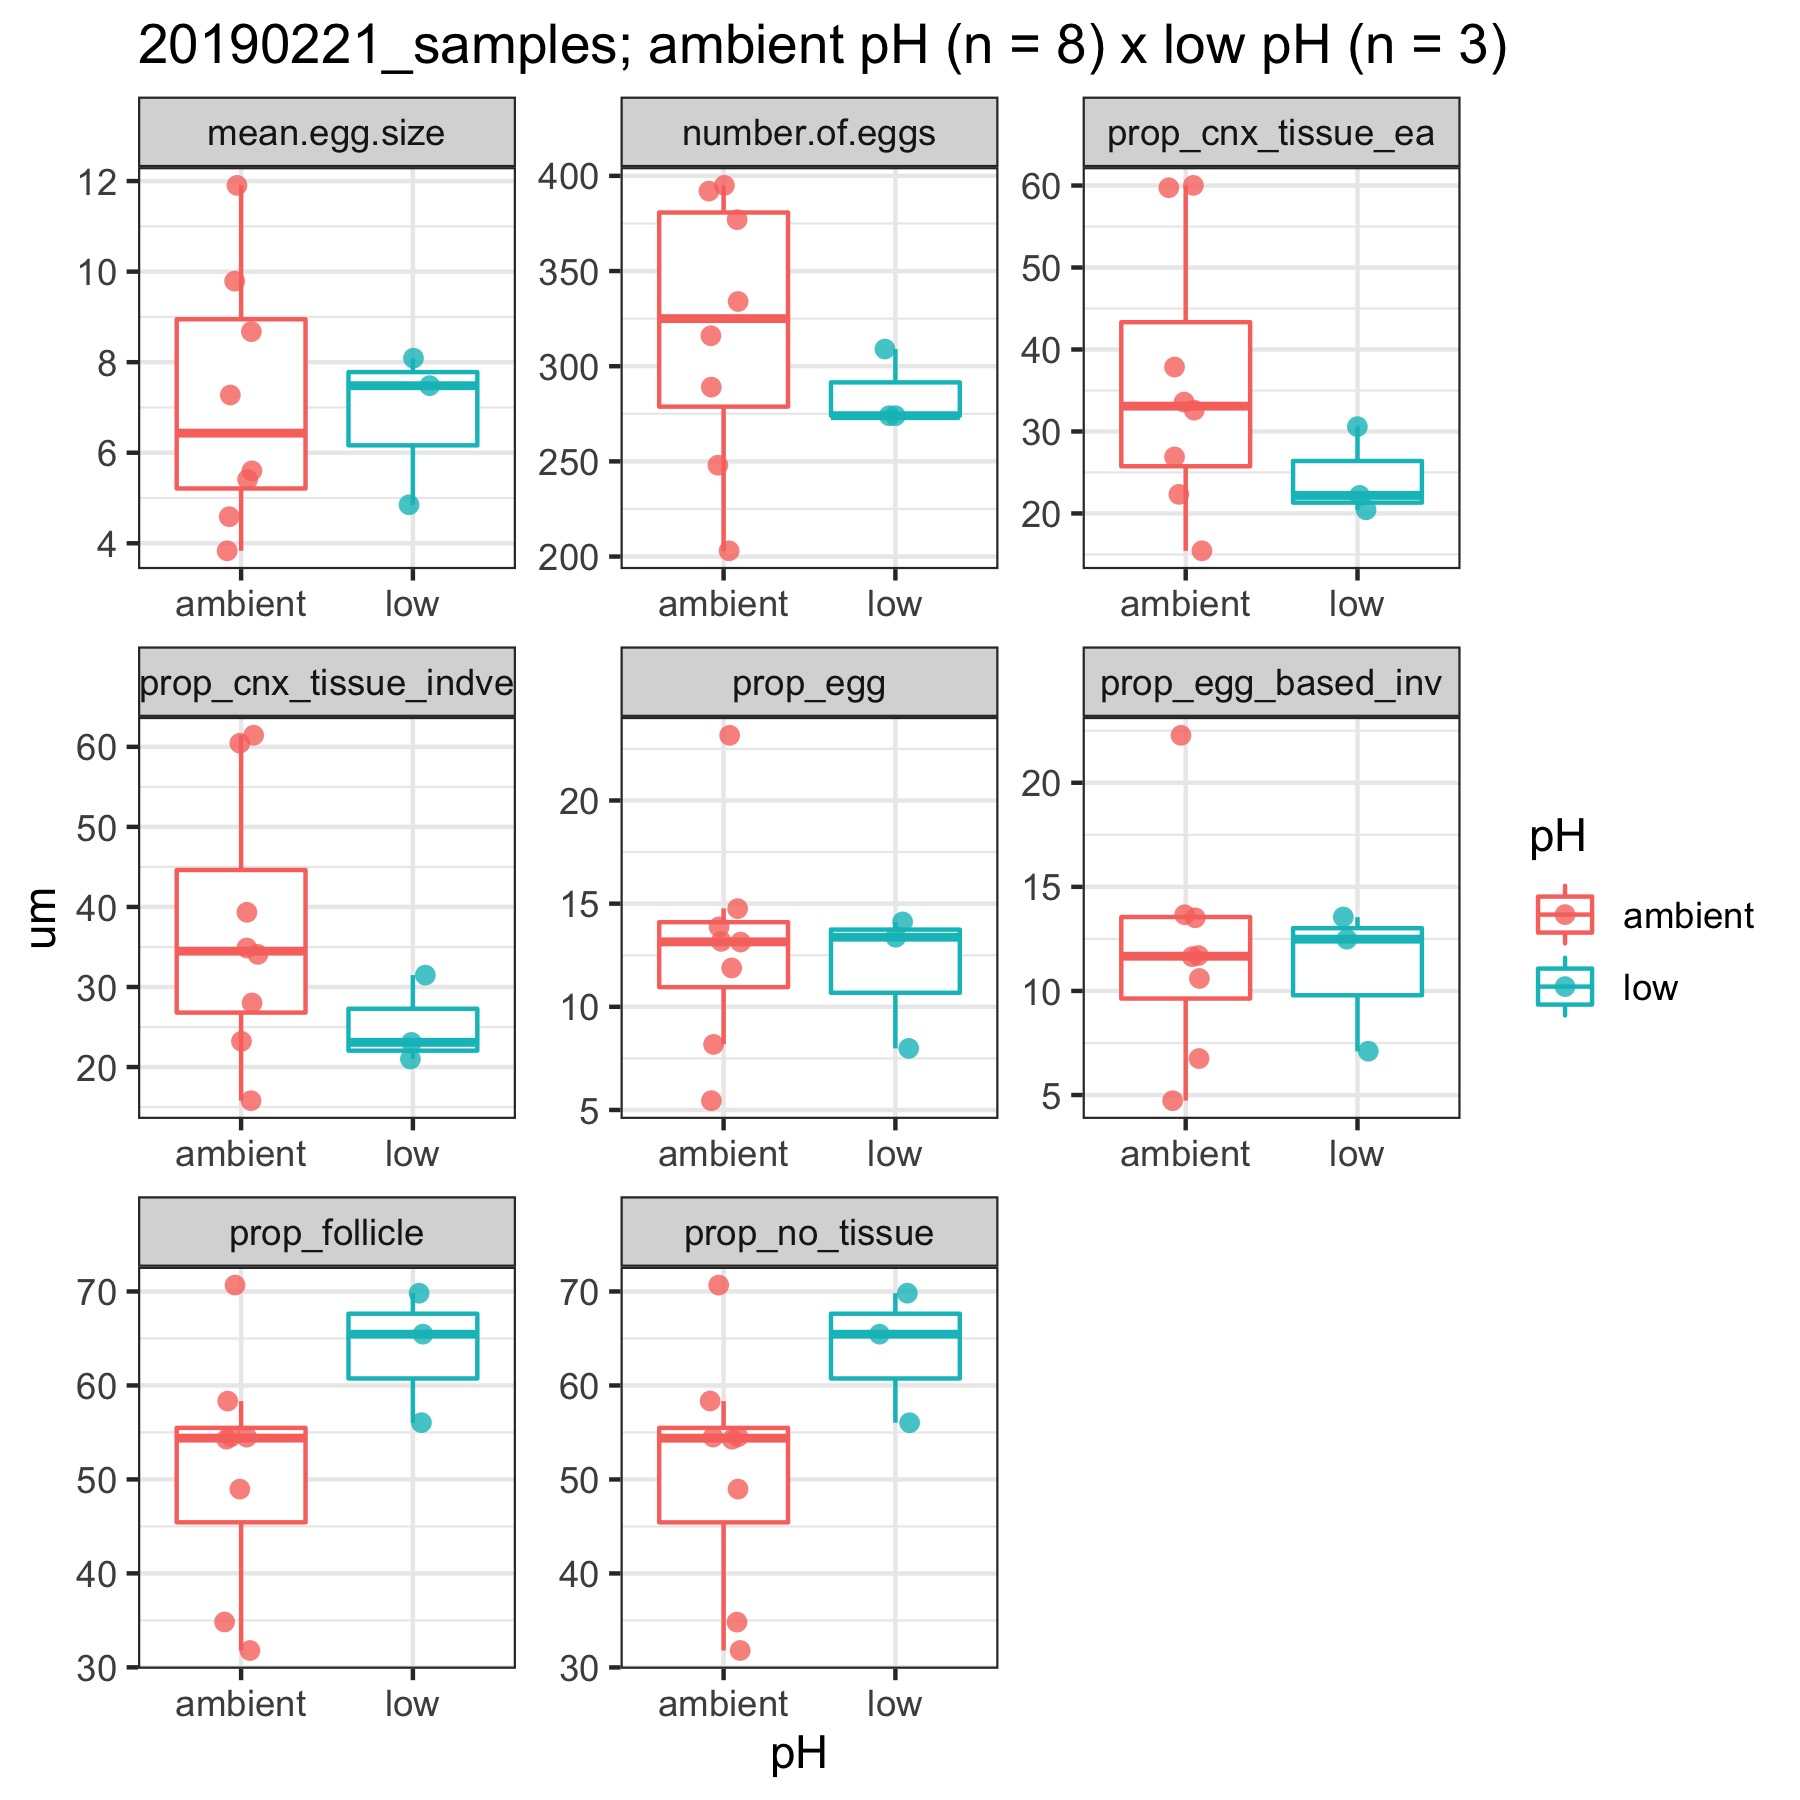
Feb 21 samples:
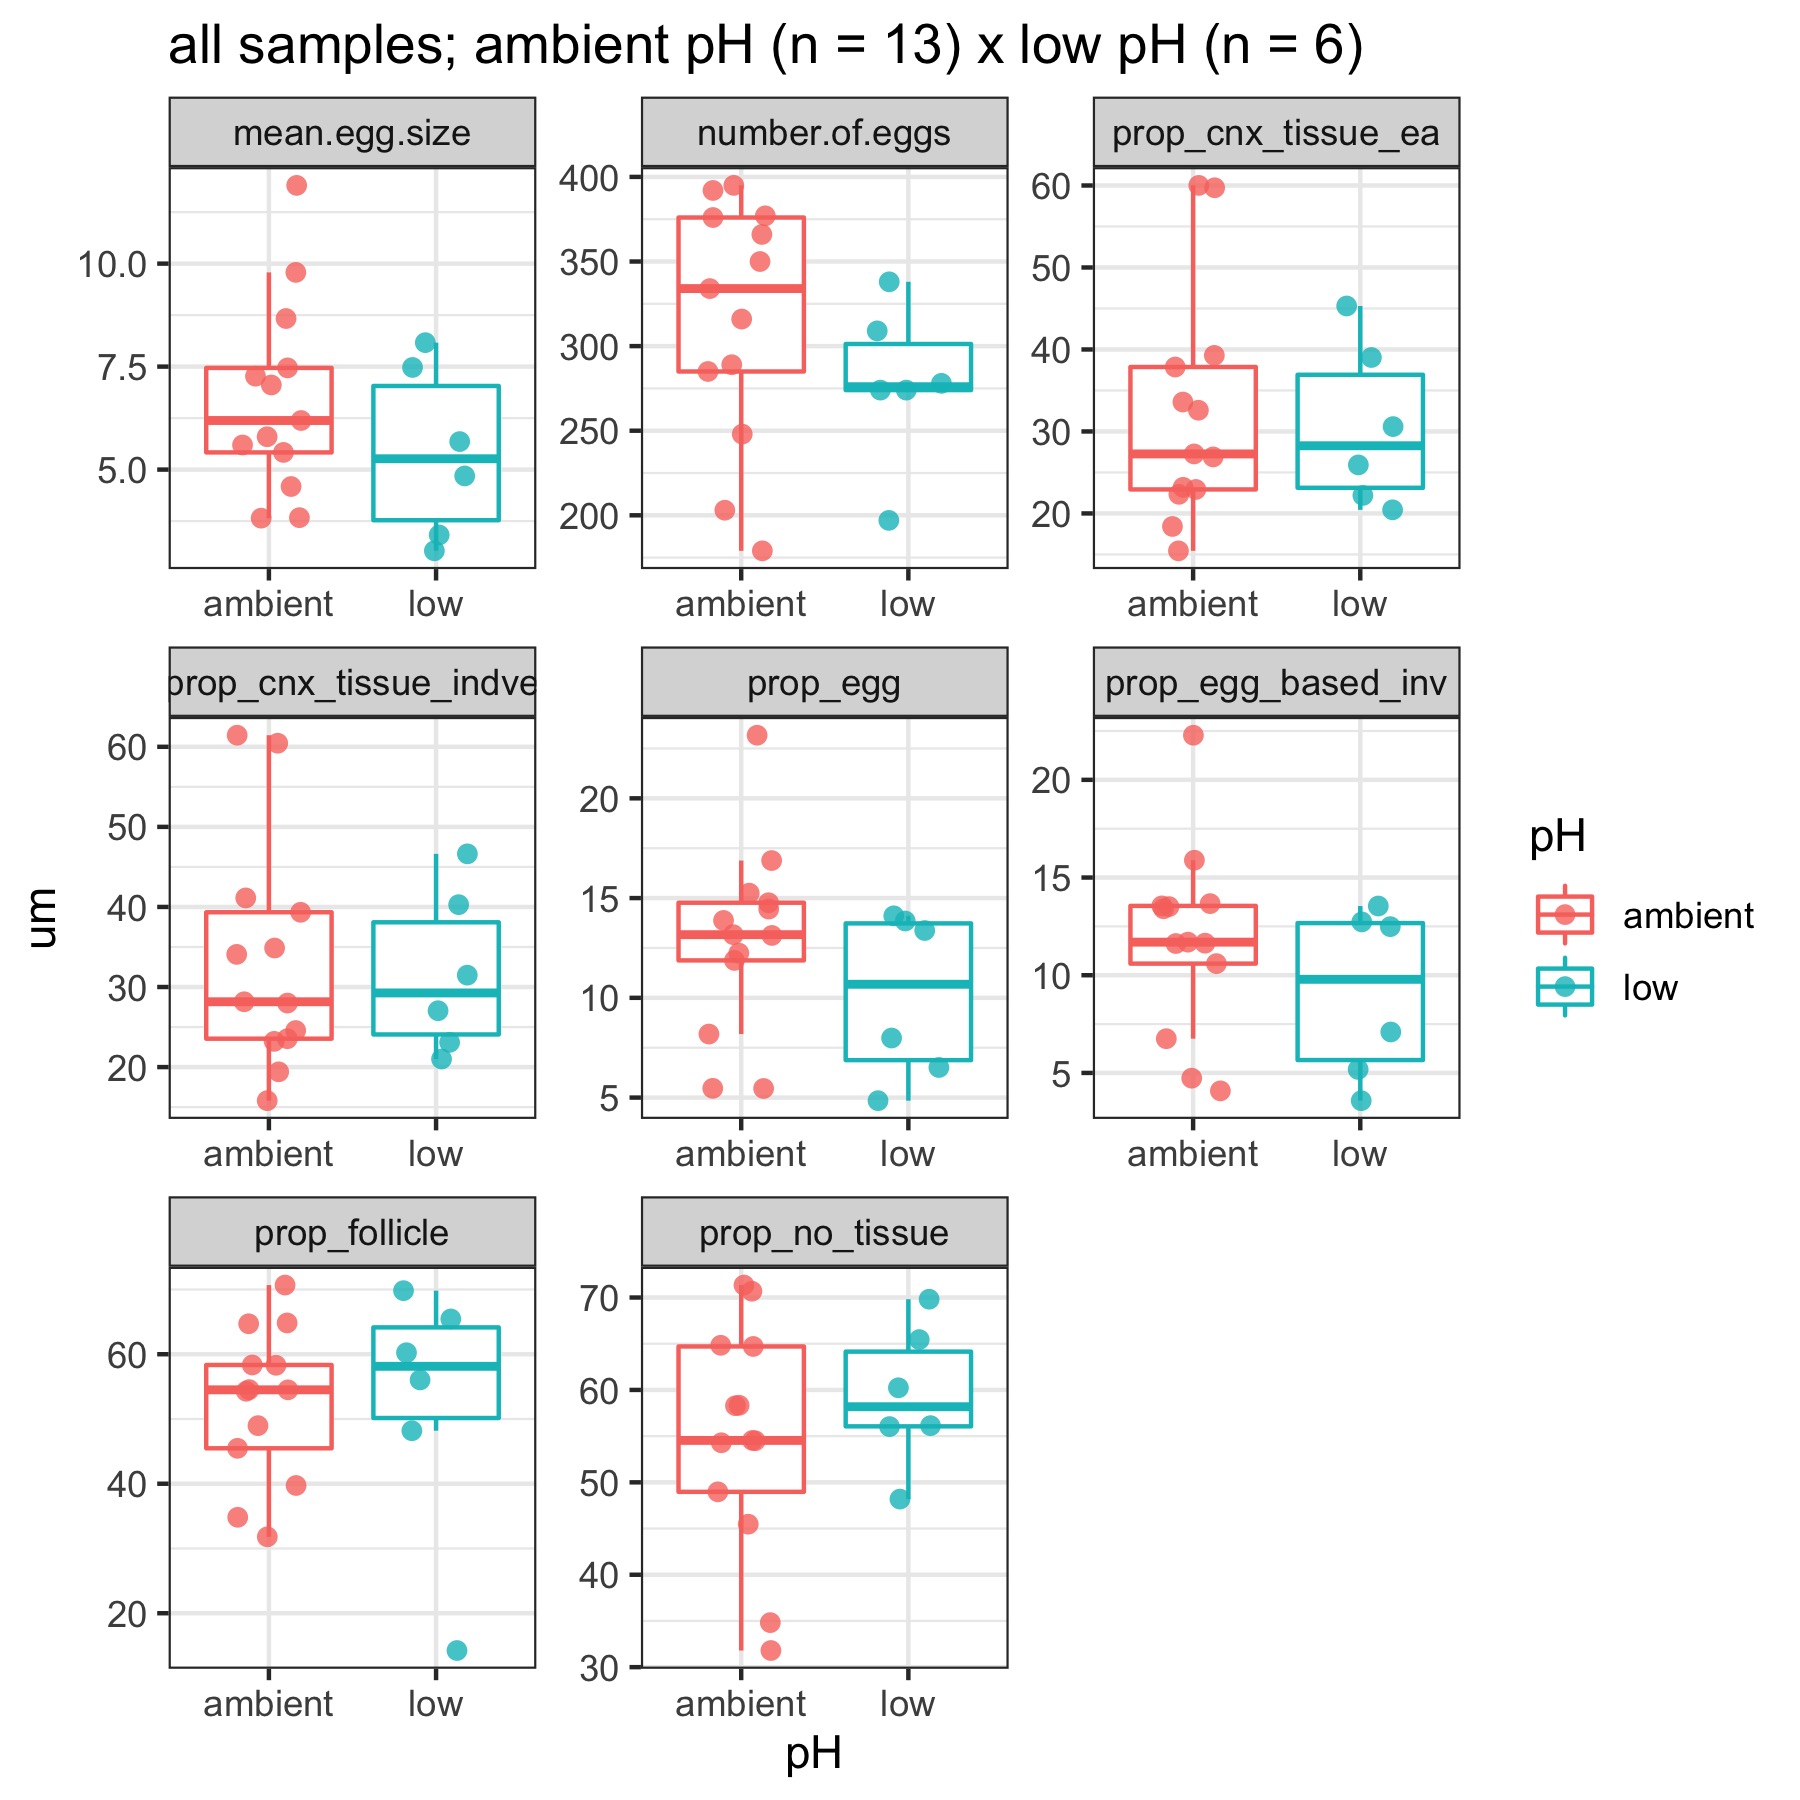
All samples combined:
Next steps
- Decide on best metrics
- Decide on stats