Gathering genomic feature data
I intially downloaded the genome gff from NCBI here: ftp://ftp.ncbi.nlm.nih.gov/genomes/Salmo_salar/GFF/ref_ICSASG_v2_top_level.gff3.gz
I created a putative promoter and 3’ UTR track using this jupyter notebook:
- CreatePromoterTrackAnd250bpBinTrack.ipynb
- putative promoter gff is here: ref_ICSASG_v2_top_level.Gene3primerUTR.gff
- putative 3’ UTR gff is here: ref_ICSASG_v2_top_level.GenePromoter.gff
- genome gff is here: ref_ICSASG_v2_top_level.gff3.gz
Overlap with DMRs
I used this jupyter notebook to identify DMRs overlapping with genomic regions and binned genomic regions:
- 20200825_GenomicFeatureAnalysis.ipynb
- overlapping DMRs: DMR_features.txt
- background CpGs: 3xCpG.allgrps.bed
- background features: 3x3CpG.allgrps_all_features.txt
- DMRs overlapping with binned features: DMR_all_features_30bp.txt
- background binned features: 3x3CpG.allgrps_all_features_30bp.txt
Rationale behind background feature analysis:
- DMRs are found by the following steps:
- CpG loci are first identified as being significantly differentially methylated than what would be expected from genetic variation alone. This is estimated by running root mean square permutations of the data where a loci from one library is compared to that same loci in all other libraries.
- CpG loci that are significantly different than expected from genetic variation are then collapsed into DMRs which must contain at least 3 DMS within a <= 250bp region.
- DMRs are then overlapped with features
- Background regions are found by the following steps:
- All 5x loci are filtered for those covered by at least 3/4 libraries within a treatment group
- Then loci are filtered for those commonly covered by all treatment groups
- Two ways have been attempted for collapsing into regions
- overlap loci with features and filter for features containing at least loci
- this results in features of any size with at least 3 loci, which is a little unfair since DMRs were restricted to <= 250bp.
- bin features into the average size of the DMR (30bp in this case), overlap loci with binned features, and filter for features containing at least 3 loci
- overlap loci with features and filter for features containing at least loci
The reason for looking at binned genomic features was to identify background regions in a similar way the DMRs are identified. In this case, the average DMR length is 30bp. So I binned genomic features to 30bp and looked for overlapping DMRs. For background CpGs, I required 30bp binned features to contain at least 3 background CpGs in order to be considered a background feature.
Plot features and run stats
I plotted feature proportions with this R markdown file:
Stacked bar plots of binned genomics features that significant DMRs overlap with
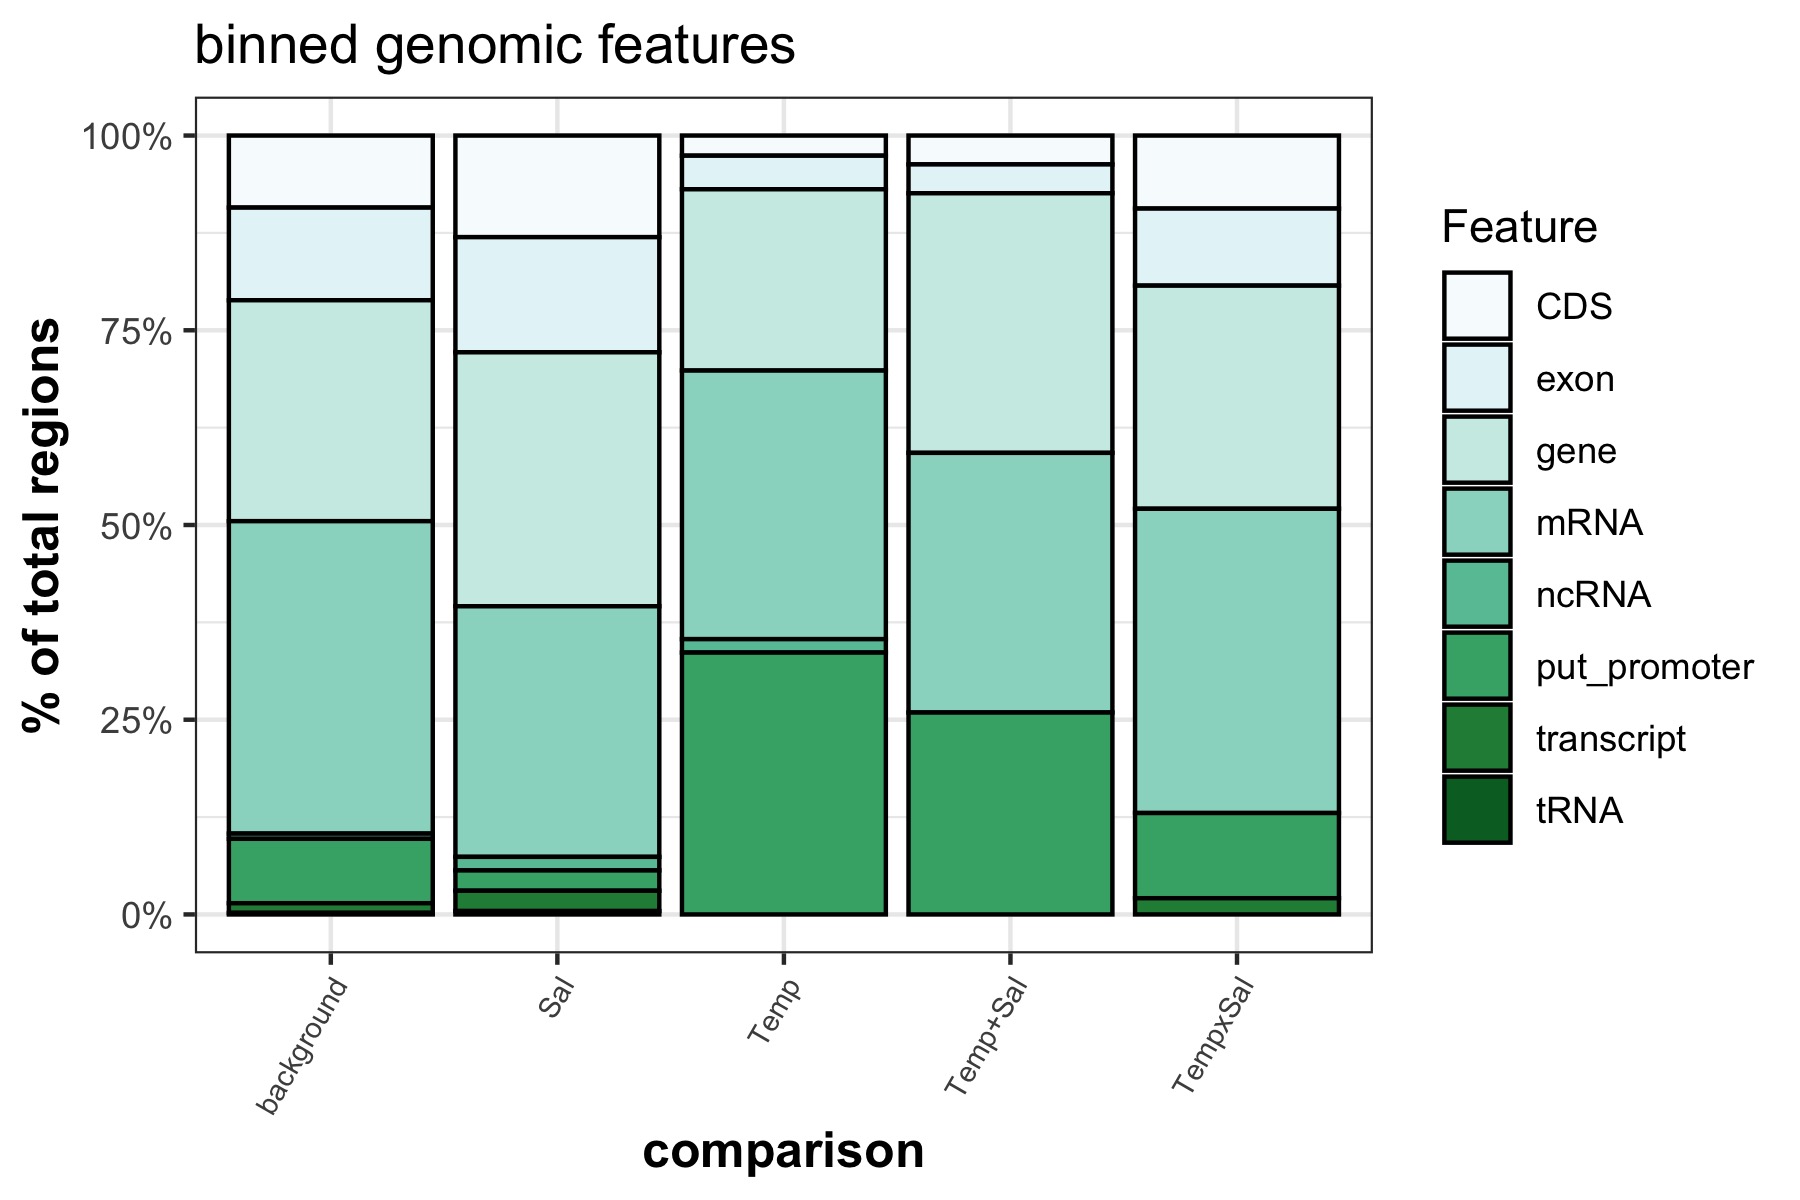
I used a chi square test of proportions to see if specific genomic features that DMRs overlap with are significantly different from the background features.
Chi sq results table: chi_sq_bin_feats.csv
The only significantly different feature proportion is the putative promoter for salinity effect DMRs, Temperature effect DMRs, and the additive Temperature + Salinity effect DMRs.
I also overlapped DMRs and background CpGs with genomic features that were not binned for comparison
Stacked bar plots of genomics features (not binned) that significant DMRs overlap with

I did not run stats on these regions
Conclusions
- putative promoter regions seem to be more susceptible to methylation changes than other genomic features
- this is in line with other vertebrates in that DNA methylation changes in the promoter region are associated with changes in gene expression
Next steps
- optimize feature analysis
- use updated gff ftp://ftp.ncbi.nlm.nih.gov/genomes/all/annotation_releases/8030/100/GCF_000233375.1_ICSASG_v2/GCF_000233375.1_ICSASG_v2_genomic.gff.gz
- add TE annoations
- Received RepeatMasker output and associated TE annotations for the S. salar genome in the 2016 Nature paper The Atlantic salmon genome provides insights into rediploidization from Eric Rondeau.
- I created a TE gff using this jupyter notebook: 20200831_generate_TE_track.ipynb
- input data here:
- output data here:
- ssal_repeats_v5.1.TEannotations.gff
- version without unplaced sequences: ssal_repeats_v5.1.TEannotations.noNW.gff
- add intron annotations
- need to determine which feature files to use to generate these (e.g. subtractBed with mRNA and exons). Will visualize in IGV first.
- improve identification of background features
- currently I am using the average size DMR to identify background features from background loci. It seems like it might be better to call regions from loci using a sliding window algorithm and then overlap background regions with features (more similarly to how DMRs are called). However, I’m not sure how to do this yet.
- QC DMRs: confirm DMR calls make sense in IGV
- See if there is differential expression of promoter genes
- Perform integrative omics model of methylation and expression data