This post is the analysis of the data collected from the full calcium assay run: https://shellywanamaker.github.io/390th-post/
Assay analysis
I compiled the plate reader data into one file here: https://github.com/shellywanamaker/P_generosa/blob/master/Hemolymph_Calcium_Assay/data/20201125/CompiledData.xlsx
R script here: https://github.com/shellywanamaker/P_generosa/blob/master/Hemolymph_Calcium_Assay/analysis/analysis.Rmd
Rmd knitted output including stats: https://github.com/shellywanamaker/P_generosa/blob/master/Hemolymph_Calcium_Assay/analysis/analysis.md
Figs
-
Standard curves for each plate:
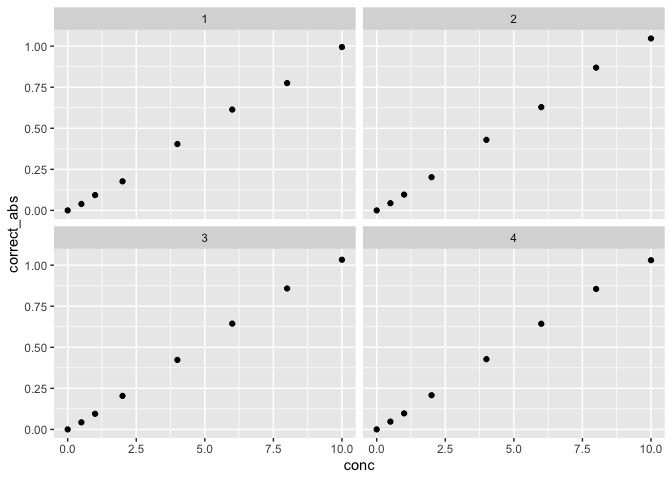
-
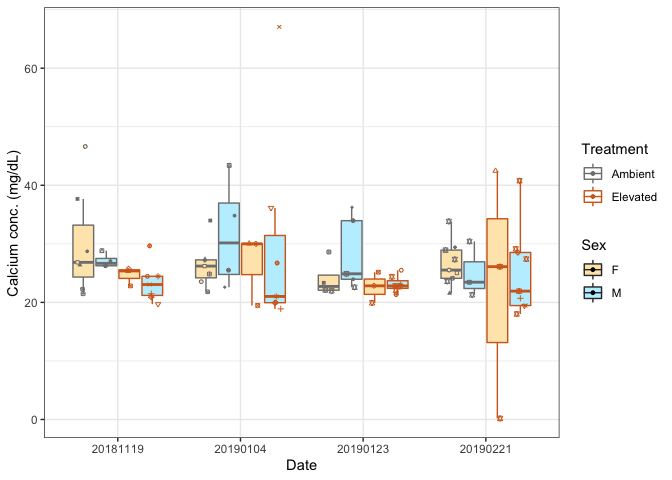
calcium levels of each sample:
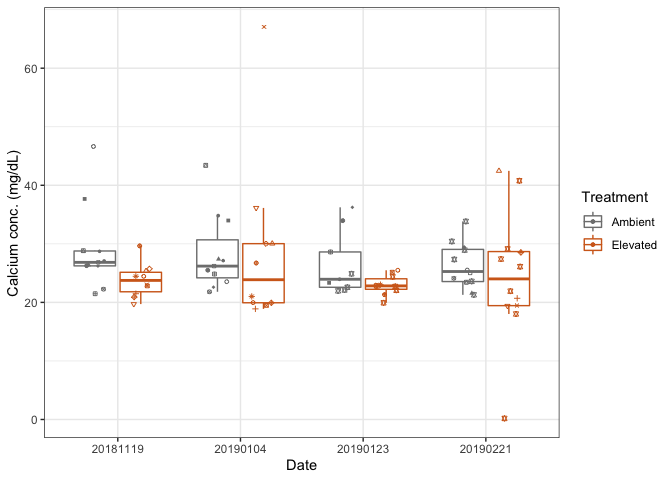
-
calcium levels of each sample separated by sex: