This entry is in reference to ASCA_avgNSAFvals_AllProteins.md; R markdown file here.
After lab meeting today, we decided the PCA plot generally shows the techinical replicates cluster together more than biological samples do, so technical replicate NSAF values can be averaged (or summed) for all proteins. And we don’t need to filter any proteins out.
I decided to stick with averaging technical replicate NSAF values after doing a quick analysis to confirm there is no difference between averaging or summing the values here on these files silo3and9_nozerovals_AVGs.csv and silo3and9_nozerovals_SUMs.csv (generated in these R projects ASCA_all_proteins_avgADJNSAF.Rproj and ASCA_all_proteins_sumADJNSAF.Rproj).
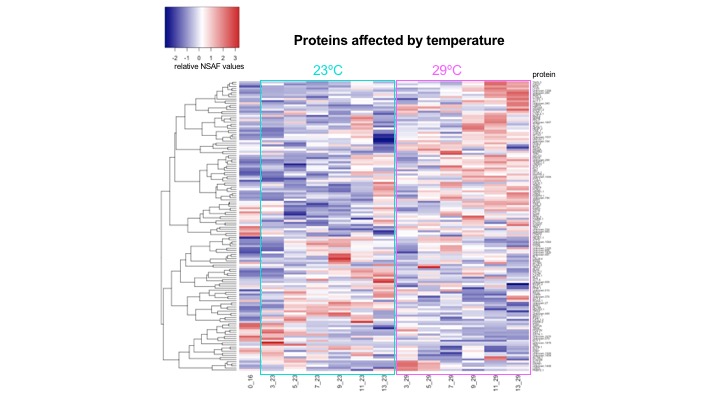
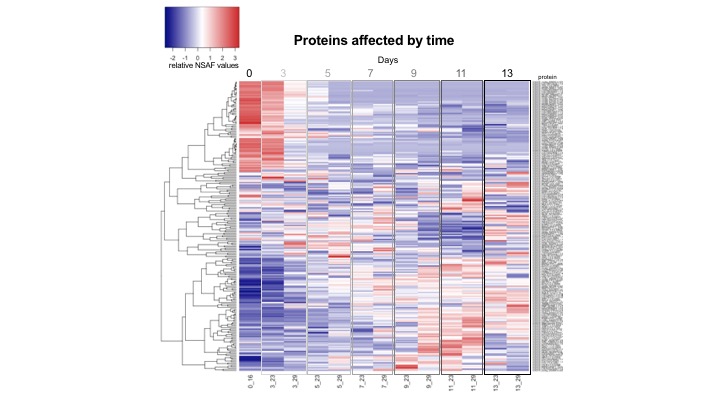
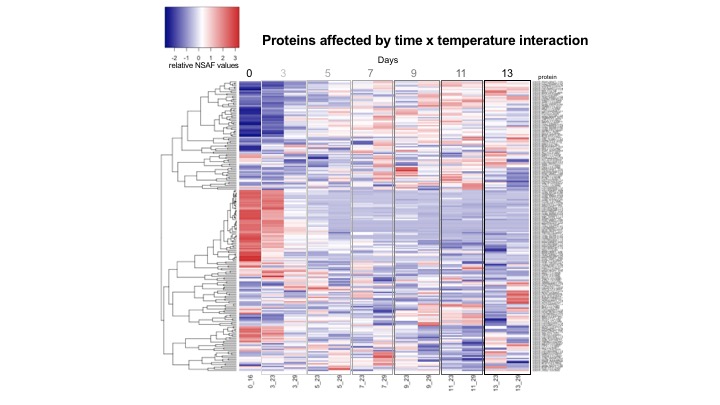
With the averaged NSAF values for all proteins, and following the analysis flow I did yesterday, I generated heatmaps for ASCA identified proteins affected by temperature, time, and the interaction of temperature and time.
The data files with the ASCA identified proteins and their averaged NSAF values are here:
- ACSA identified proteins affected by temperature
- ASCA identified proteins affected by time
- ASCA identified proteins affected by the temperature x time interaction
Next steps
- determine fold change for each ASCA identified protein relative to day 0.
- at lab meeting, Emma explained how to do this using the ratio of each protein’s TOTNUMSPEC divided by the sum of all protein TOTNUMSPEC for each sample. Then calculating the log2 fold change. Then doing a test of proportions to get a p-value.
- input the fold change and p-values into a pathway enrichment tool to make a network visualization