This entry refers to ASCA_avgNSAFvals_FilteredProteins.md; R markdown file here.
I redid ANOVA-simultaneous component analysis (ASCA) on average NSAF values of proteins that passed the filter for inconsistent detection in technical replicates (see yesterday’s post).
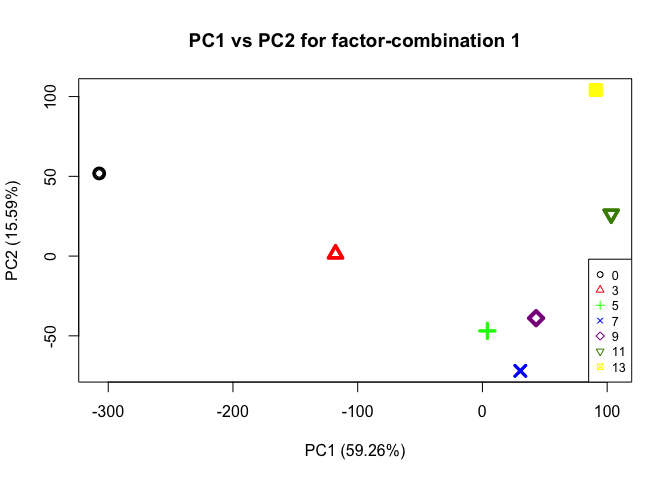
The PCAs generated by the ASCA look a little different than last time when I had used the ADJNUMSPEC vals, included day 15, and day 0 for both temperatures.
PCA for time (days)
| new | old |
|---|---|
 |
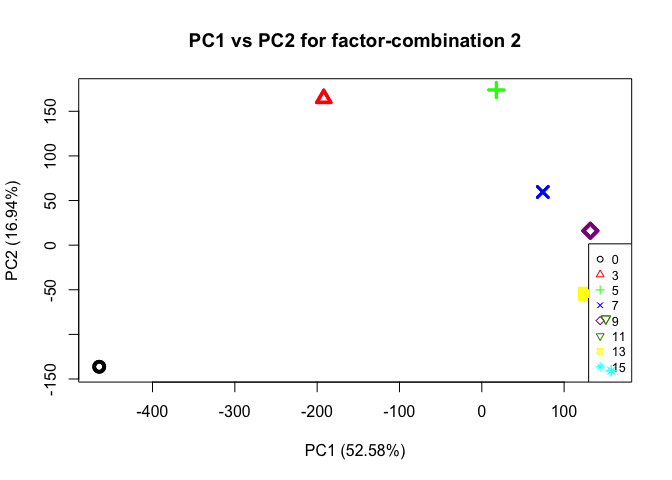 |
PCA for temperature
| new | old |
|---|---|
 |
 |
I went ahead and did the analysis of proteins affected by temperature based on the PCA for temperature (‘PC1 vs PC2 for factor-combination 2’)(a), specifically looking at PC2 loadings values since this component shows the most separation between 23C and 29C. I made a heatmap plot (d) of proteins with PC2 loadings that fall within a cutoff I defined from loadings plots (b,c)

I added these methods and this figure into our draft manuscript.
It will be interesting to look deeper into what these proteins are that show higher abundance in 23C/ lower abundance in 29C; and vice-versa.