I took a quick look at Silo 2 vs Silo 3 proteomes because silo 2 had 2% survival where silo 3 had 10% survival.
 graph is from here
PCA of silo 2 and 3 technical replicates looked good so averaged the NSAF values.

Here’s the heatmap of silo 2 vs silo 3.
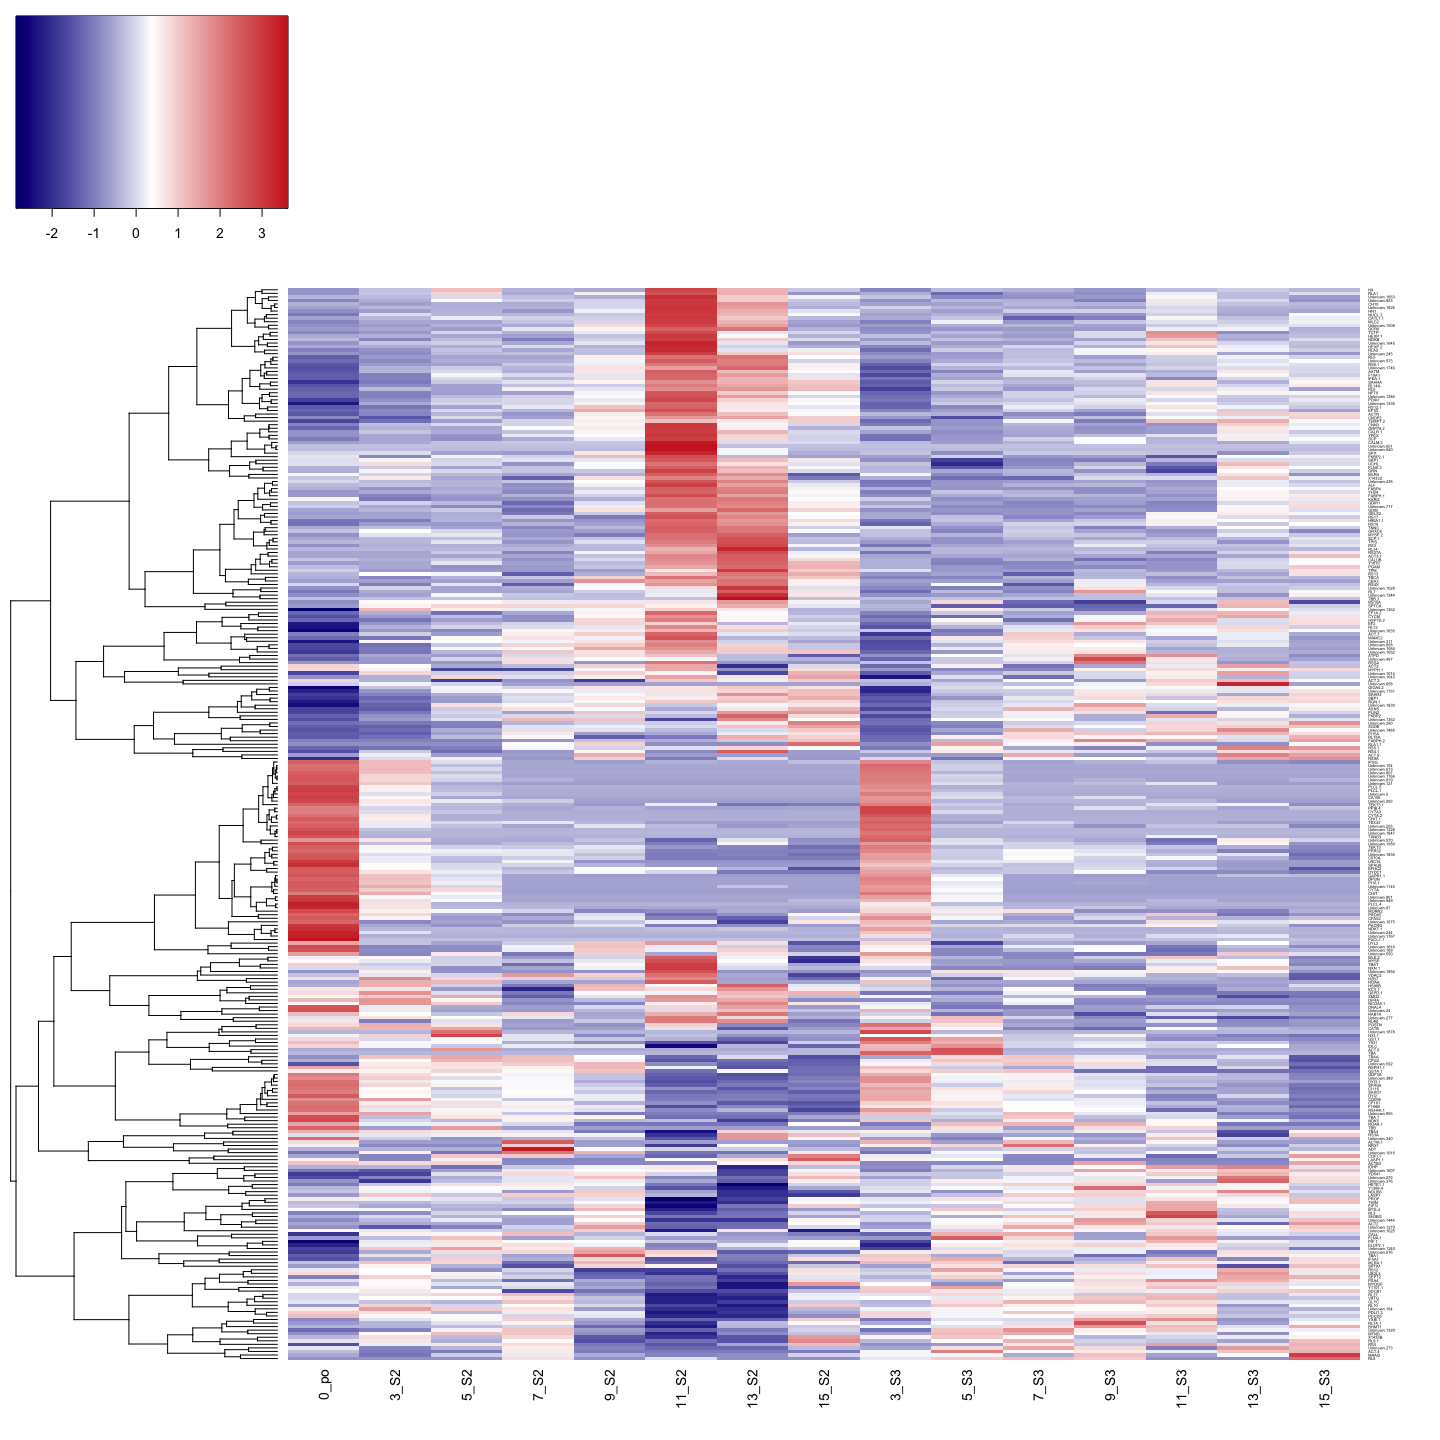
Day 11 and 13 show stark differences in silo 2 compared to silo 3. The top cluster of proteins show very high expression and the bottom cluster show very low expression in silo 2 compared to silo 3.
Need to look into what these proteins are
Code
Markdown files:
ASCA_avgNSAFvals_AllProteins_Silo2v3.md
and ClusteringTechnicalReplicatesSilo2vs3.md
generated by these R markdown files: ASCA_avgNSAFvals_AllProteins_Silo2v3.Rmd and ClusteringTechnicalReplicatesSilo2vs3.Rmd.