Based on the Meth_Compare project and parameters we collectively decided on in processing bisulfite sequencing data, I wanted to reprocess the salmon BS data. Before re-doing all alignments, I wanted to explore different alignment options for potential optimization.
Alignment optimization: Explore PE vs. SE mode
Alignment in SE mode typically retains more of the data than alignment in PE mode. Zymoresearch shared the parameters they use for alignment:
- On Fri, Jul 19, 2019 at 2:19 PM Karolyn Giang kGiang@zymoresearch.com wrote: For Pico Methyl-Seq libraries, we use Bismark and Bowtie1 for alignment with the non-directional alignment settings and our bioinformatics team uses this sequence for trimming purposes: GATCGGAAGAGC. For methylation calling, we use Methyldackel. If the libraries were sequenced using PE reads, we sometimes align the reads as SR to increase alignment rates. Another suggestion is to first perform the adapter trimming, and then trim the first 5 nucleotides at the beginning of read 1 and read 2. The random priming may generate artifacts that causes issues with alignment, so trimming off the first few nucleotides can help.
Alignment optimization: Explore global vs local alignment mode
local alignment mode performs soft clipping so that reads with mismatching sequence (poor quality) in the beginning or end of the read can still be retained.
- more info https://github.com/FelixKrueger/Bismark/issues/265
- “explore what causes the differences, and whether or not you trust the local alignments. If, for instance, all extra alignments in local mode originate from one certain repetitive location of the genome, there is probably not much added value in using it. If you find a technical justification why you would want to use local mode in your case, and this adds additional reads everywhere equally, it might be a good idea.”
Analyses:
- Picked 4 samples at random and for all reads did:
- PE trimming for PE alignments
- SE trimming for SE global alignments
- Script: 20200422_CompareBmrkAlgnSalmo.sh performs whole PE pipeline (alignments + downstream processing), SE global alignments, and SE local alignments
- slurm file: slurm-2509659.out
- Output:
- PE alignments and downstream processed data: https://gannet.fish.washington.edu/metacarcinus/Salmo_Calig/analyses/20200422/TG_PE_Aligned
- SE global alignments: https://gannet.fish.washington.edu/metacarcinus/Salmo_Calig/analyses/20200422/TG_SE_Aligned
- SE local alignments: https://gannet.fish.washington.edu/metacarcinus/Salmo_Calig/analyses/20200422/TG_SE_local_aligned
- Script: 20200422_CompareBmrkAlgnSalmo.sh performs whole PE pipeline (alignments + downstream processing), SE global alignments, and SE local alignments
- SE alignment downstream processing
- Script: 20200423_CompareBmrkAlgnSalmo.sh performs SE deduplication, methylation extraction, and multiqc
- slurm file: slurm-2512776.out
- Script: 20200424_BmrkBedCovSalmo.sh: creates SE bedgraphs, merged cov,sorted bams, 5x.bed files
- slurm file: slurm-2522675.out
- output:
- SE global processed alignments: https://gannet.fish.washington.edu/metacarcinus/Salmo_Calig/analyses/20200423/TG_SE_Aligned/
- SE local processed alignments: https://gannet.fish.washington.edu/metacarcinus/Salmo_Calig/analyses/20200423/TG_SE_local_aligned/
- Script: 20200423_CompareBmrkAlgnSalmo.sh performs SE deduplication, methylation extraction, and multiqc
- Compare PE and SE results
- Script: 20200424_BmrkBedIntersectSalmo.sh This script compares bedgraphs from Bismark output and creates bed files containing unique alignments retained by one method versus another. For example, 8C_26psu_3_S11_L001_R1_001.PEuniq.vSEG.bed contains all PE alignments that are not retained in Single End global alignments.
- Script: find common loci identified by different modes
- 20200706_BedIntrsctCommon.sh This script broke in the last part comparing SE global to SE local CpG loci because I gave a mox path instead of the Gannet path
- 20200706_BedIntrsctCommon2.sh This script performs the last comparison of SE global to SE local CpG loci with the correct Gannet path
- log files:
- output: https://gannet.fish.washington.edu/metacarcinus/Salmo_Calig/analyses/20200424/
- Script: This script finds common and unique CpG loci with 5x coverage identified by different modes.
- 20200706_BedIntrsct5x.sh This script broke at lines 32-39 because of a basename discrepency
- 20200706_BedIntrsct5x_2.sh This script carries on from line 32 of the previous script through the end.
- Script: 20200424_BmrkCmpr.Rmd This script generates plots from
- alignment, deduplication, and methylation extraction multiqc data
- common and unique CpG loci at any coverage and at 5x coverage identified by different methods
- Old scripts that failed:
- 20200421_SEvPE_TGbmrk_Salmo.sh: TrimGalore PE, failed at dedup. step
- 20200421_SEvPE_TGbmrk_Salmo1.sh: PE dedup, failed at BME step
- 20200421_SEvPE_TGbmrk_Salmo2.sh: PE BME, failed at SE trimming
- 20200421_SEvPE_TGbmrk_Salmo3.sh: TrimGalore SE, failed at SE alignments
- 20200421_SEvPE_TGbmrk_Salmo4.sh: SE alignments
- 20200422_SElocal_bmrk_Salmo1.sh: dedup and extract SE global and local alignments from 20200421
Results
I. Descriptive stats
TrimGalore in PE or SE mode
- PE or SE mode both give nearly identical numbers. The largest difference is ~0.2% more reads in SE vs. PE
- see differences in the ‘total_reads’ column of alignment reports:
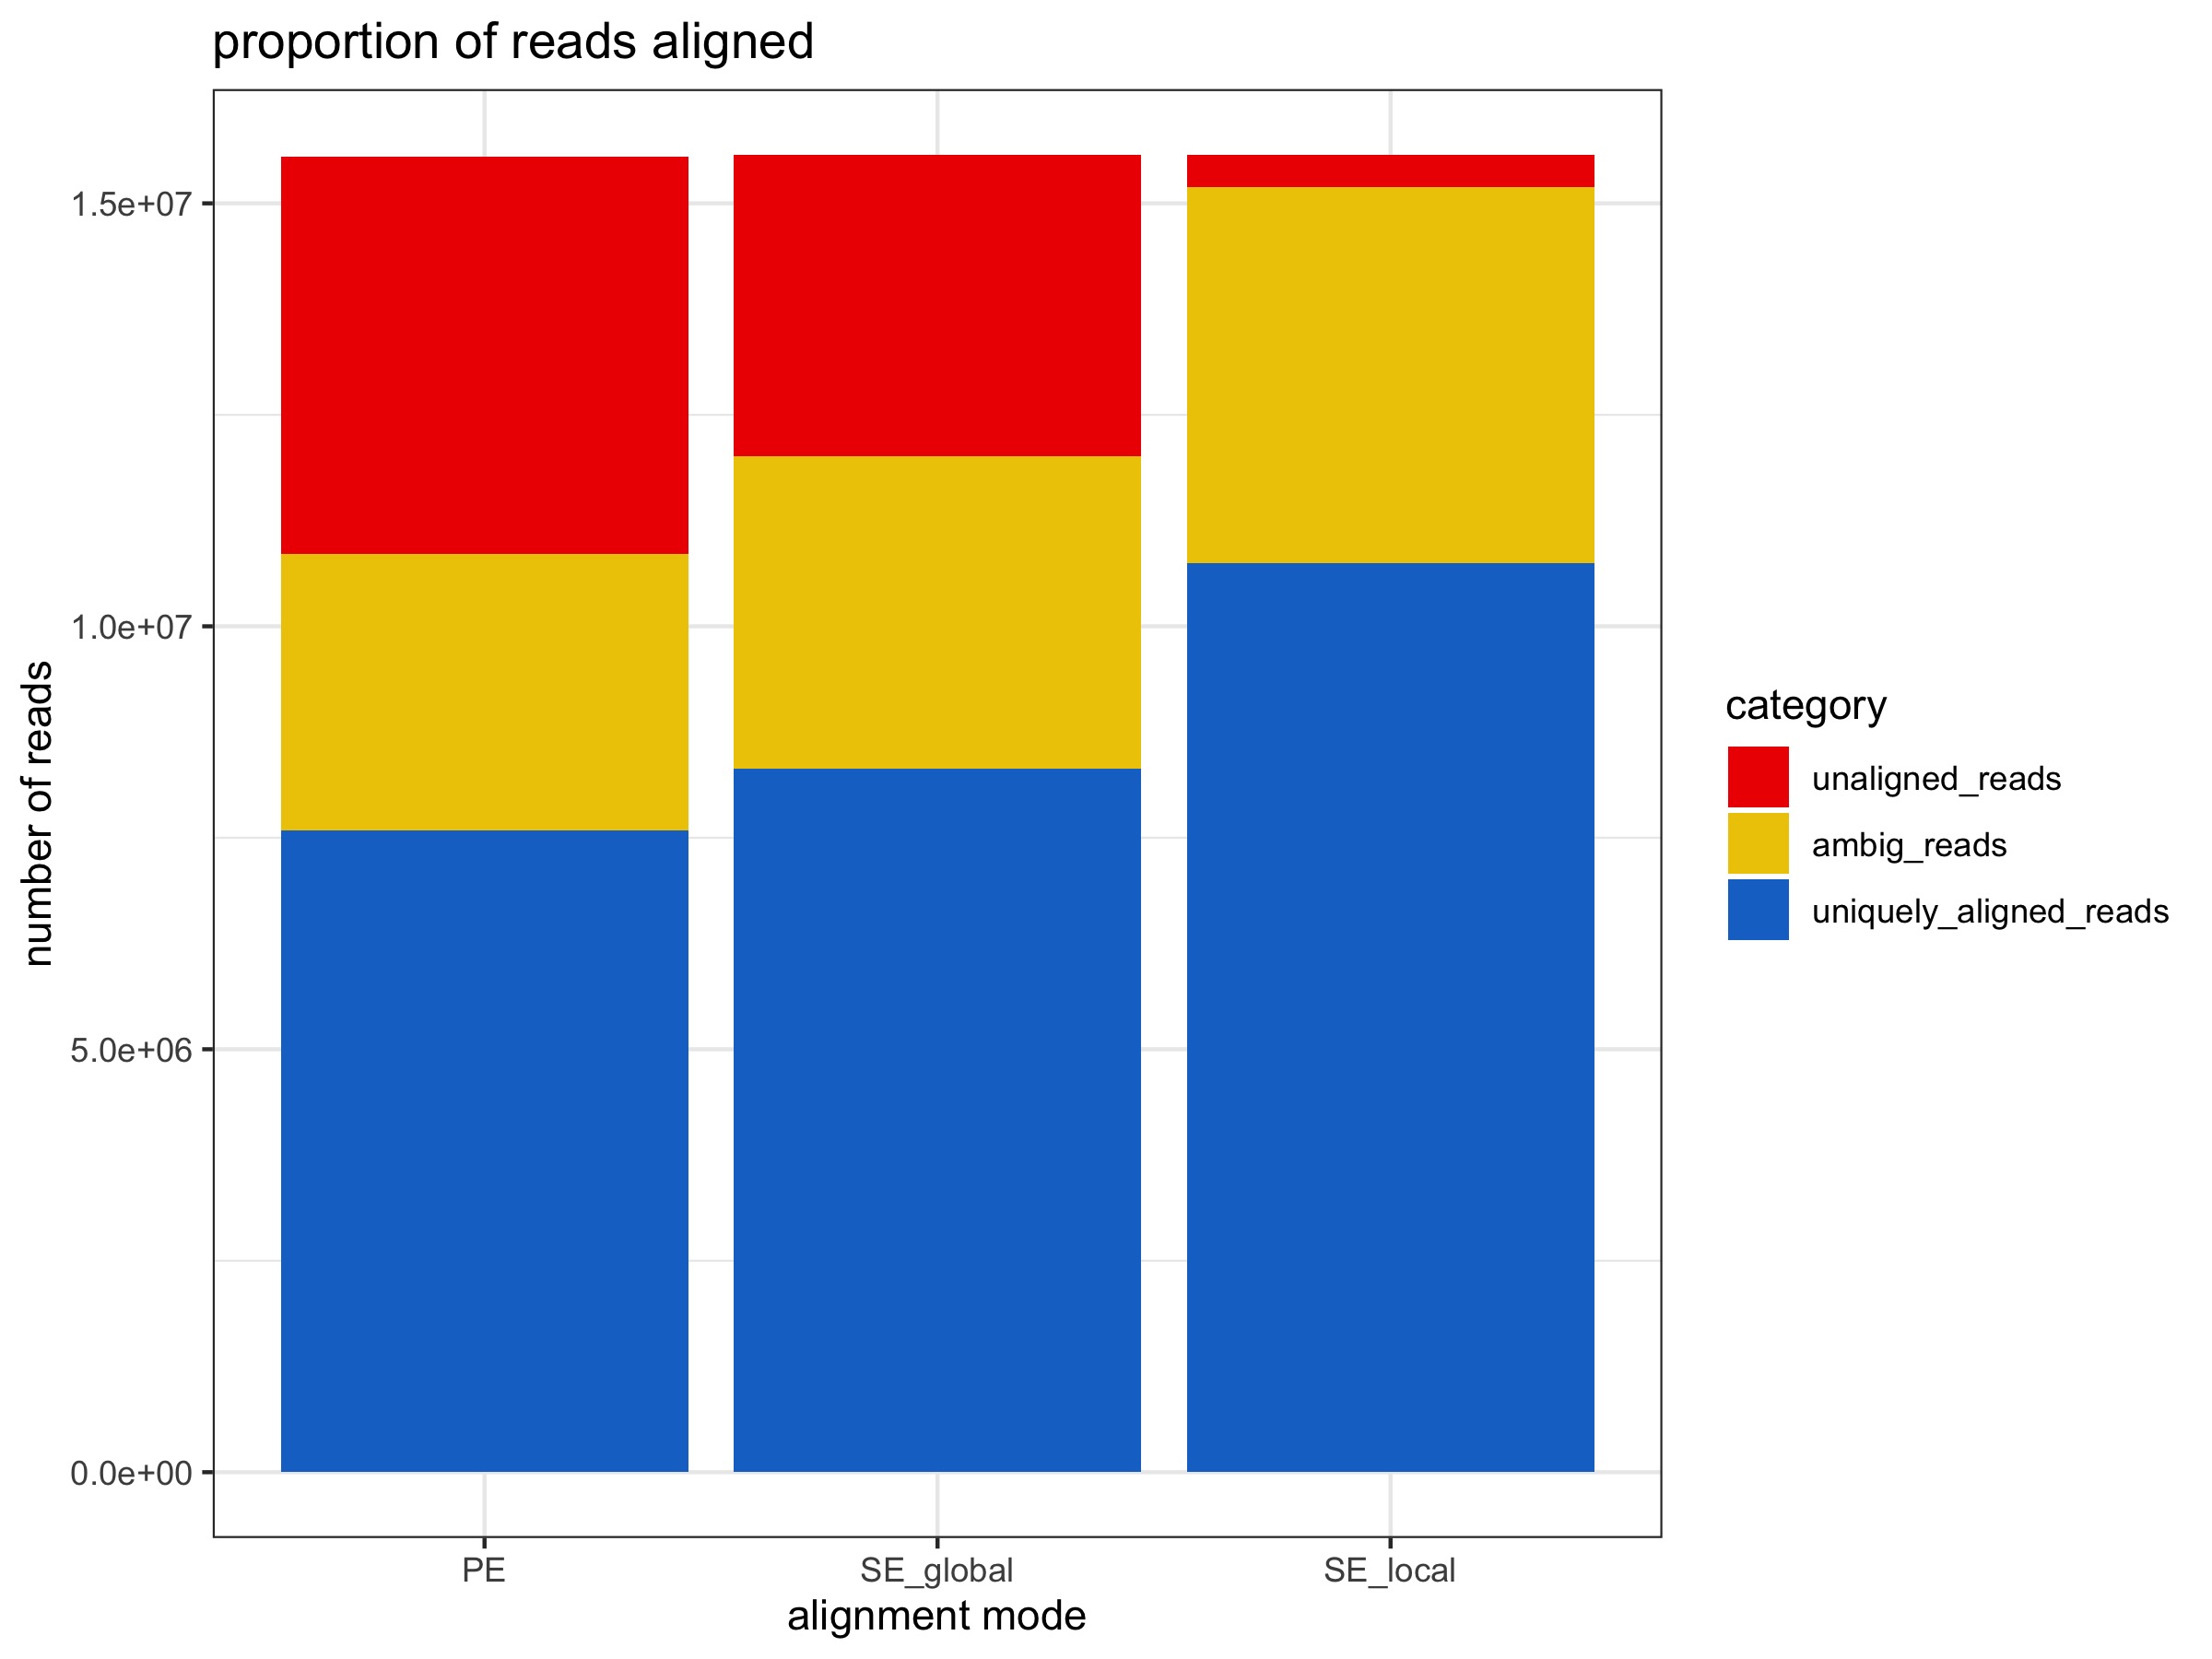
Bowtie2 in PE vs. SE global alignment mode
- Compared to PE alignments, SE gives:
- ~ 5% increase in unique alignments (~700K reads)
- ~ 3% increase in ambiguous alignments
- ~ 7% decrease in no alignments
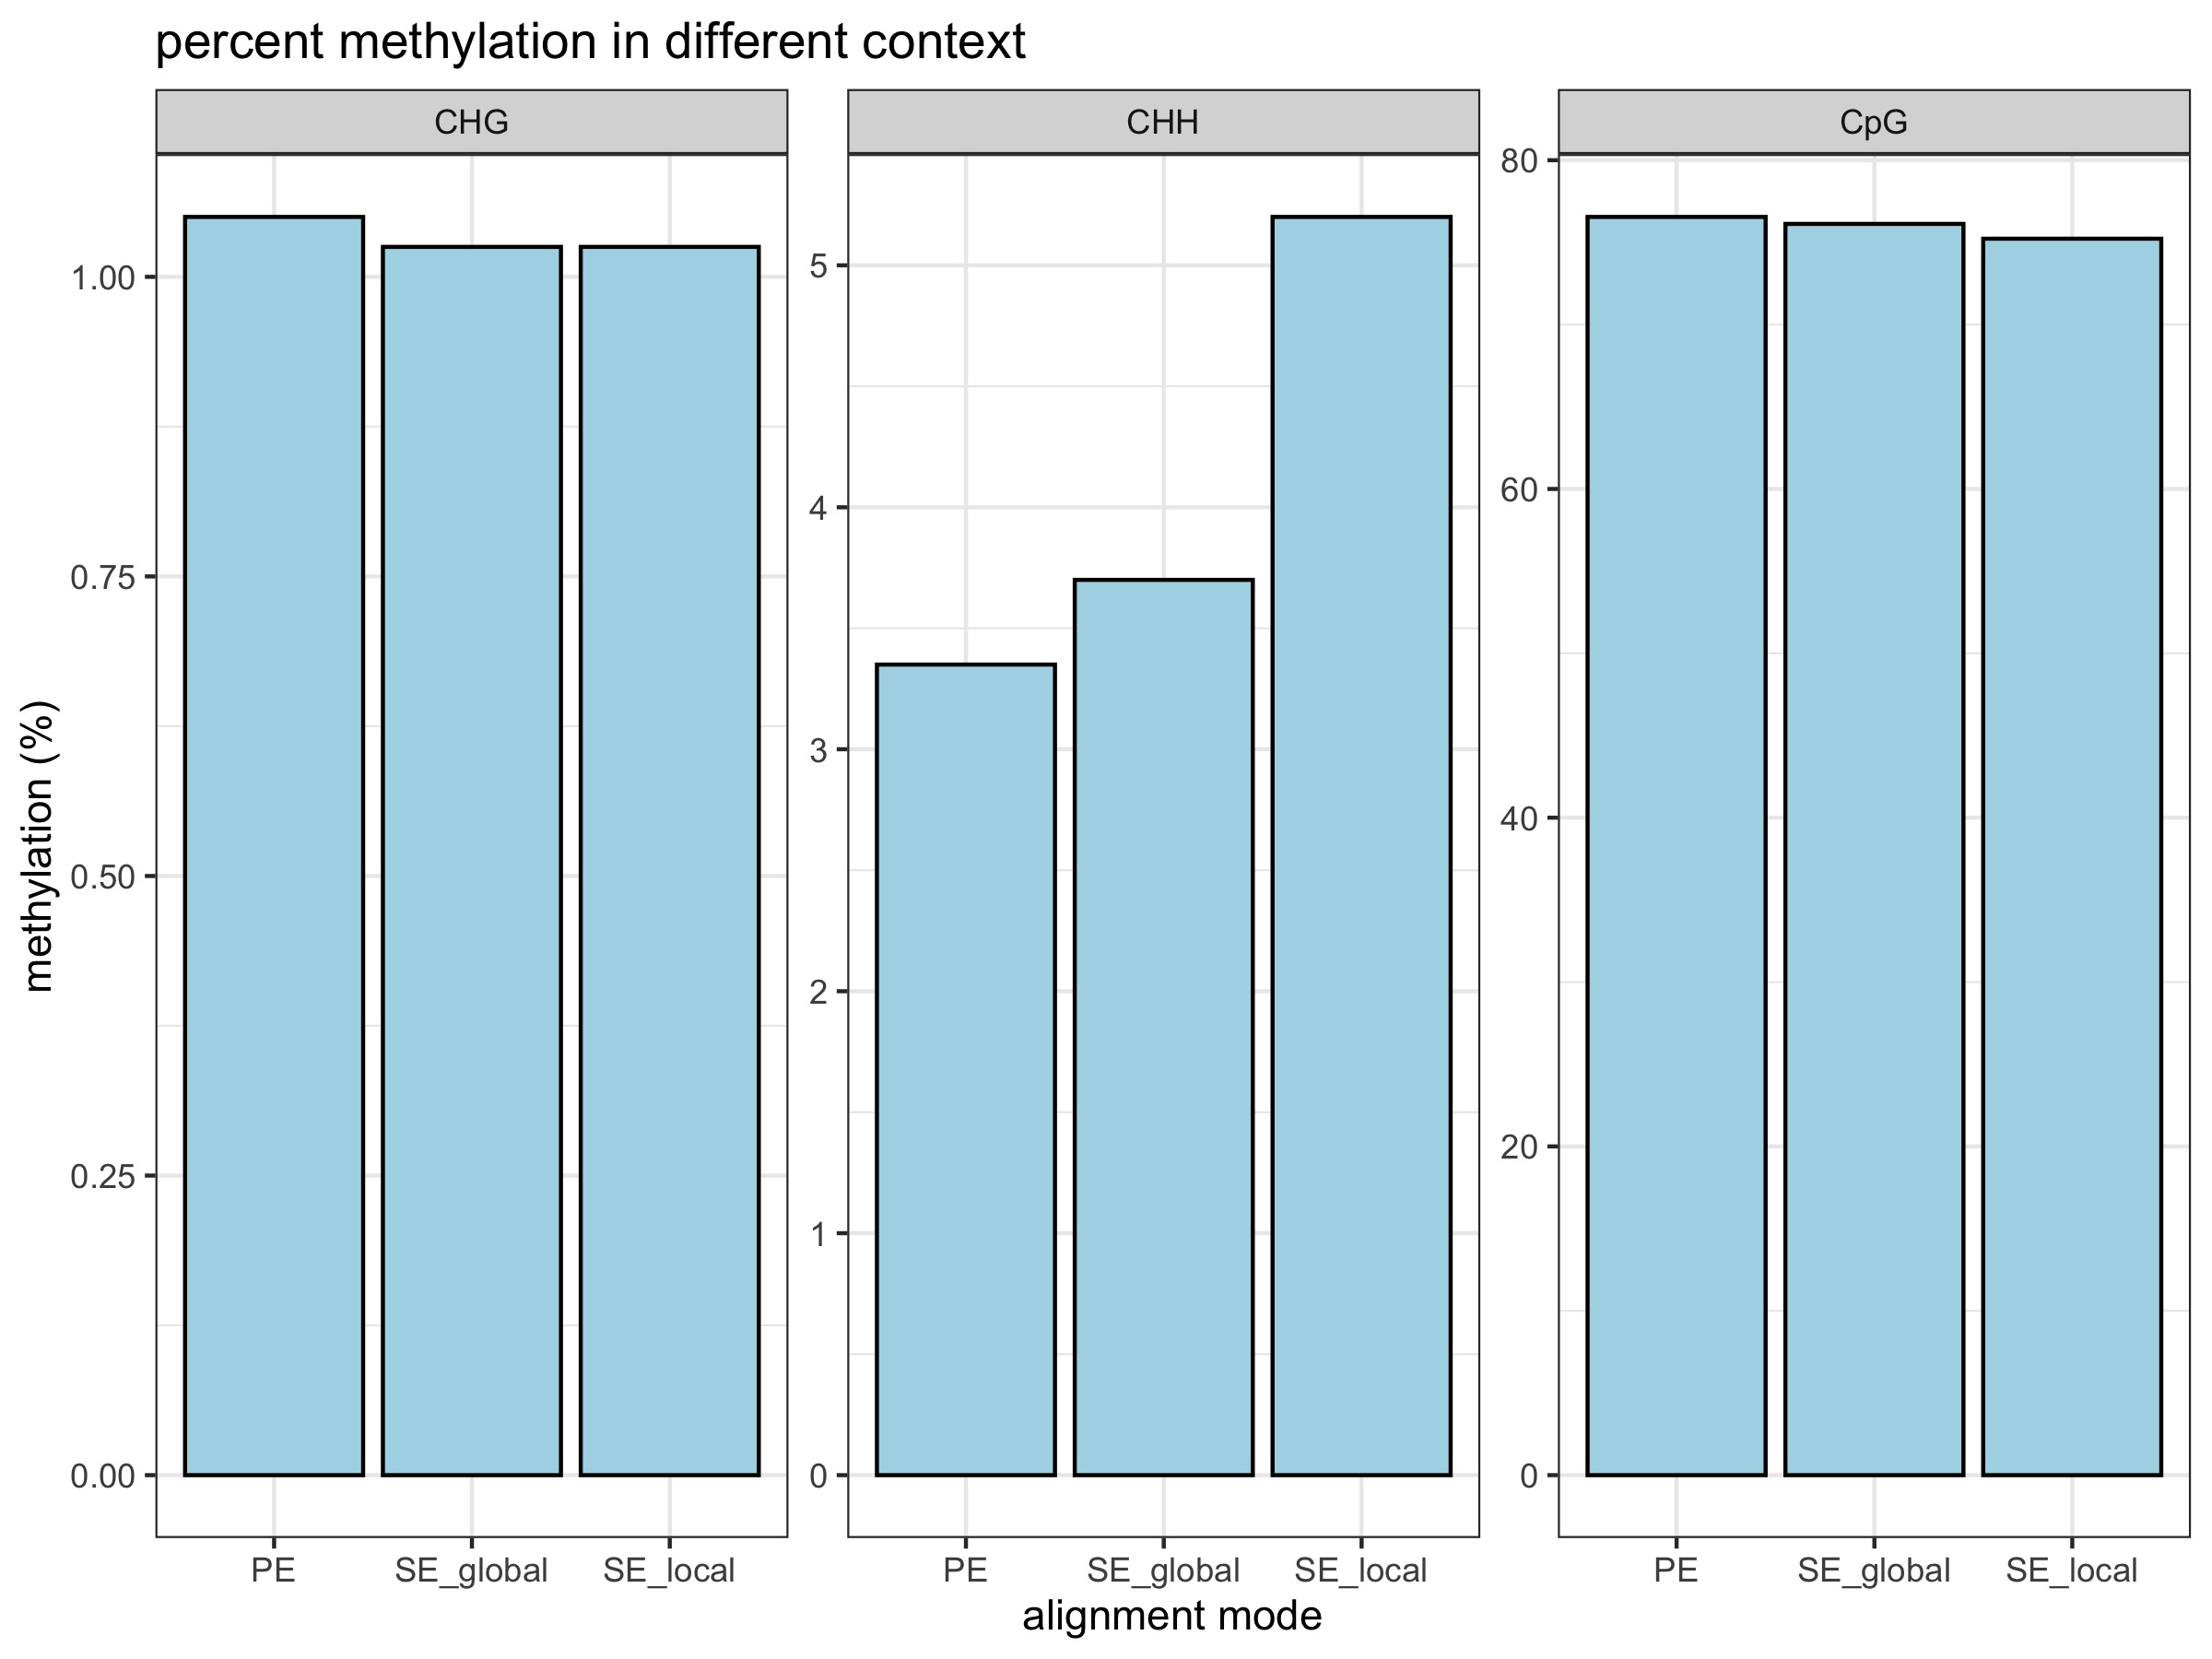
- percent methylation does not change
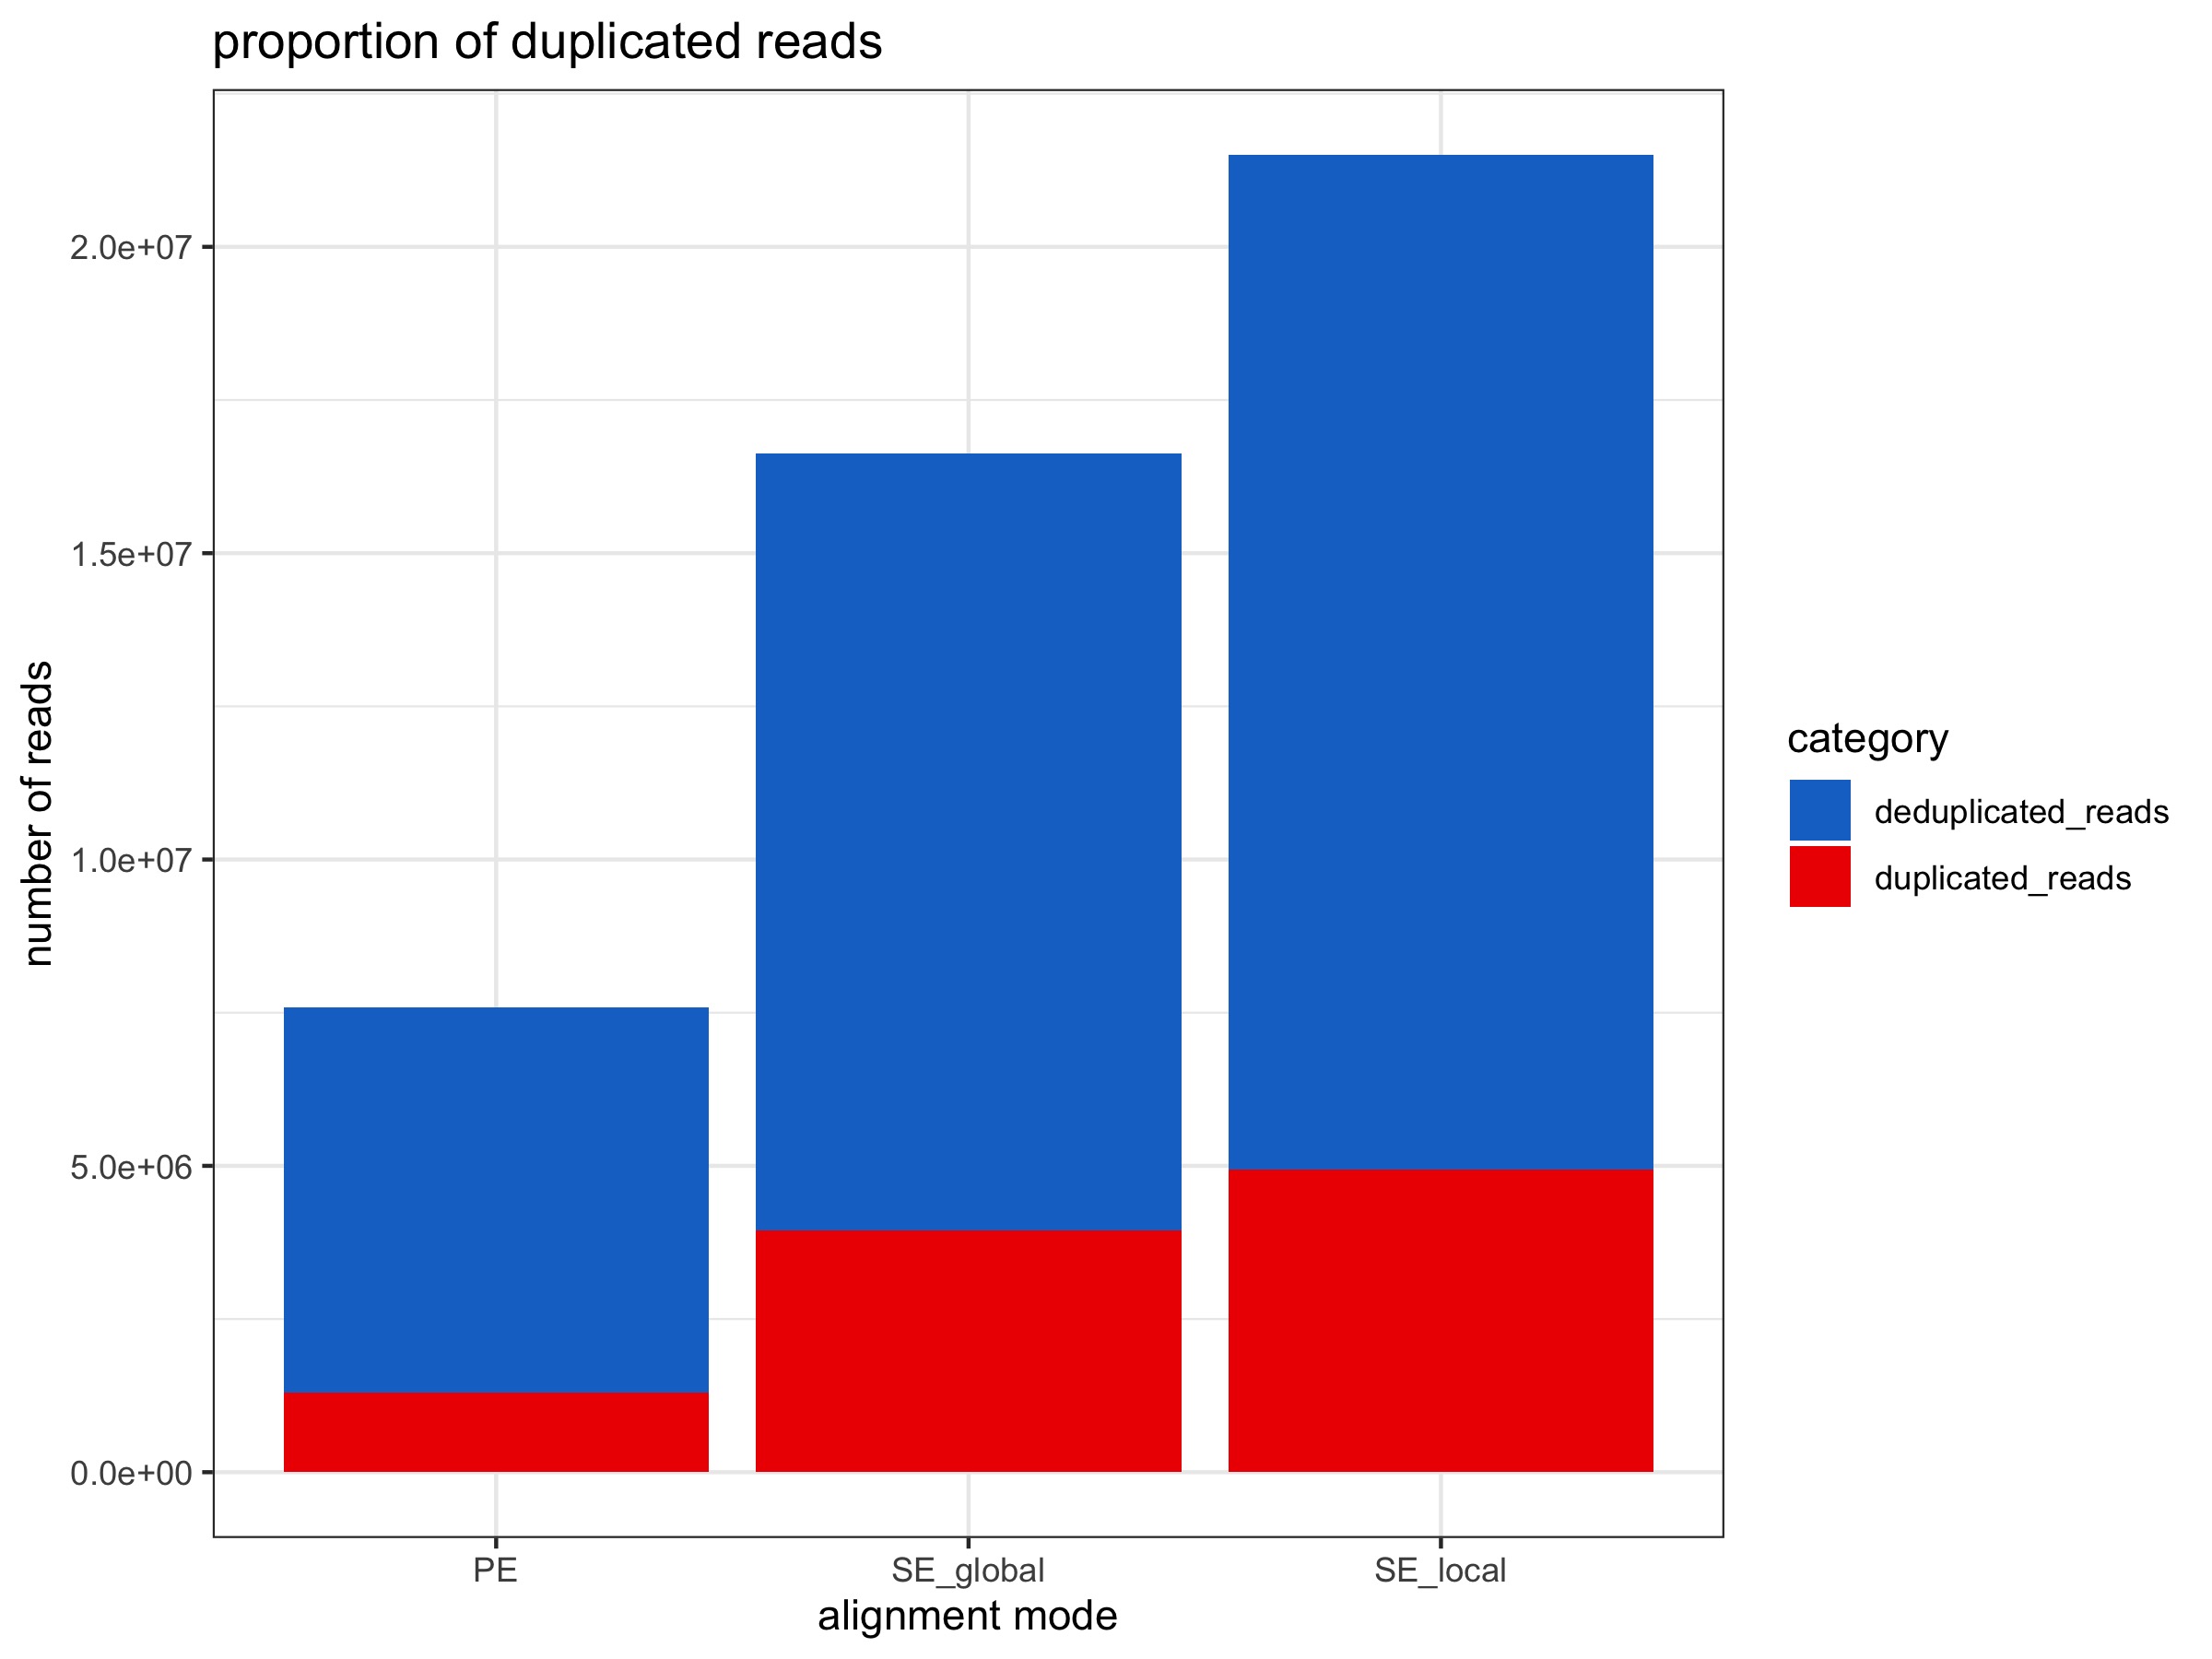
- ~ 7% increase in duplicated reads
- ~ 2x increase in number of deduplicated reads
Bowtie2 in PE vs. SE local alignment mode
- Compared to PE alignments, SE local gives:
- ~ 20% increase in unqiue alignments (~ 3M reads)
- ~ 7% increase in ambiguous alignments
- ~ 28% decrease in no alignments
- ~ 6% increase in duplicated reads
- ~ 2.6x increase in number of deduplicated reads
Alignment stats are from PE alignment multiqc report, SE global alignment multiqc report, and SE local alignment multiqc report.
All plots below were generated by 20200424_BmrkCmpr.Rmd using the above linked multiqc_bismark_alignment.txt files from each Bismark analysis:
I also plotted this data out in a googlesheet before I could get fread to work successfully: PEvSE_trim_align_modes
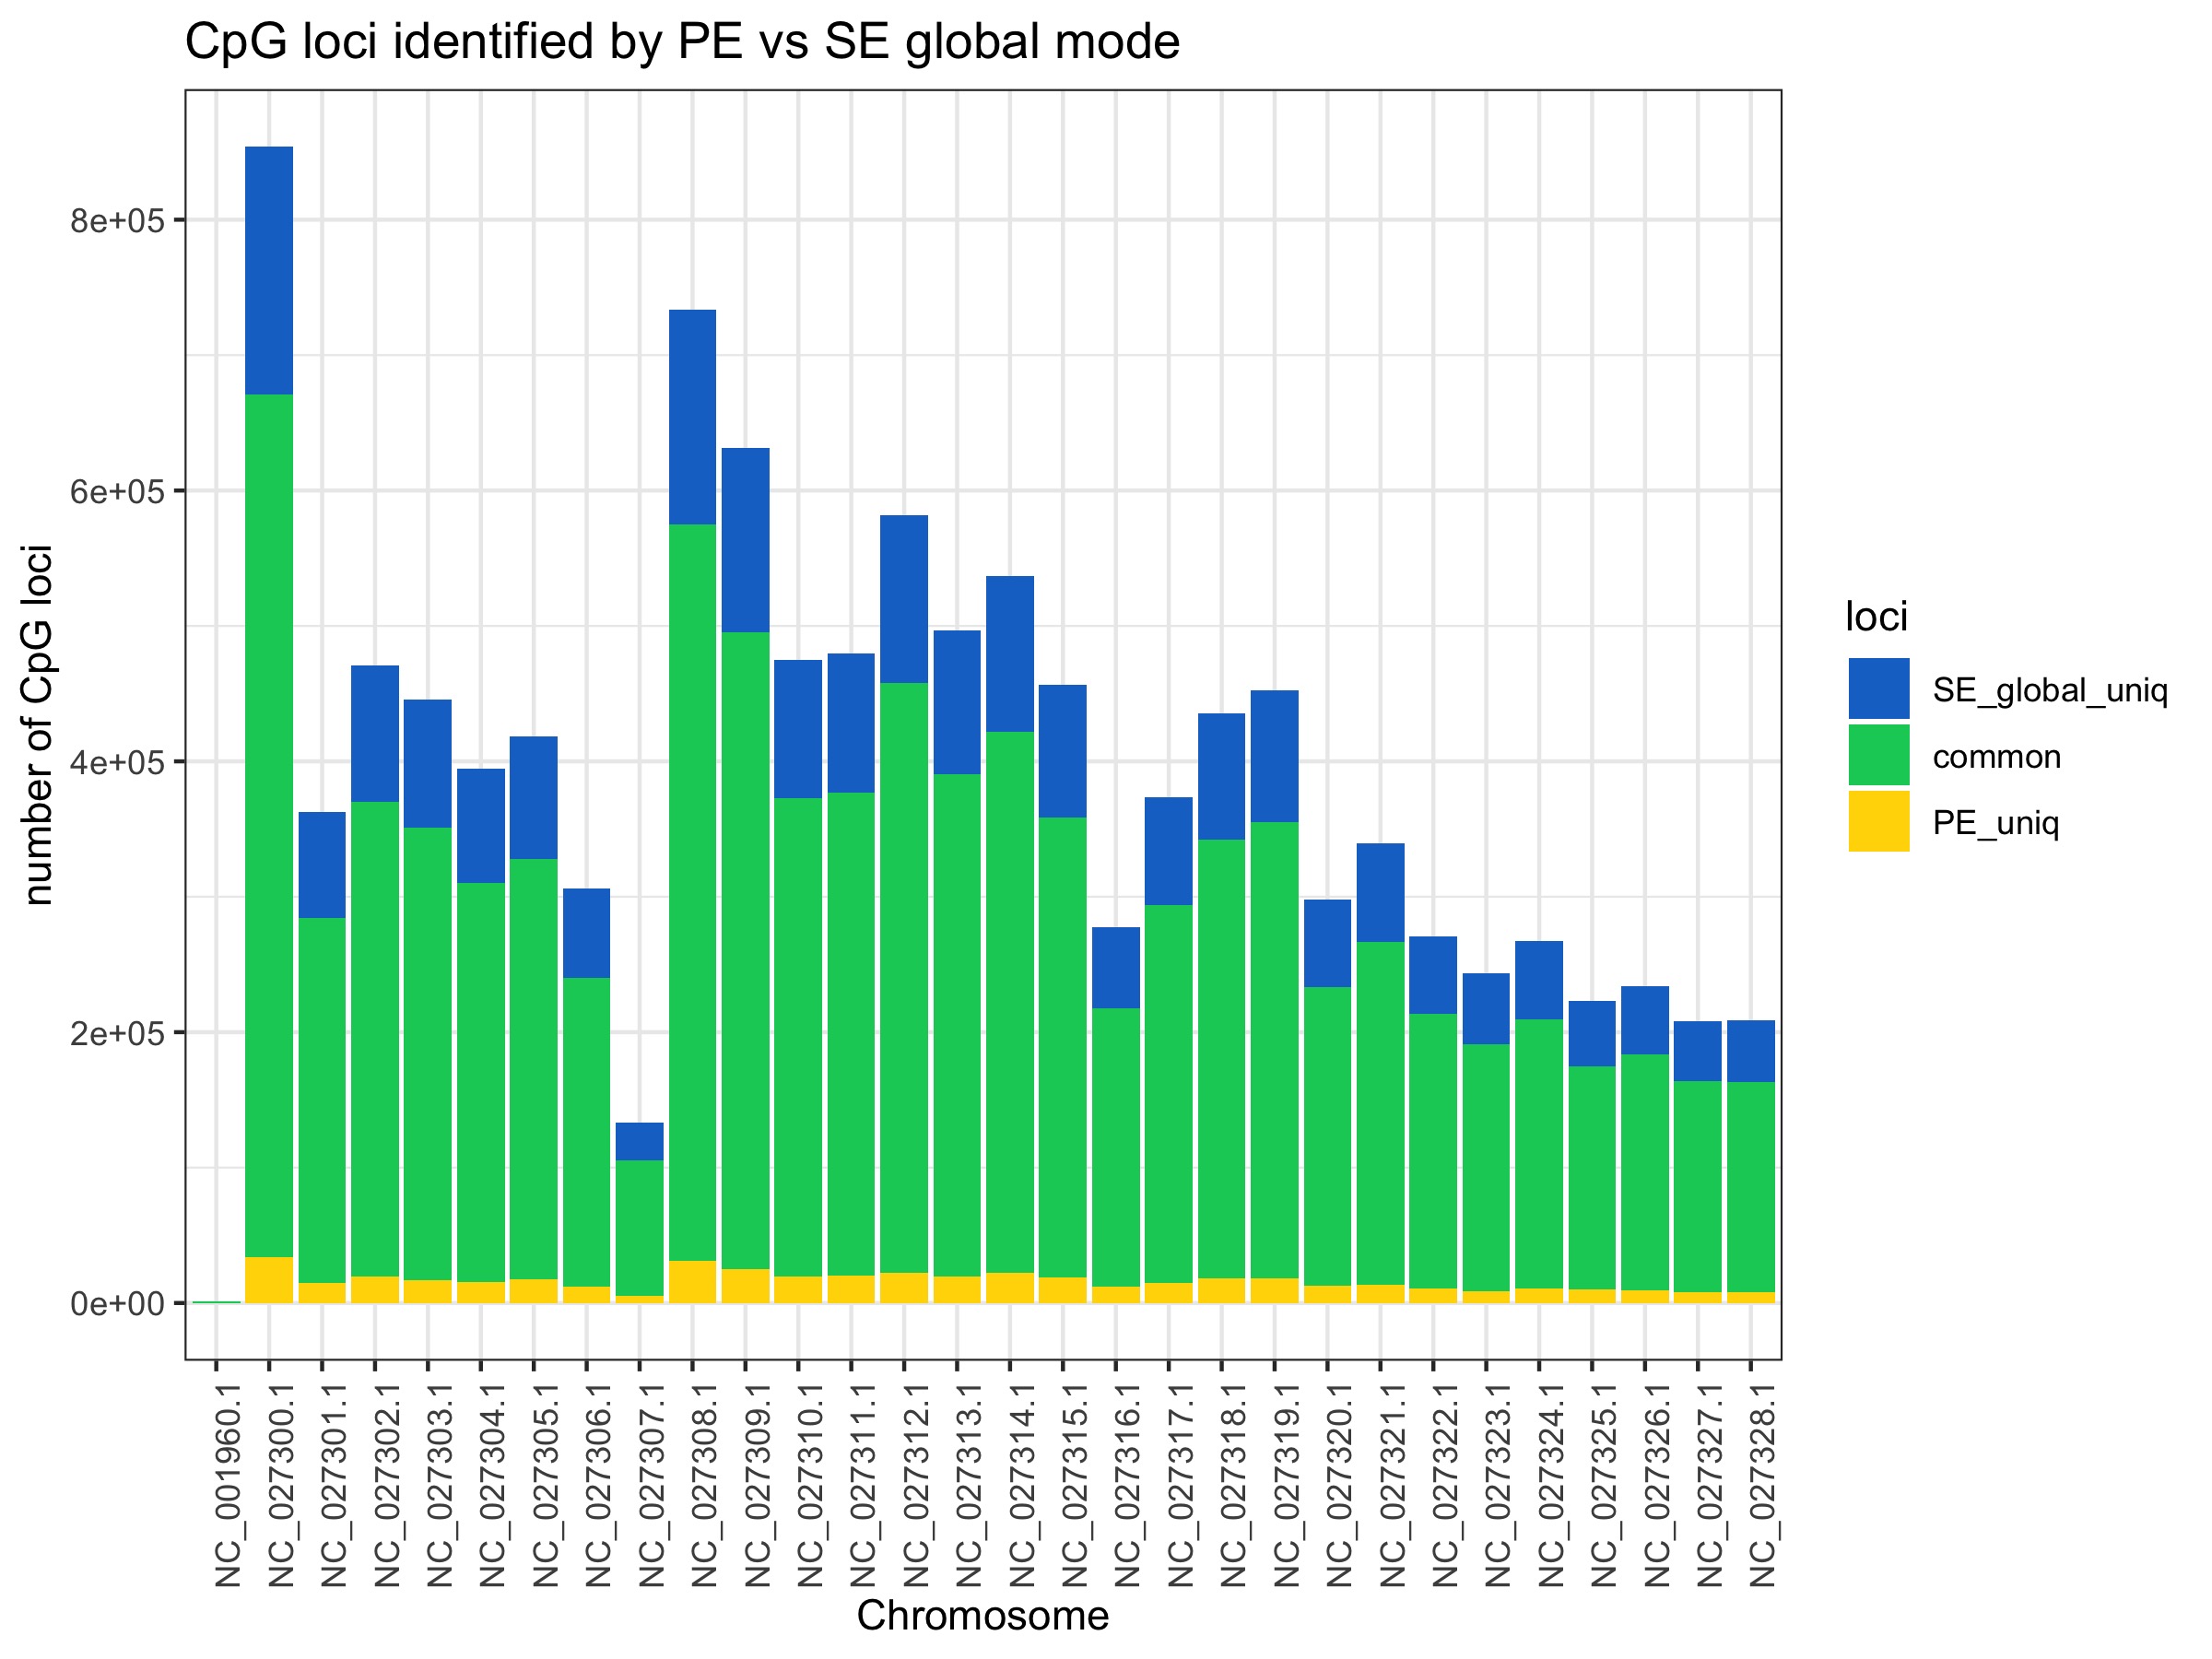
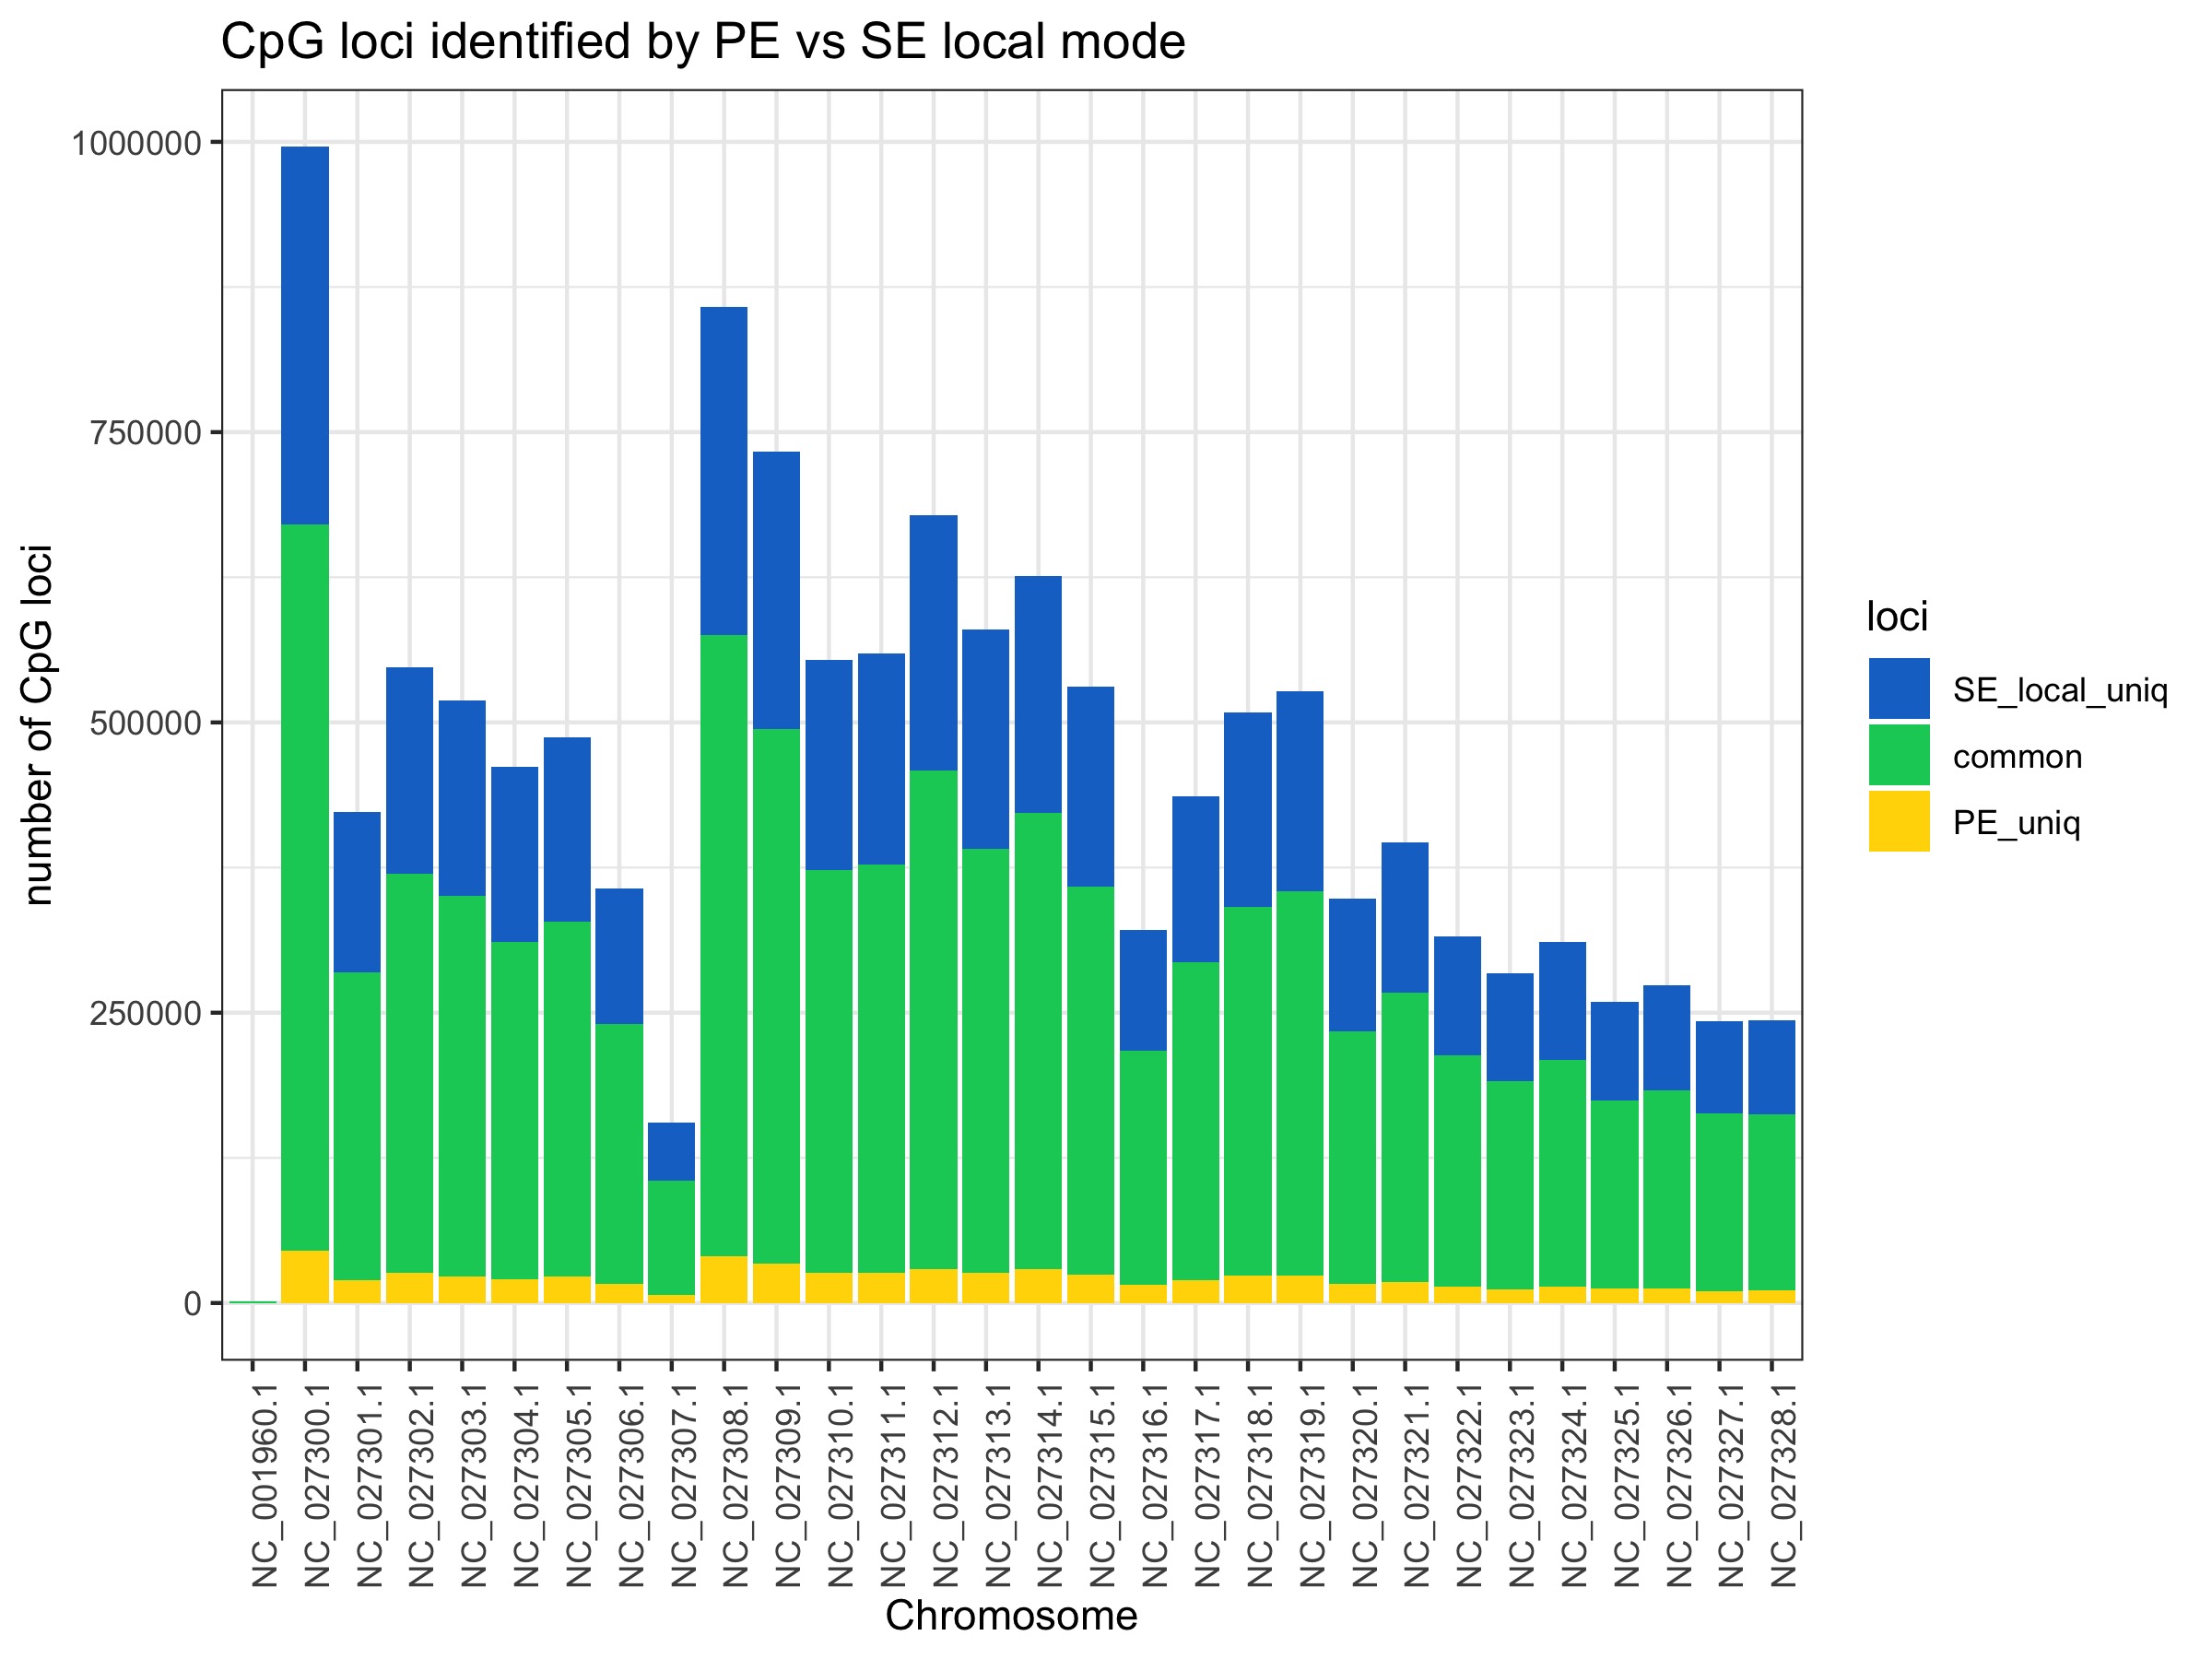
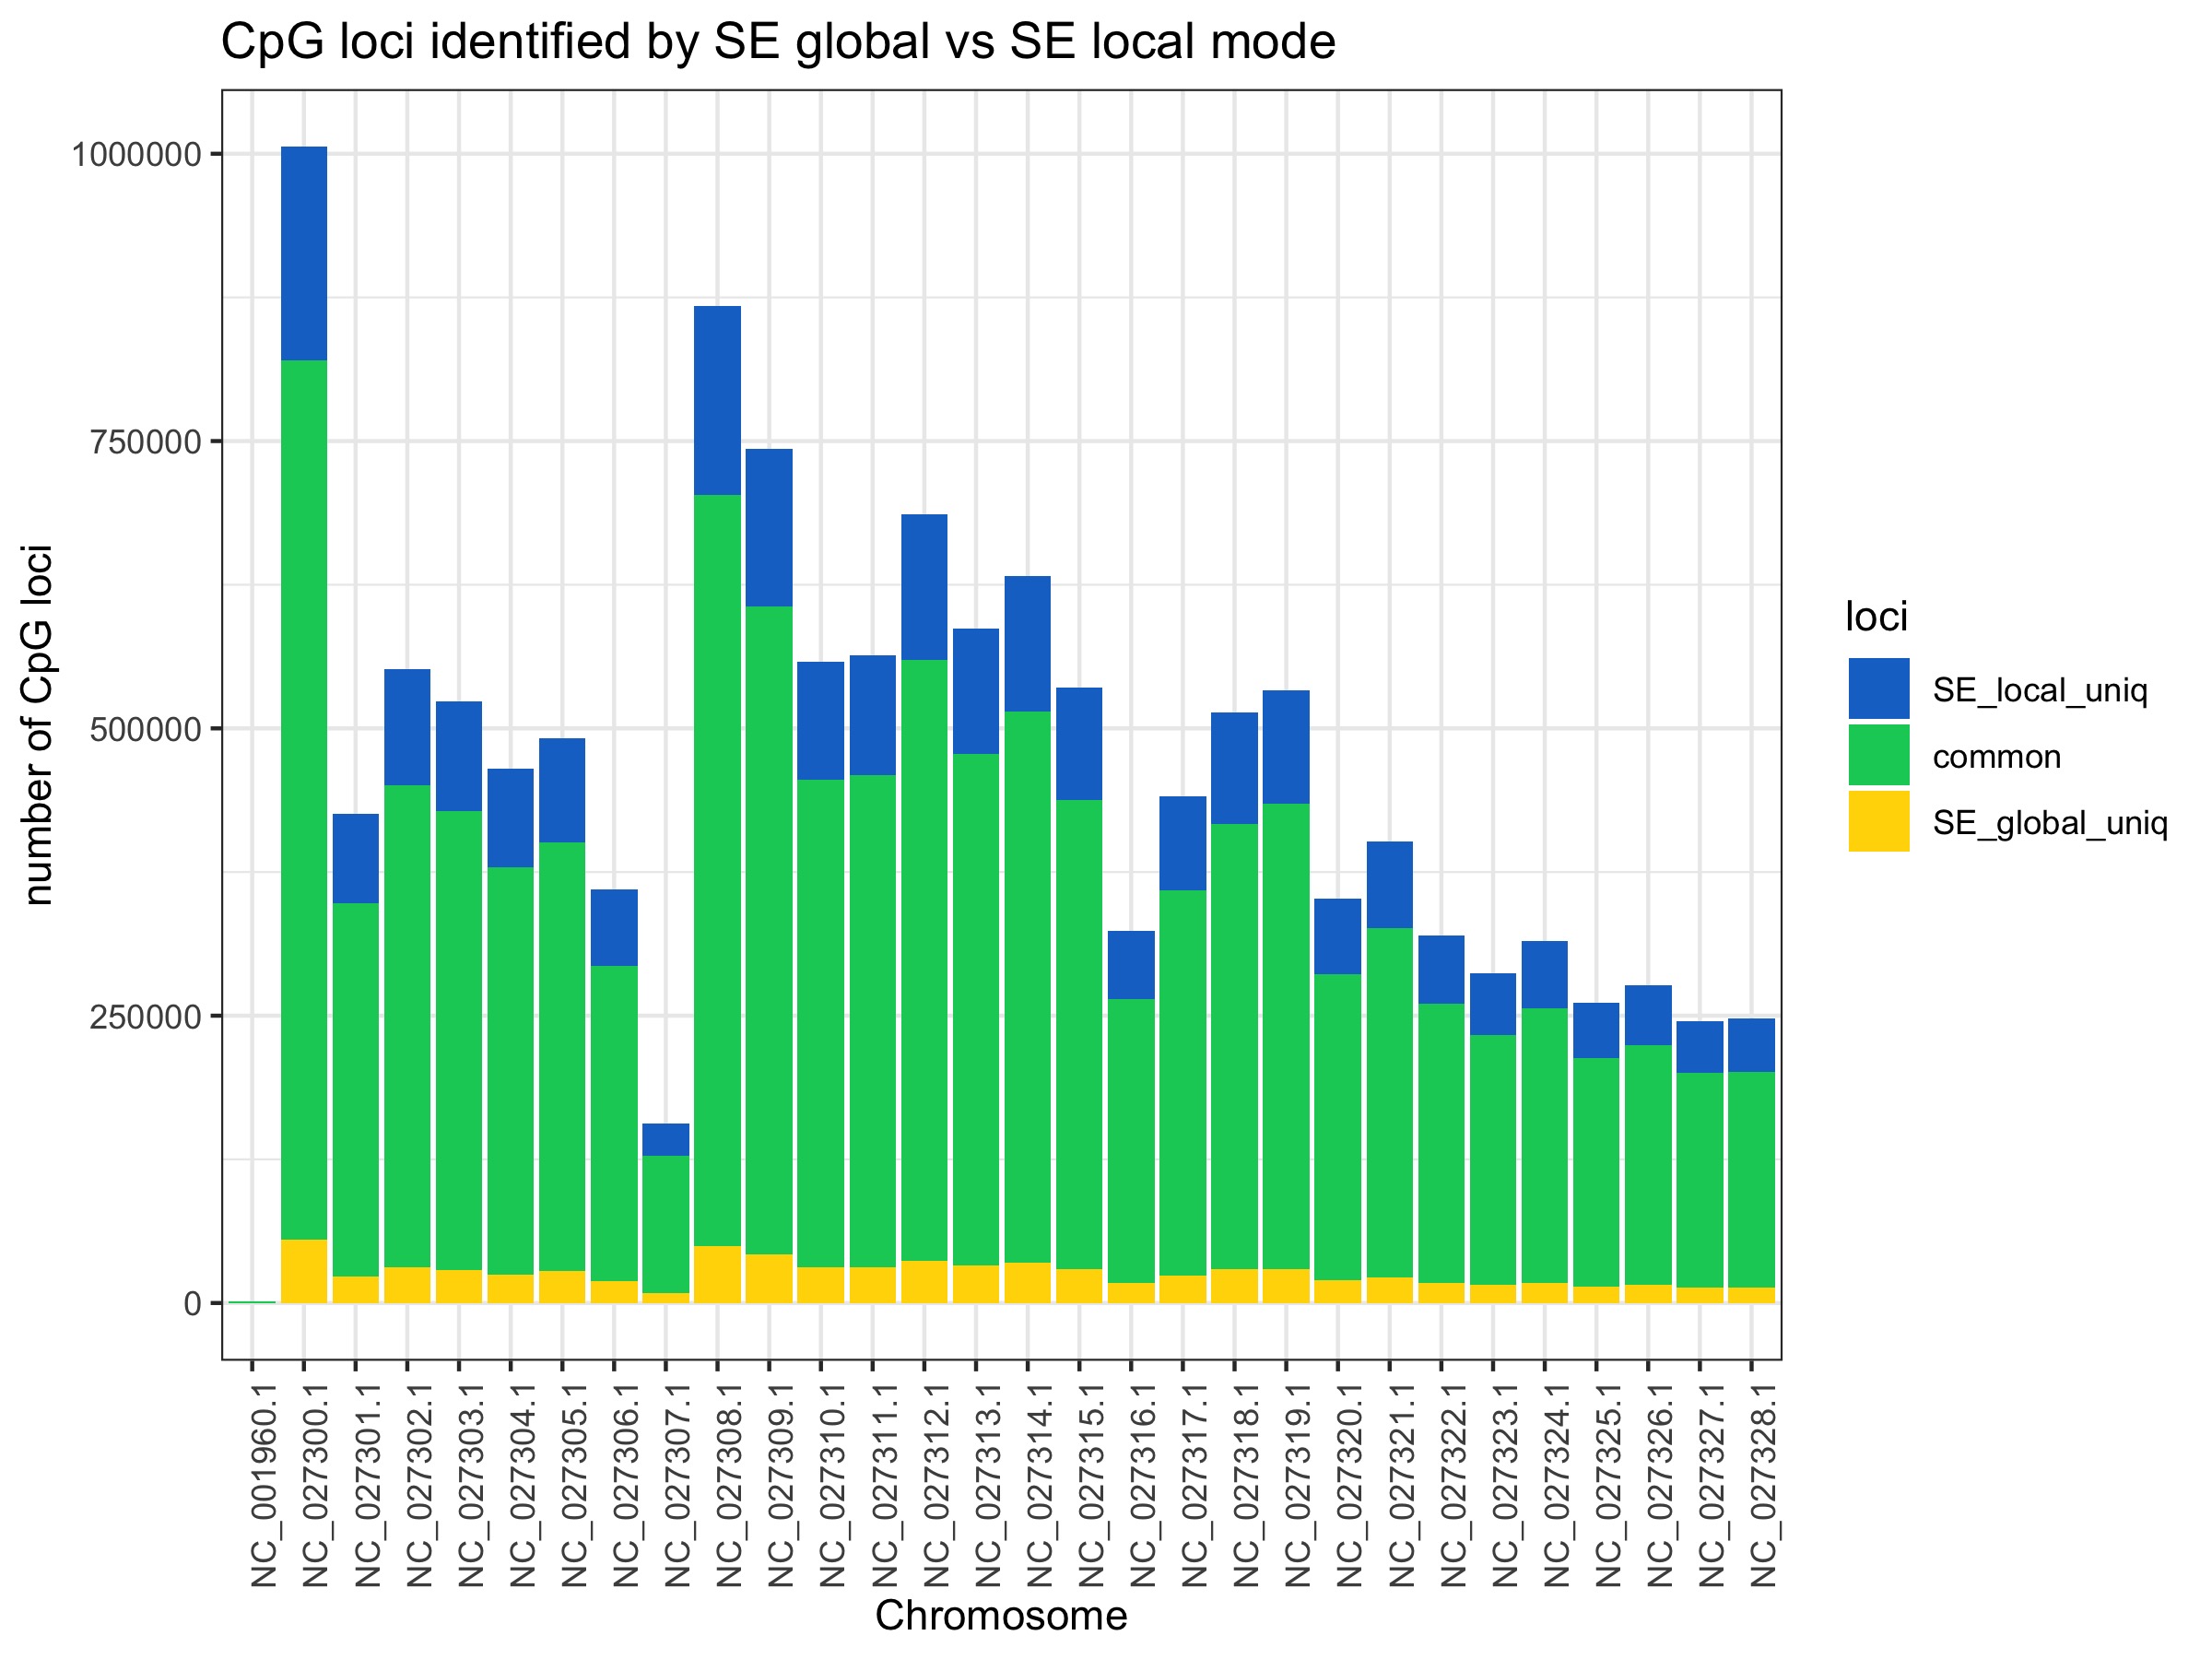
II. CpG loci covered
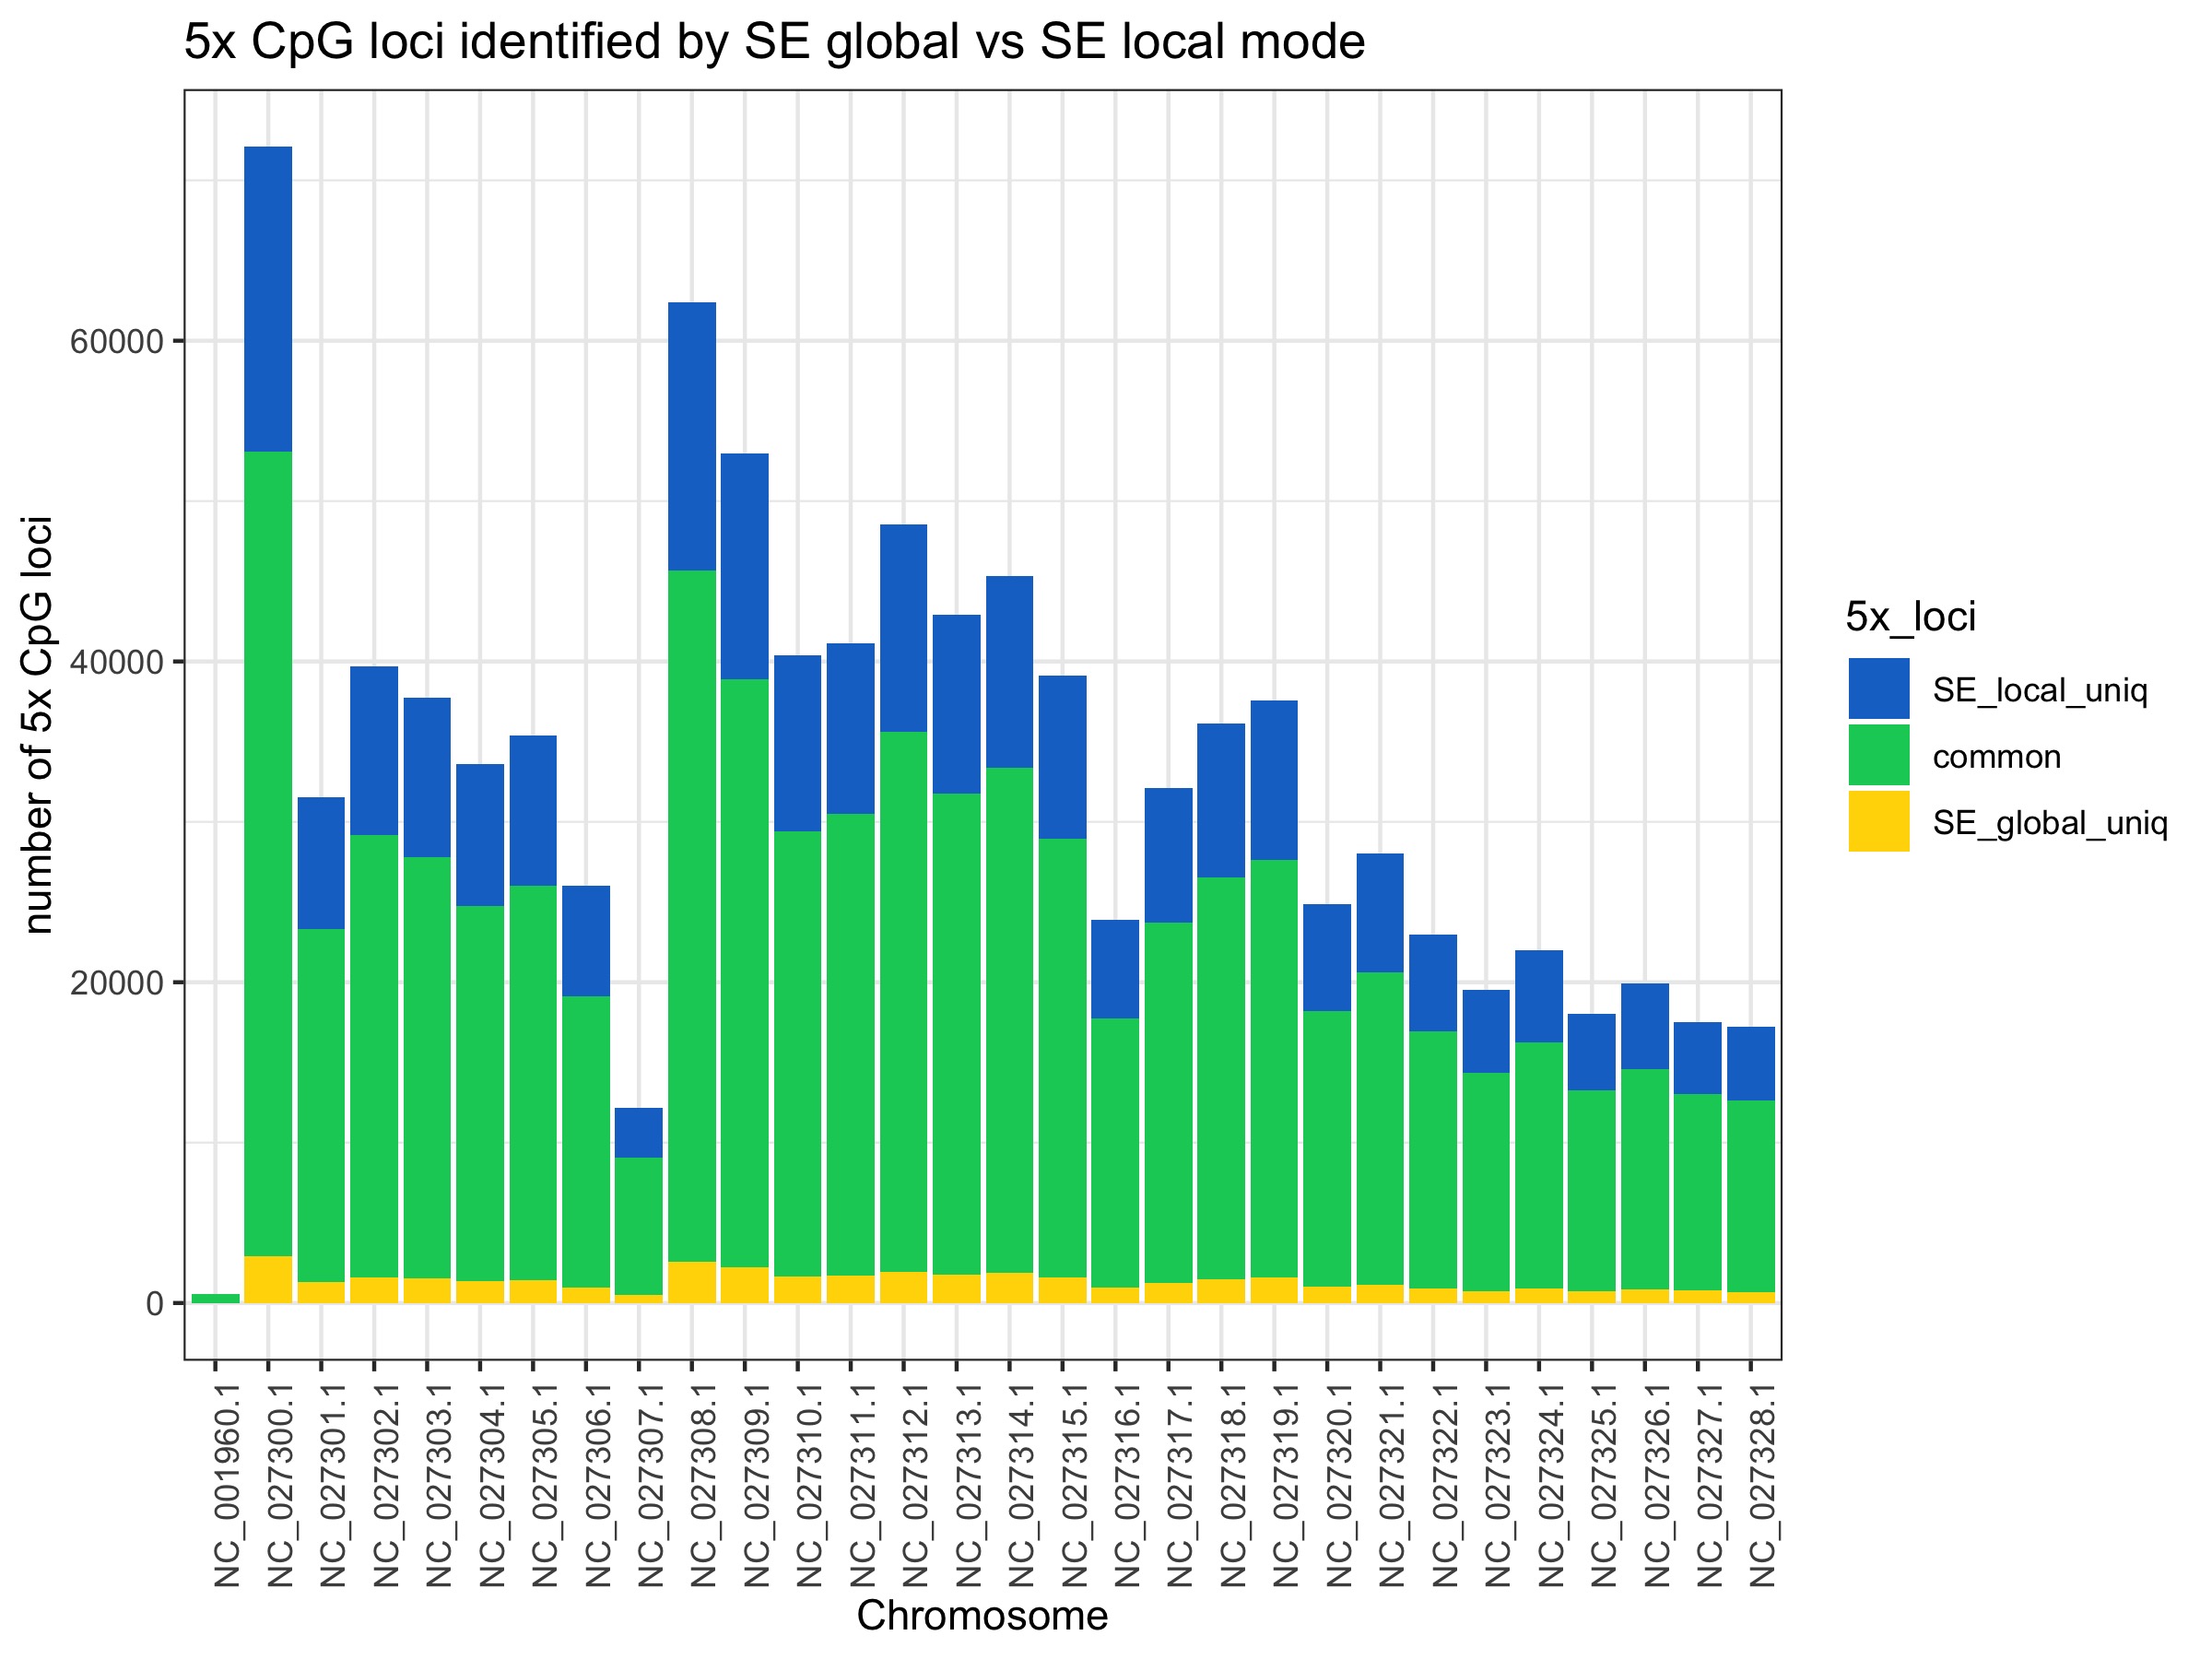
Most loci are commonly covered no matter what mode is used. There is not a substantial gain going from PE to SE global. There is also not a big difference between SE global to SE local. It looks like there are particular genome regions gain reads in local mode (NC_027300, NC_027308, and NC_027309) rather than it being an even distribution.
All plots below are from 20200424_BmrkCmpr.Rmd and were plotted in this google sheet:Bmrk_PEvSE_CmprBeds
The plots show the average number of CpG loci exclusively and commonly identified by PE, SE global, SE local. Averages were calculated from 4 individual samples.
Restricting to 5x CpG loci covered
These plots show substantial gain in 5x CpG loci covered by SE modes (~3-4 fold more)
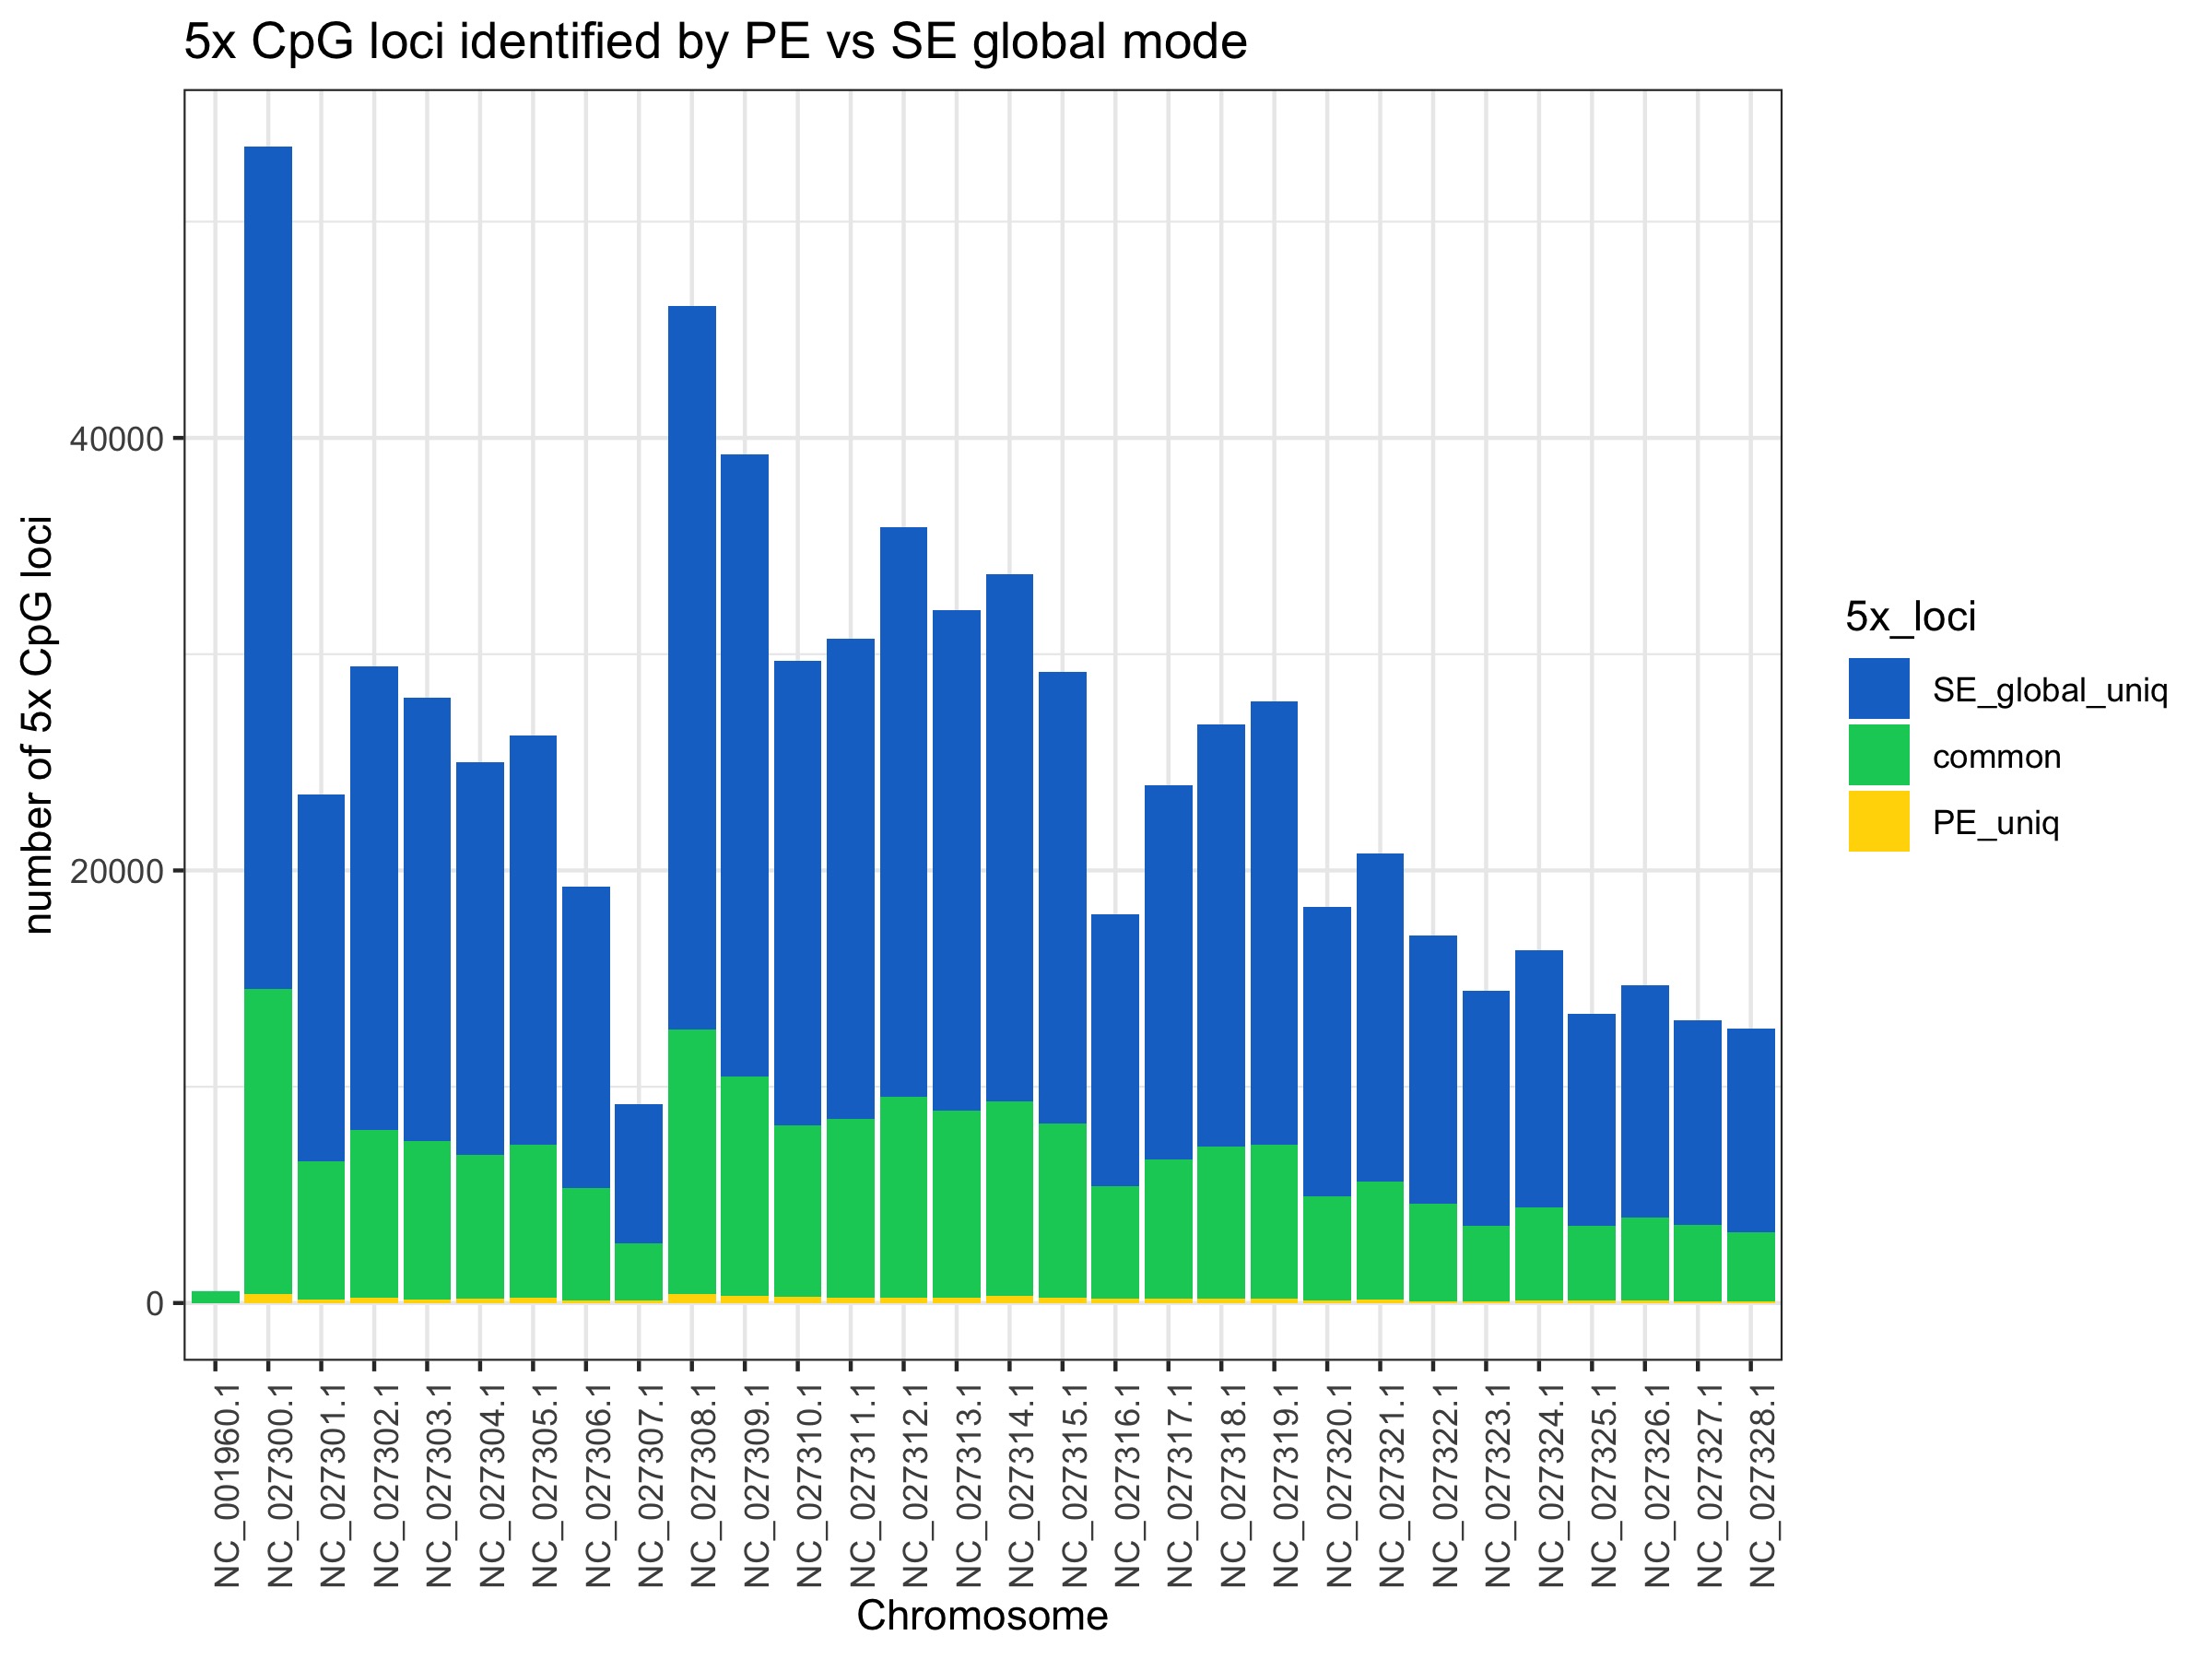
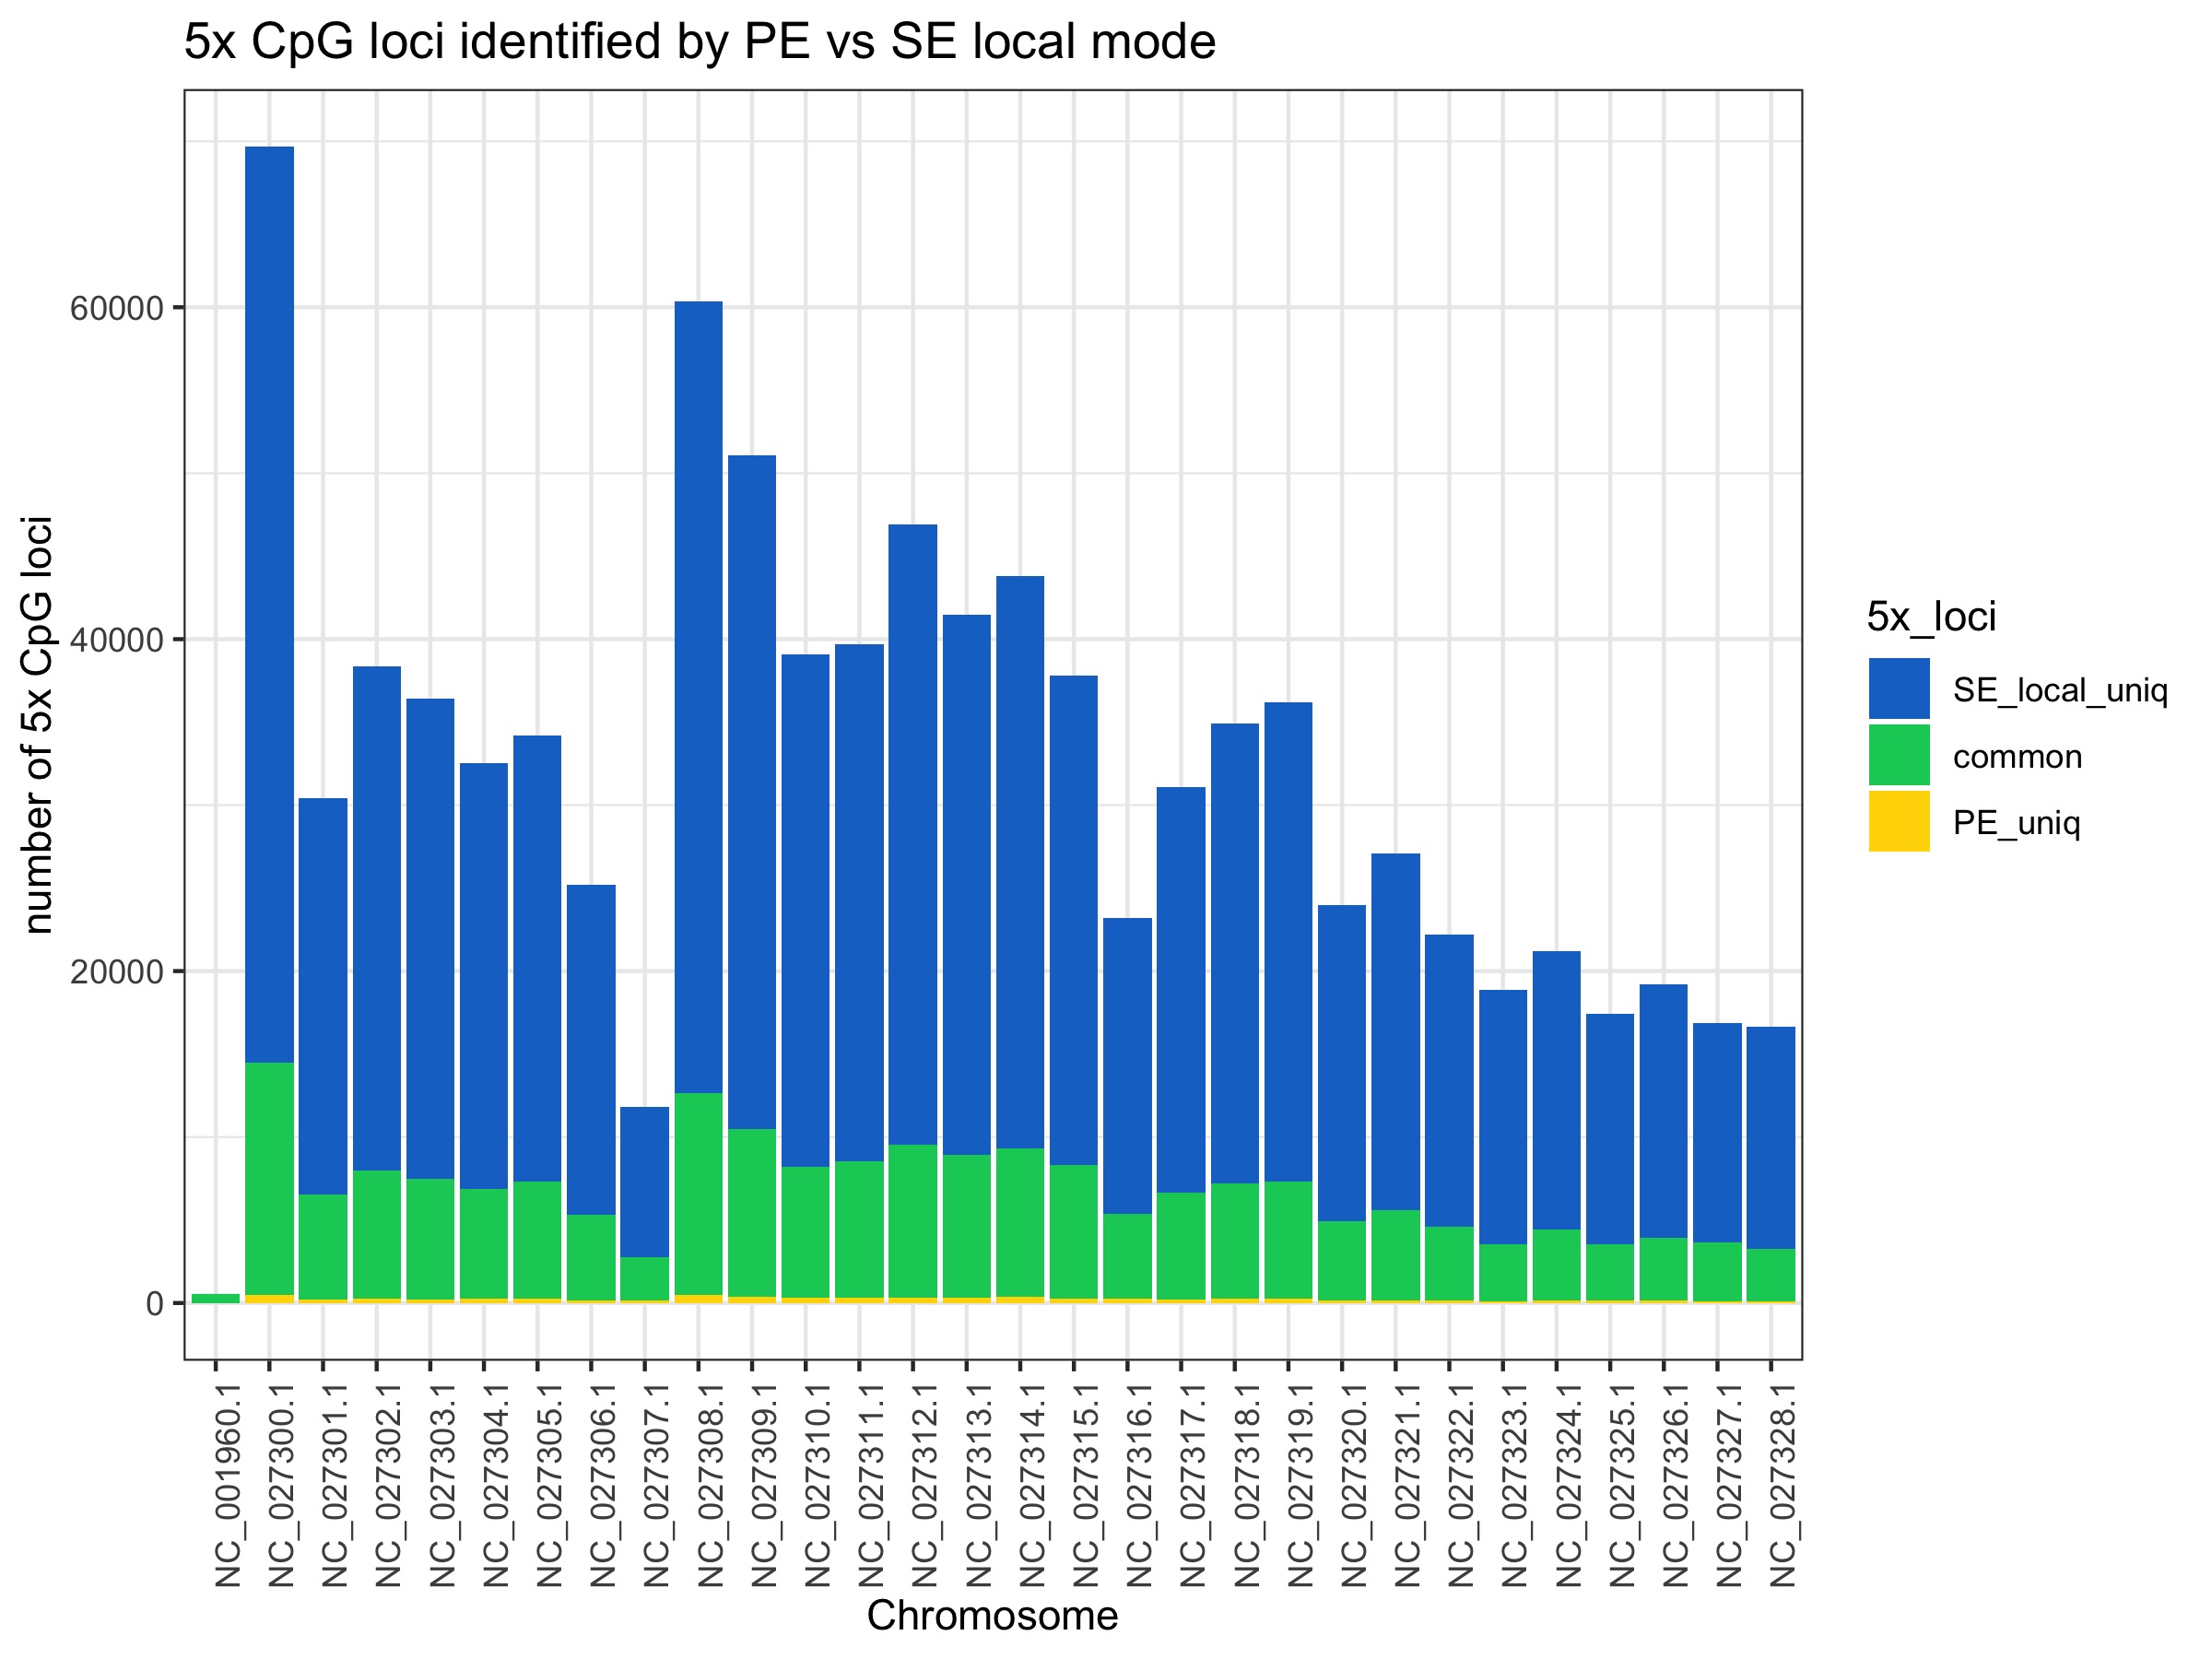
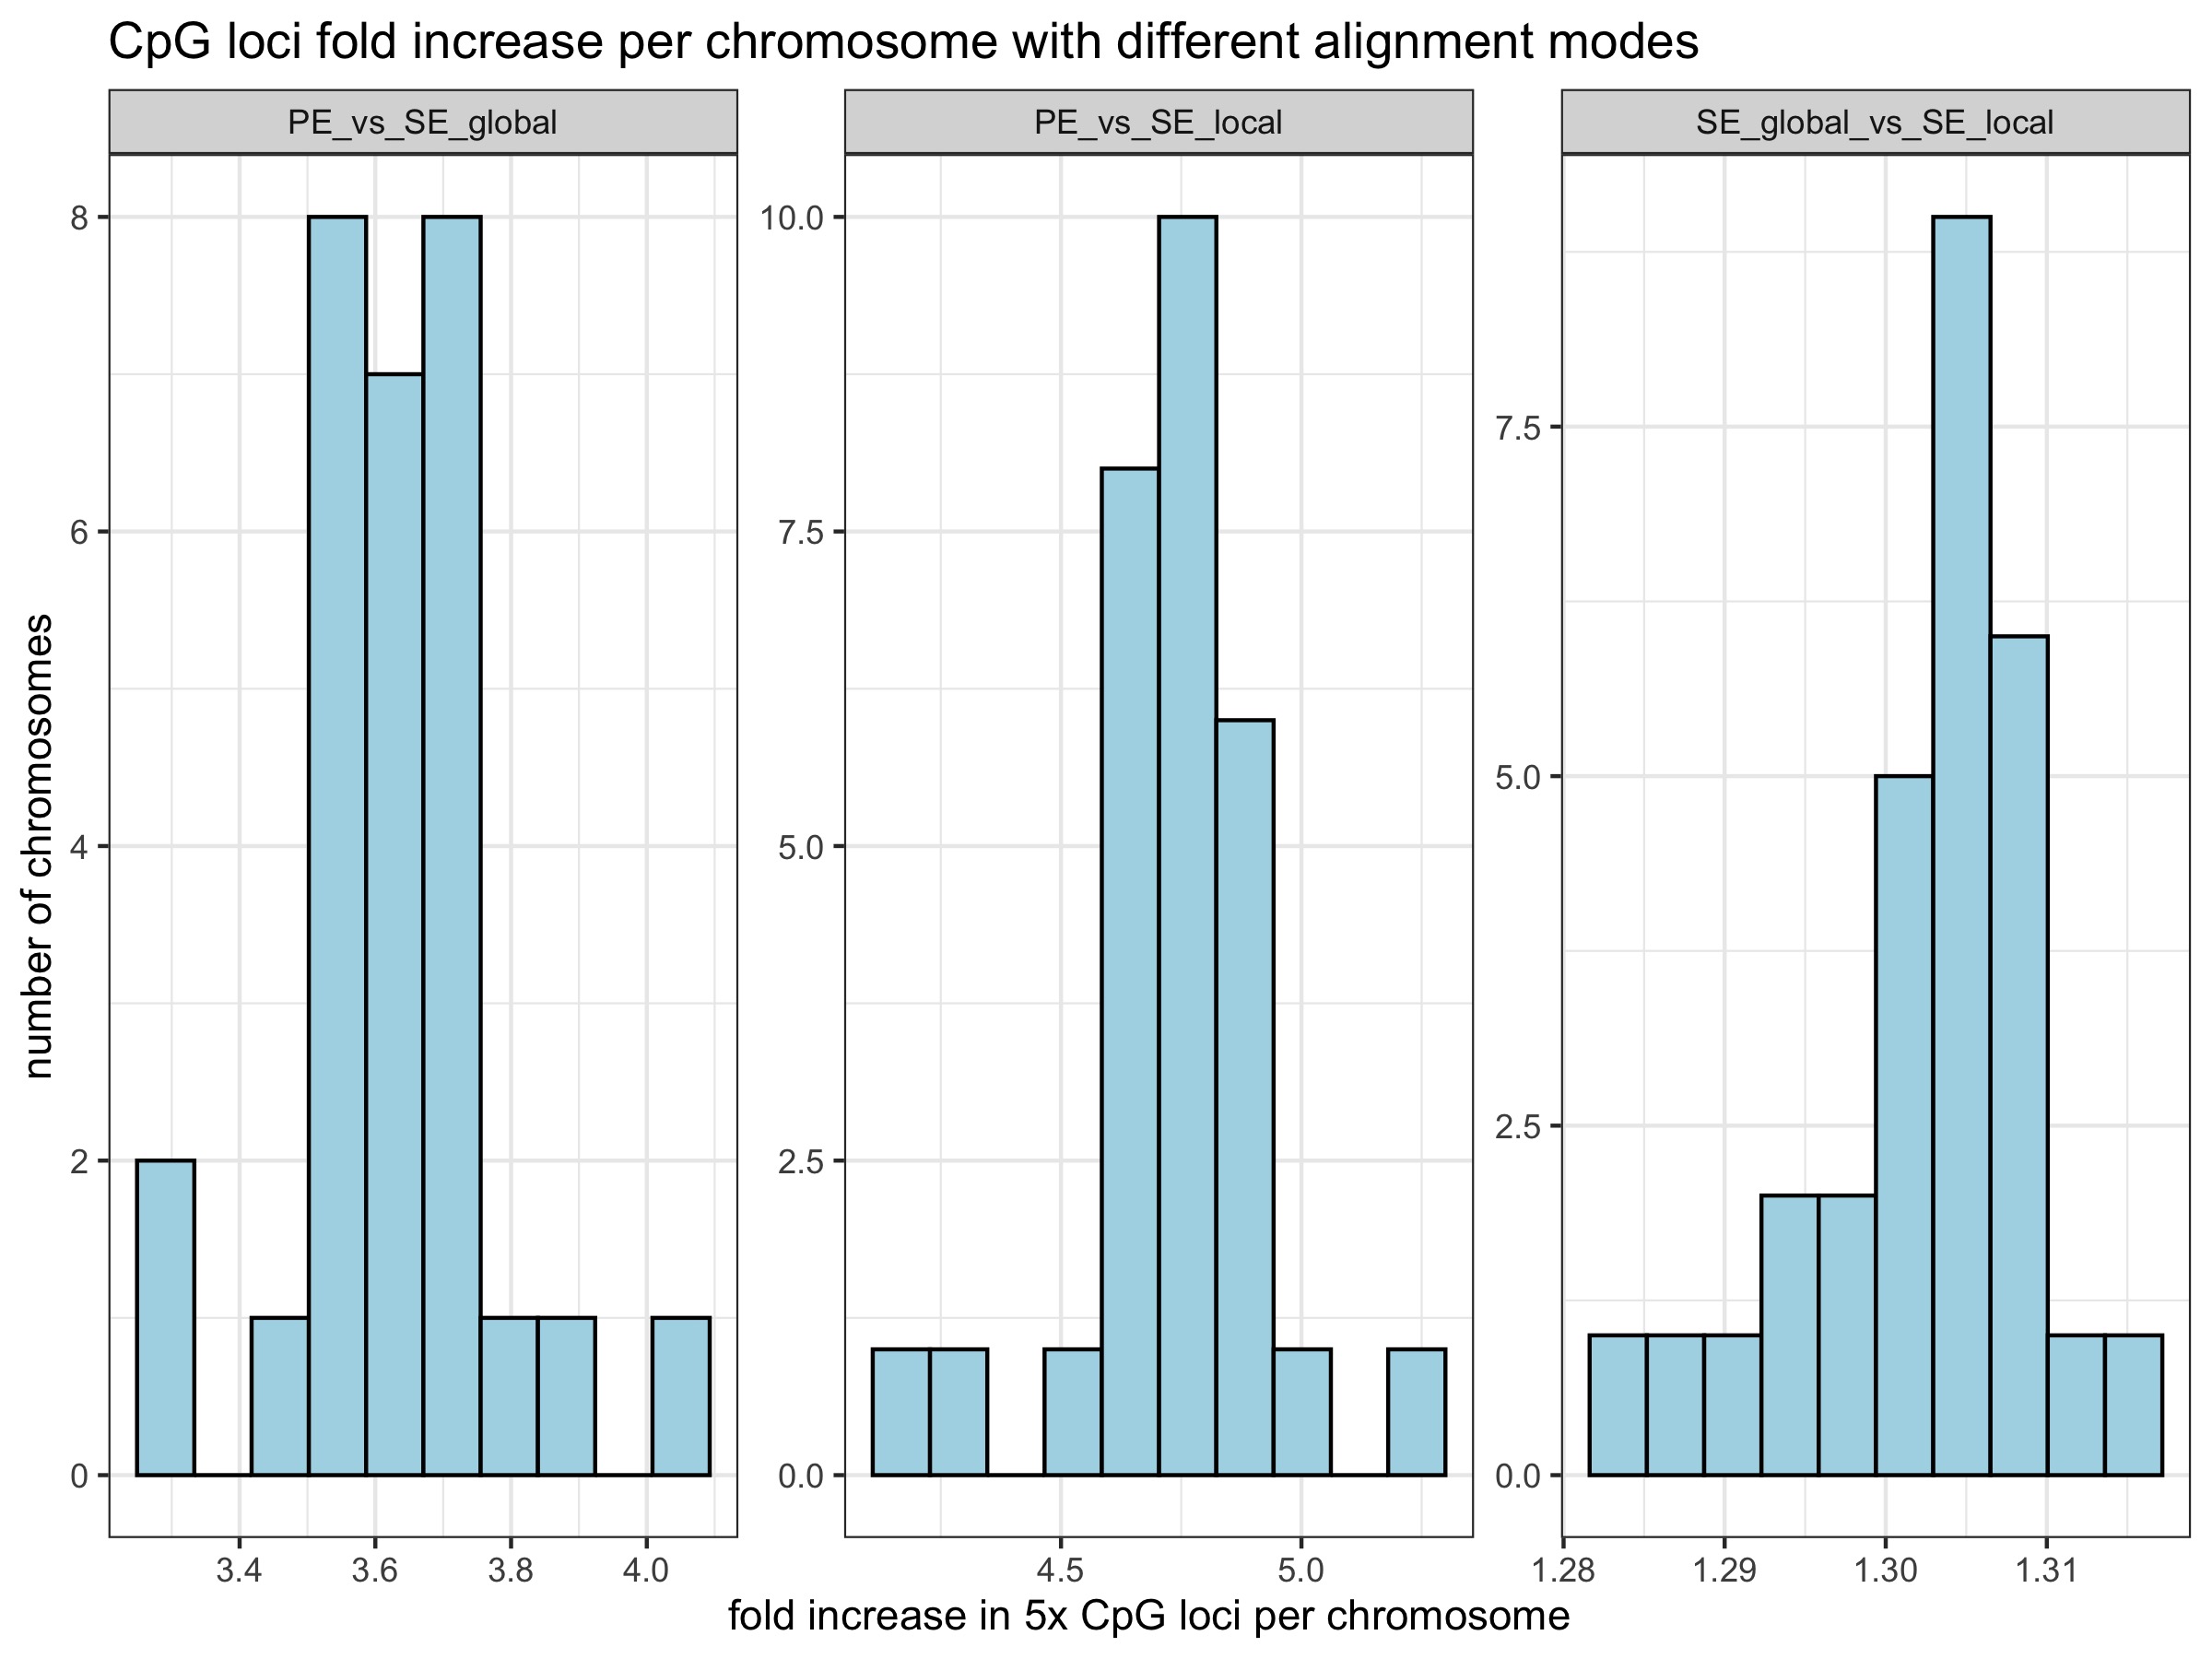
Is there a chromosomal bias?
No. Excluding the mitochondrial chromosome (NC_001960.1) which shows low coverage overall, chromosomes on average show:
- 3.63 +/- 0.14 (s.d.) fold increase in number of 5x CpG loci retained with SE global mode
- 4.73 +/- 0.20 (s.d.) fold increase in the number of 5x CpG loci retained with SE local mode
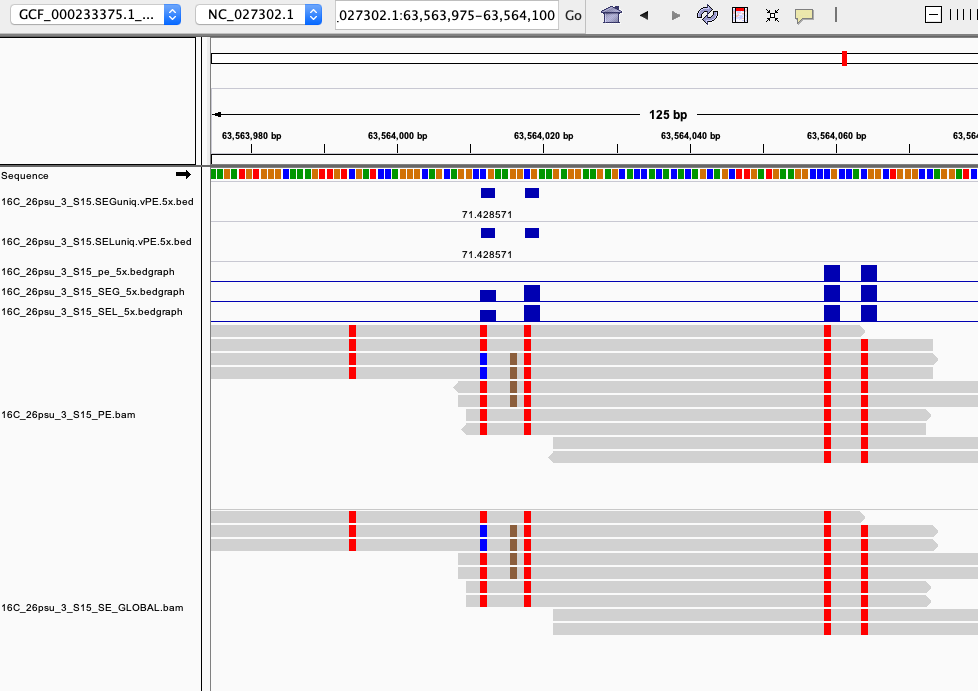
IGV
-
session file: https://raw.githubusercontent.com/shellywanamaker/Salmon_sealice/master/analyses/20200424_BmrkCmpr/20200424_BmrkCmpr.xml
-
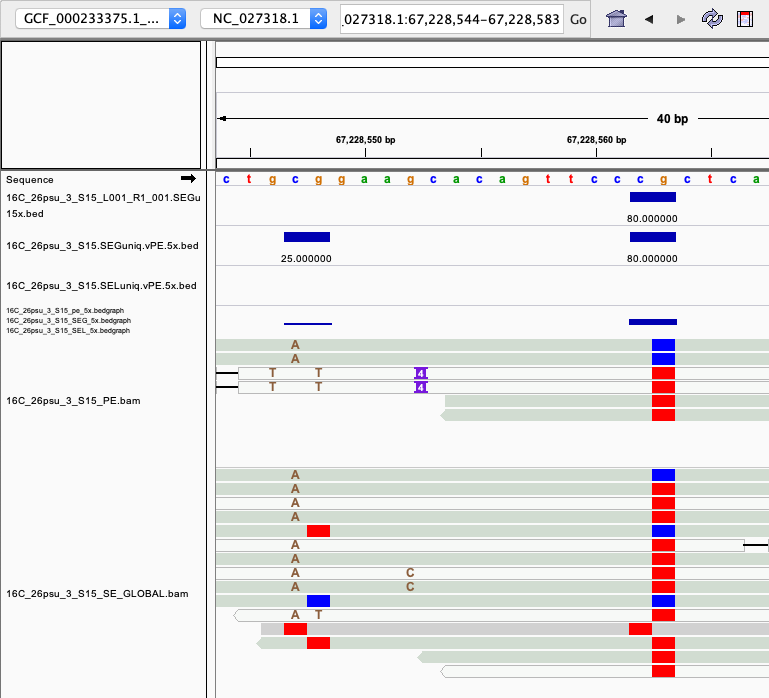
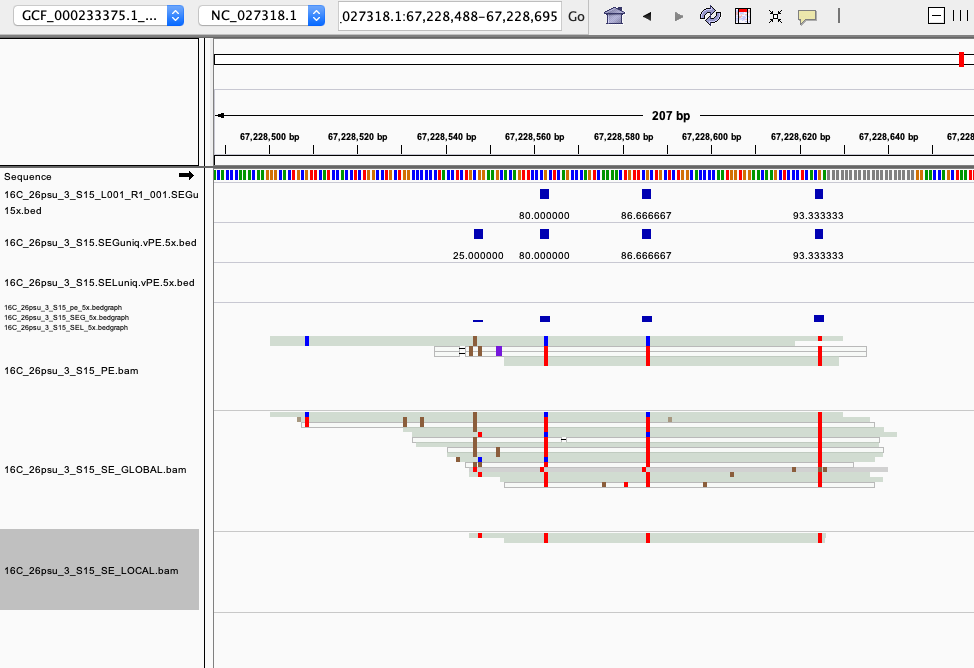
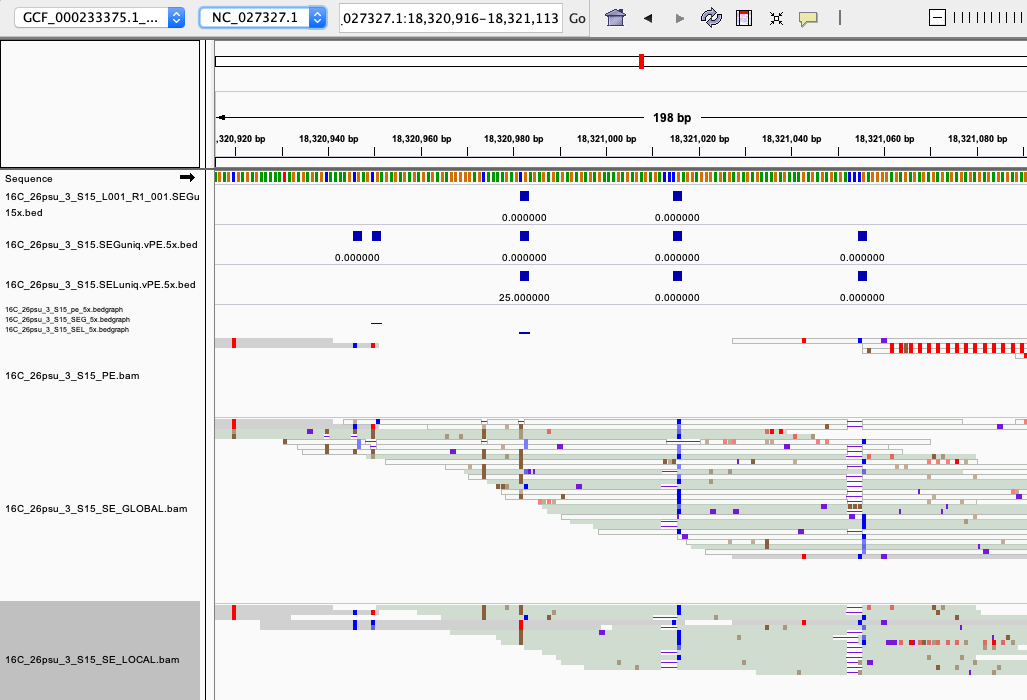
examples of loci gained from SE global and SE local vs. PE The 4 screenshots below show loci that are removed with 5x thresholding in PE mode. In SE mode, each read of a pair is counted, allowing these to pass.
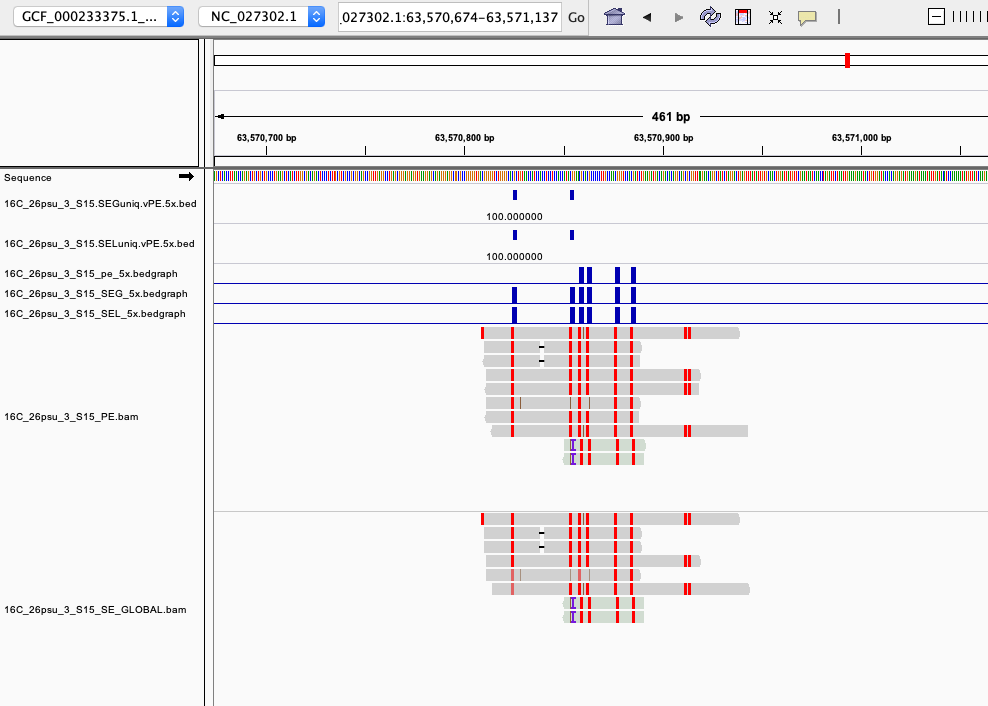
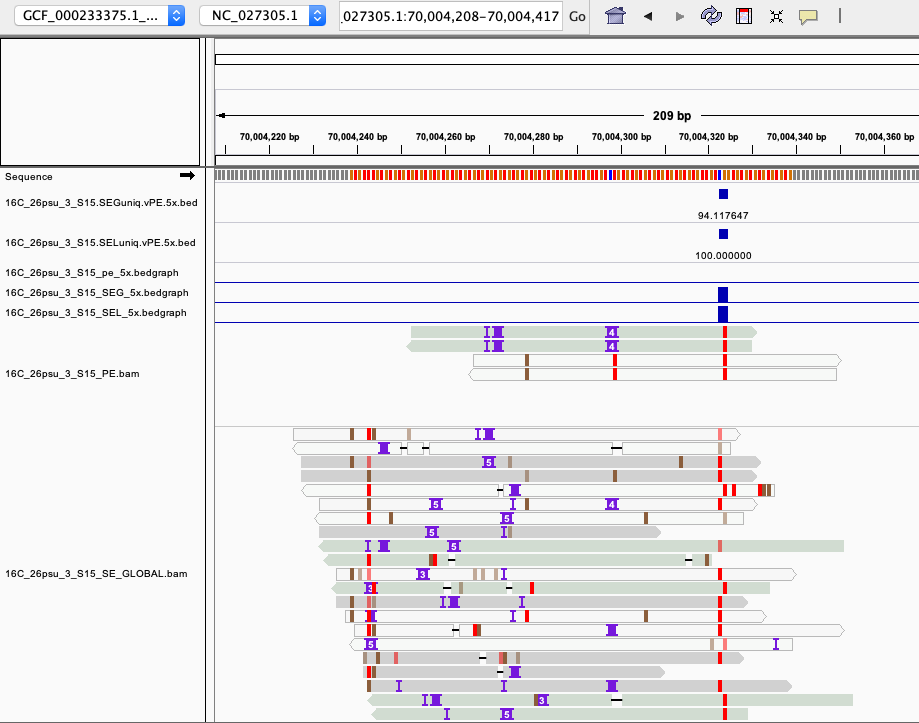
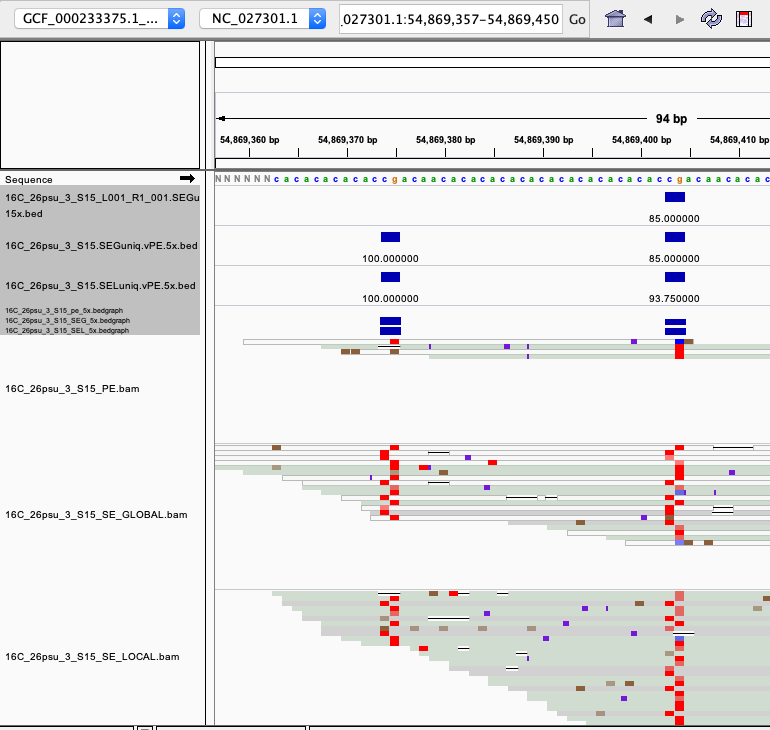
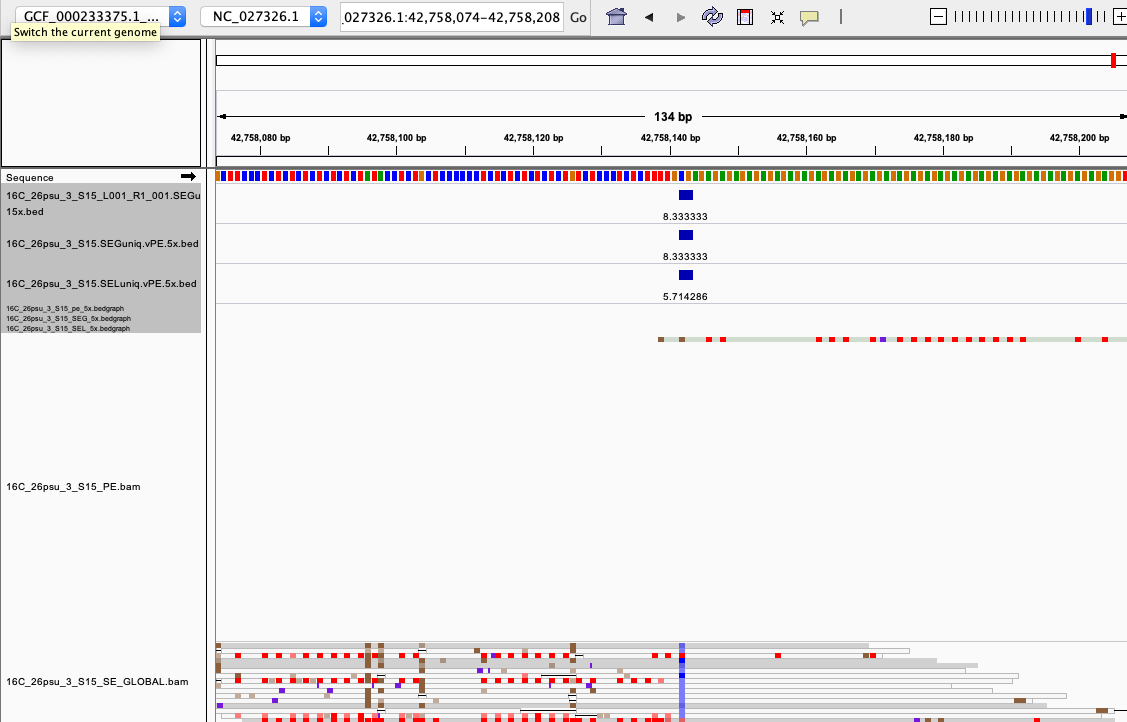
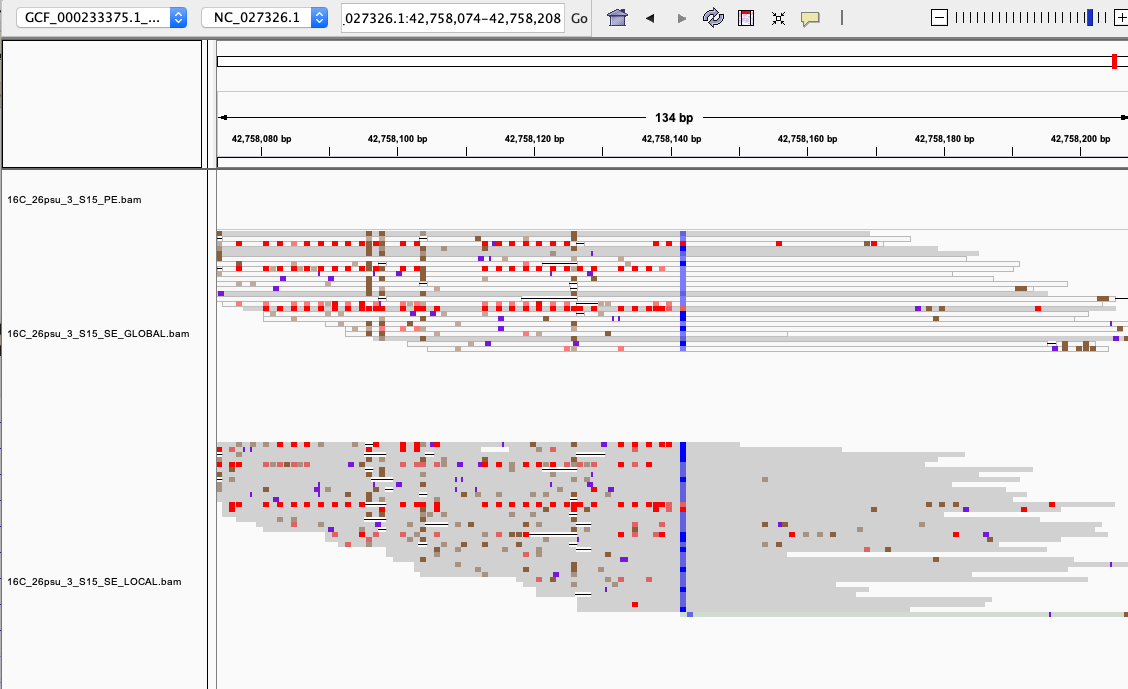
- more examples of loci gained from SE global and SE local vs. PE. These screenshots show regions where many more reads mapped in SE mode compared to PE mode. These also happen to be repetitive genome regions.
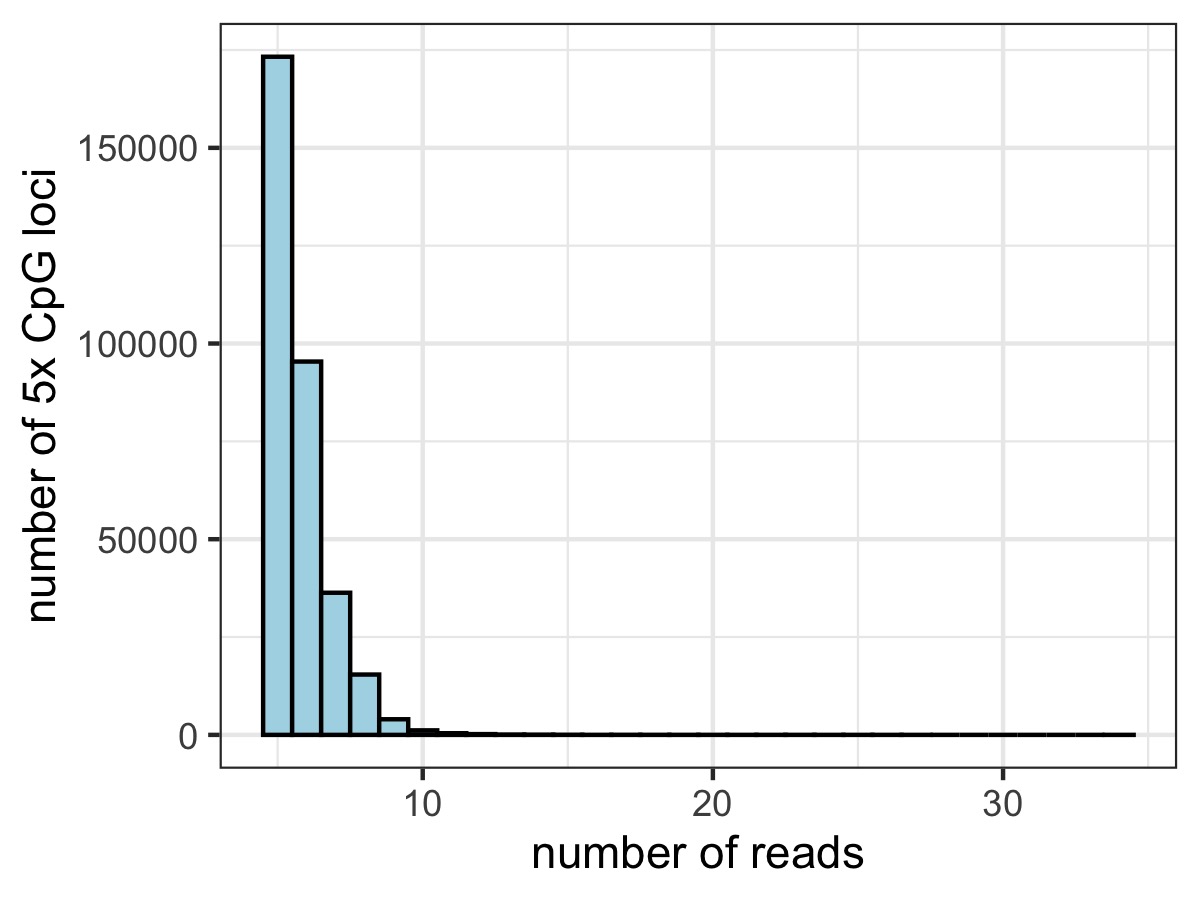
What is the spread of coverage of loci that are retained in SE global but not identified in PE?
Conclusions
In the end I’m sticking with PE and following the MethCompare pipeline because:
- While more 5x CpG loci are gained in SE mode relatively evenly across the genome, these loci are:
- low coverage (didn’t pass the 5x coverage threshold with PE reads)
- moderate coverage but mapped to repetitive regions and likely artificatual
- I’m not convinced the local alignments are good since the local alignment score thresholding is different and likely needs to be optimized. This is discussed in this thread: https://github.com/FelixKrueger/Bismark/issues/265
- in local mode: –score-min G,20,8
- in global mode: –score-min L,0,-0.6
- Steven has also mentioned that PE gives a read two anchor points to the genome as opposed to one which should be more accurate.
I think the MethCompare pipeline should be a good place to start and if the mapping is terrible maybe try adjusting mapping parameters or SE.