Evaluating CpG methylation in organisms with very low % methylation
This post is related to issues https://github.com/RobertsLab/resources/issues/940 and https://github.com/RobertsLab/resources/issues/947
From the RNAseq data from Cristian’s group showing expression of DNA methyl transfereses, we believe there is DNA methylation in sea lice. However, our WGBS data have shown that cytosine methylation is very low.
CpG methylation in WGBS Sea lice data
With the alignment score min set to L,0,-0.6, here’s the breakdown of cytosine methylation:
| Context | F1 | F2 |
|---|---|---|
| %mCpG | 1.1 | 1 |
| %mCHG | 1 | 0.8 |
| %mCHH | 1.4 | 1.5 |
In the past I had played around with different alignement score parameters on subsetted reads and here’s a report on how different score_mins affect cytosine methylation in different contexts SeaLiceBmrkAlignementScoreComparison.html.
I did the same alignment score analysis on subsetted salmon libraries that were prepped alongside the sea lice libraries with the same mastermix so I’d imagine the conversion rate would be the same across salmon and sea lice samples. Here’s the alignment score comparison report for the subsetted salmon data: BmrkAlignementScoreComparison.html
Here’s a summary of the reports:
| Sample | Context | L,0,-0.2 | L,0,-0.6 |
|---|---|---|---|
| sea lice | %mCpG | 1 | 1.4 |
| sea lice | %mCHG | 0.5 | 1.1 |
| sea lice | %mCHH | 1 | 1.5 |
| salmon | %mCpG | 78 | 77 |
| salmon | %mCHG | 0.7 | 1.5 |
| salmon | %mCHH | 1.3 | 4 |
CpG methylation in other insects
Low DNA methylation is also the case in other insects, for instance in honey bees. To handle this, there are pipelines developed for picking out the methylation signal above the noise. For example, in the paper Unique DNA Methylation Profiles Are Associated with cis-Variation in Honey Bees, they seem to call methylated Cs using two criteria:
- the C has sufficient coverage (as determined by BWASP which determines the minimal coverage necessary for a site to be significantly methylated, i think it’s this script
- the C is significantly methylated (also determined by BWASP, i think it’s this script):
- “Significantly methylated sites were then calculated using a binomial probability model, using the bisulfite conversion rate for each sample as the probability of success, and performing Bonferroni corrections at the 1% significance level using BWASP”
They end up only analyzing mCG that have ~95-100% methlyation (Table 1 and S6). They find a difference in the proportion of significantly methylated Cs in the CpG context compared to CHG and CHH context in high coverage (30x) samples, but but in low coverage (5x) samples they see a higher proportion of significantly methylated Cs in the CHH context than in CpG context. I created the table below from Table 1, S3, S4, and S6.
| Sample | Genome Coverage | Context | sig mC | sufficiently covered C | sig mC/sufficiently covered C (%) |
|---|---|---|---|---|---|
| HC | 30x | CpG | 125075 | 11619640 | 1.076410285 |
| HC | 30x | CHG | 135 | 5201156 | 0.002595576829 |
| HC | 30x | CHH | 1057 | 26137839 | 0.004043945638 |
| LC | 5x | CpG | 18975 | 10392122 | 0.1825902352 |
| LC | 5x | CHG | 510 | 4204854 | 0.01212883967 |
| LC | 5x | CHH | 60639 | 14353816 | 0.4224590868 |
Their main finding is that:
- DMGs are more likely to contain cis-SNPs than consistently methylated genes and that DNA methylation patterns are often associated with genotypic variation.
- Both their high and low coverage data support their finding, however they used genetically homogeneous samples.
- They warn that genetically heterogenous samples, small sample sizes and/or replicate numbers “risk unequal representation of alleles within pools” and can lead to erroneous conclusions “that two pools are differentially methylated as a result of experimental manipulation, whereas in reality the impression of differential methylation is a consequence of genomic variation in samples (Libbrecht et al. 2016), which we show here can lead to sequence-specific methylation.”
How to Evaluate CpG methylation in Sea Lice
To effectively evaluate CpG methylation in sea lice, one possibility is to run the BWASP pipeline and see if we also see a difference in the proportion of significant mCpG/CpGs with sufficient coverage. However, we would need to re-do library preps with lambda and resequence to know what our conversion efficiency is.
Since the existing WGBS data we have did not include a lambda control for conversion efficiency, we cannot run the BWASP pipeline on it. BUT, I wondered if we might see a difference in mCpG proportion and mCHH proportion from considering >= 95% methylated cytosines as significant. In other words the question is:
- If only considering highly methylated cytosines (>= 95%), does the CpG context show a higher ratio of methylated cytosines:unmethylated cytosines?
Analysis
STEP 1. Generate reports with cytosines in all contexts listed (specify –CX in bismark_methylation_extractor). The bismark default is to output only CpG context. The –comprehensive option can be used to eliminate files coming from each of the 4 possible strands and just output one.
#!/bin/bash
## Job Name
#SBATCH --job-name=BmrkBed_Calig
## Allocation Definition
#SBATCH --account=srlab
#SBATCH --partition=srlab
## Resources
## Nodes
#SBATCH --nodes=1
## Walltime (days-hours:minutes:seconds format)
#SBATCH --time=5-23:30:00
## Memory per node
#SBATCH --mem=500G
##turn on e-mail notification
#SBATCH --mail-type=ALL
#SBATCH --mail-user=strigg@uw.edu
## Specify the working directory for this job
#SBATCH --chdir=/gscratch/scrubbed/strigg/analyses/20200529

%%bash

#record each command that is called in slurm file

set -ex

#add paths to programs to bash profile

source /gscratch/srlab/strigg/bin/paths.sh

#print the path of the programs

which samtools
which bowtie2
which bismark

genome_folder="/gscratch/srlab/strigg/data/Caligus/GENOMES"


#run methylation extractor
bismark_methylation_extractor \
--paired-end \
--gzip \
--bedGraph \
--CX \
--counts \
--comprehensive \
--scaffolds \
--multicore 14 \
--buffer_size 75% \
*.deduplicated.bam

#generate cytosine reports
find *.deduplicated.bismark.cov.gz |\
xargs basename -s .deduplicated.bismark.cov.gz |\
xargs -I{} coverage2cytosine \
--genome_folder ${genome_folder} \
-o {} \
--CX \
--zero_based \
{}.deduplicated.bismark.cov.gz
Scripts:
Slurm file:
Output: https://gannet.fish.washington.edu/metacarcinus/Salmo_Calig/analyses/20200529/
STEP 2. Count the number of cytosines in different contexts
I determined that both .deduplicated.bismark.cov.gz and deduplicated.txt.gz files yield that exact same counts that are reported in the Bismark Methylation Extractor splitting reports. But cytosine report files (e.g. _report.txt) do not give the same counts. For some reason, there are slightly more total reads (~50K reads) in these files. So I decided to go with deduplicated.txt.gz files as input.
Additionally, I decided to also use methylation for thresholding in addition to read coverage to see if that reveal a difference in the number of m:um loci from each context.
Consolidated Code:
- Calig_threshCytoCounts_consolidated_code.sh
- this code is a combination of 20200601_Calig_CytoCounts3.sh, 20200602_Calig_threshCytoCounts.sh, and 20200602_Calig_threshCytoCounts2.sh which are detailed below.
Scripts:
- 20200530_CytosineCounts.sh:
- splits loci by context
- input files: .CX_report.txt
- output files: .CN_report.txt (where N is G, GH, or HH)
- counts the number of unique methylated and all (meth + unmeth) cytosines from file at different coverage thresholds. *NOTE: Does not count the total number of meth and unmeth Cs, only the number of unique loci.
- input files: .CN_report.txt
- output in slurm file
- slurm file: slurm-2667042.out
- splits loci by context
- 20200601_Calig_CytoCounts.sh: counts the total number of methylated and unmethylated cytosines.
- input files: .CN_report.txt
- output in slurm file
- slurm file: slurm-2672306.out
- 20200601_Calig_CytoCounts2.sh: counts the total number of methylated and unmethylated cytosines with 1x coverage in each context (x = umCpG; X = mCpG; z = umCHG; Z = mCHG; h = umCHH; H = mCHH; see Bismark_User_Guide.html)
- input files: _bismark_bt2_pe.deduplicated.txt.gz
- output in slurm file
- slurm file: slurm-2674598.out
- 20200601_Calig_CytoCounts3.sh:
- creates files for each cytosine context with the number of reads, chrm, start, context (x = umCpG; X = mCpG; z = umCHG; Z = mCHG; h = umCHH; H = mCHH)
- counts the total number of methylated and unmethylated cytosines in each context thresholded at different coverages (1x, 2x, 5x, 7x, 10x, 15x, and 20x)
- input files: _bismark_bt2_pe.deduplicated.txt.gz
- output files: _BME_mCall_counts.txt.gz
- slurm file: slurm-2676794.out
- 20200602_Calig_threshCytoCounts.sh:
- creates files that contain loci that pass different %methylation thresholds (25%, 50%, 75%, and 95%)
- input files: deduplicated.bismark.cov.gz
- output files: deduplicated.bismark.cov.me##.txt
- slurm file: slurm-2677405.out:
- 20200602_Calig_threshCytoCounts2.sh:
- counts the total methylated and unmethylated cytosines in each context at different read coverage and different % methylation thresholds
- input files: _BME_mCall_counts.txt.gz
- output in slurm file
- slurm file: slurm-2680039.out
Output data:
- output data was extracted from slurm-2676794.out and slurm-2680039.out using the following code:
cat slurm-2676794.out|awk -F"\t" '{if($1!~/\+/)print $0}'

cat slurm-2680039.out|awk -F"\t" '{if($1!~/\+/)print $0}'
- then copied and pasted into this google sheet: SeaLice_cyto_context_cov_depth
- percent data from the tab ‘deduplicated.txt.gz_perc’ was downloaded and saved here: cyto_context_perc.csv
- counts data from the tab ‘deduplicated.txt.gz_counts’ was downloaded and saved here: cyto_context_coverage.csv
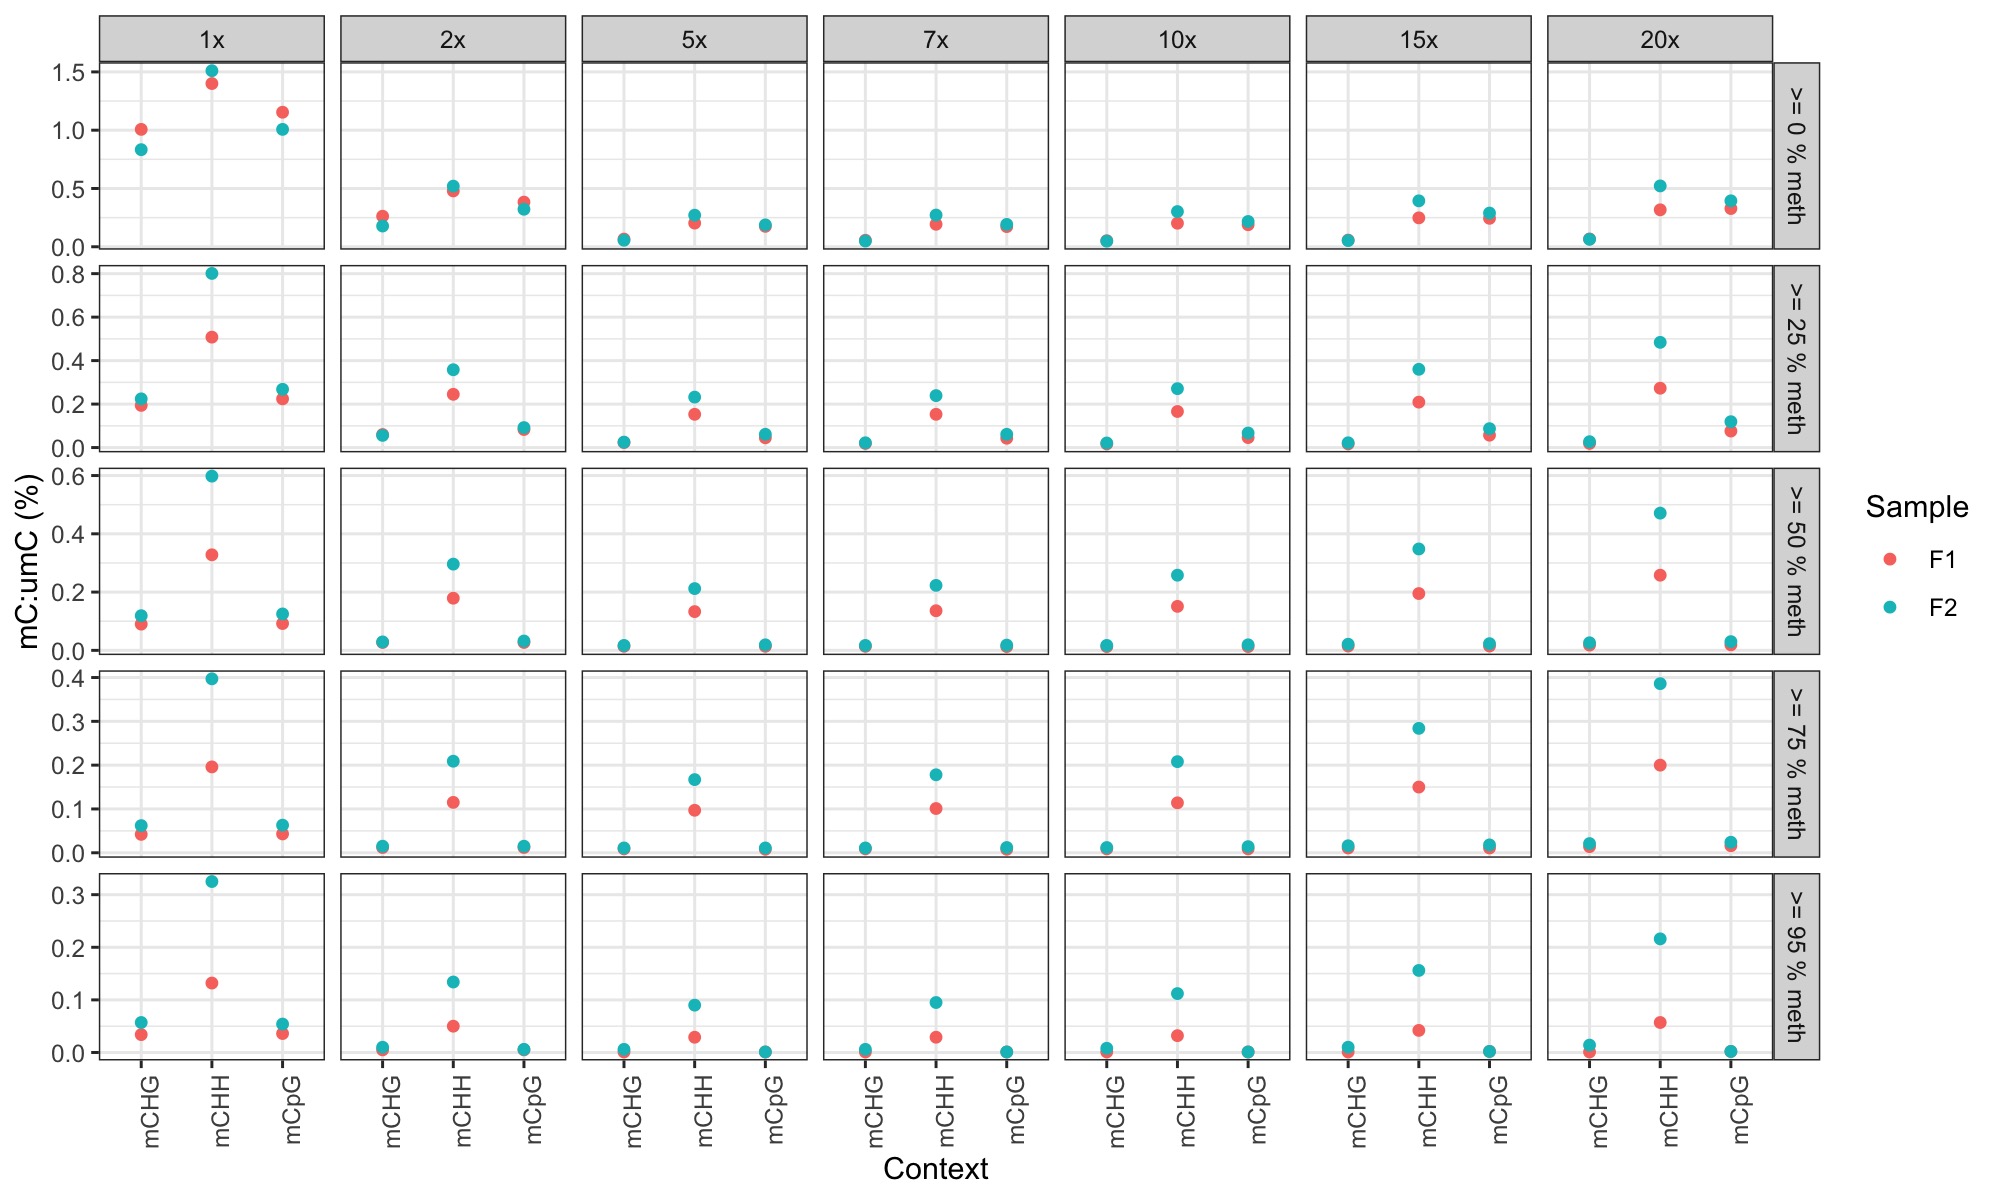
STEP 3. Plot % methylation for each context at different coverage requirements and at different % methylation requirements
-
used this R markdown script Cyto_context_analysis.Rmd to generate the following plots:
-
plots are facetted by read depth (horizontal) and by % methylation (vertical).
Conclusions
- I was expecting CHH and CHG methylation to show a lower mC:umC ratio at higher coverage and higher % methylation threshold (under the assumption that far fewer CHH and CHG loci would show >=95% methylation at high coverage based on 30x coverage observations in the bee paper).
- CHH methylation is still always higher than CpG methylation no matter what the thresholds in this case
- This could be:
- an artifact of low coverage; the 5x coverage data in the bee paper also showed this
- it could just be the way that methylation is (or is not) in sea lice.
Moving forward
- We would need more coverage (e.g. 30X genome) to accurately assess mC:umC proportions
- This means we’d need to use a full sequencing run to sequence one invidiual because we’d also want to spike in lambda DNA during the BS library prep to better estimate conversion efficiency
- Even after getting more coverage, it’s still not certain that we’ll see a difference in mC:umC proportions for cytosines in different contexts or that conversion efficiency will be greater than the umC proportions
- We decided to not do anymore WGBS with sea lice at this point
- In the future, it would be great if MBD could be used, but it’s uncertain how efficient this would work for organisms with very low methylation. So far, I haven’t found any papers exploring this.