This post is a follow-up to this post
Create UTR tracks
Exons should contain 5’ and 3’ UTR and CDS should not contain these. So bedtools subtract should give the UTR.
But the following code gave no output:
(base) ostrich:Desktop strigg$ /Users/Shared/bioinformatics/bedtools2/bin/subtractBed -a /Volumes/web/metacarcinus/Pgenerosa/GENOMES/feature_tracks/Panopea-generosa-v1.0.a4.exon.gff3 -b /Volumes/web/metacarcinus/Pgenerosa/GENOMES/feature_tracks/Panopea-generosa-v1.0.a4.CDS.gff3 | head
This suggests that the exon and CDS tracks are identical
Maybe the gene track contains UTR, and if I subtract the intron and CDS regions from it I should get the UTR.
Again, the following code gave no output:
(base) ostrich:Desktop strigg$ cat /Volumes/web/metacarcinus/Pgenerosa/GENOMES/feature_tracks/Panopea-generosa-v1.0.a4.CDS.gff3 /Volumes/web/metacarcinus/Pgenerosa/GENOMES/feature_tracks/Panopea-generosa-v1.0.a4.intron.gff3 | /Users/Shared/bioinformatics/bedtools2/bin/sortBed -i - |/Users/Shared/bioinformatics/bedtools2/bin/mergeBed -i - | head
Scaffold_01	1	4719
Scaffold_01	19807	36739
Scaffold_01	49247	52578
Scaffold_01	55791	67546
Scaffold_01	67585	69113
Scaffold_01	70712	81099
Scaffold_01	183685	186073
Scaffold_01	187327	188353
Scaffold_01	189848	190460
Scaffold_01	191068	191410
(base) ostrich:Desktop strigg$ cat /Volumes/web/metacarcinus/Pgenerosa/GENOMES/feature_tracks/Panopea-generosa-v1.0.a4.CDS.gff3 /Volumes/web/metacarcinus/Pgenerosa/GENOMES/feature_tracks/Panopea-generosa-v1.0.a4.intron.gff3 | /Users/Shared/bioinformatics/bedtools2/bin/sortBed -i - |/Users/Shared/bioinformatics/bedtools2/bin/mergeBed -i - | /Users/Shared/bioinformatics/bedtools2/bin/subtractBed -a /Volumes/web/metacarcinus/Pgenerosa/GENOMES/feature_tracks/Panopea-generosa-v1.0.a4.gene.gff3 -b - | head
This suggests the UTR are not included in the gene sequence either
5’ UTR are likely included in my promoter track. 5’ UTR in humans are typically 200bp. 3’ UTR in humans is on average 800bp.
I’m going to create a 3’ UTR track using bedtools flank like I did for the promoter sequence. 3’ UTR and regulation by John Hesketh, 2005 mentions that 3’ UTR are typically between 60-4000bp so I’ll extract 2000pb downstream genes.
Scripts
- https://github.com/shellywanamaker/Shelly_Pgenerosa/blob/master/analyses/20200406_Create_UTR_tracks.ipynb: Jupyter notebook that performs:
- the tests mentioned above
- makes putative promoter (1000bp upstream gene TSS) and 3’UTR tracks (2000bp downstream gene stop codon)
- combines feature gffs into one bed file and bins features into 2kb bins (bedtools windowmaker)
- matches up DMRs to binned genomic features (bedtools intersect)
- defines background regions
- matches CpGs with coverage in all groups and at least 3/4 individuals per group (.3xCpG.allgrps.bed files generated here) with binned genomic features using bedtools intersect
- matches up DMRs to genomic features that aren’t binned (bedtools intersect) for testing if different results come from DMRs matched to binned genomic features versus not binned
- DMR_stats_and_anno.Rmd: R markdown that performs:
- Filter methylated regions for regions that have coverage in 75% of samples per group
- Run group statistics on regions to find regions that are significantly different among groups
- Genomic Feature Analysis
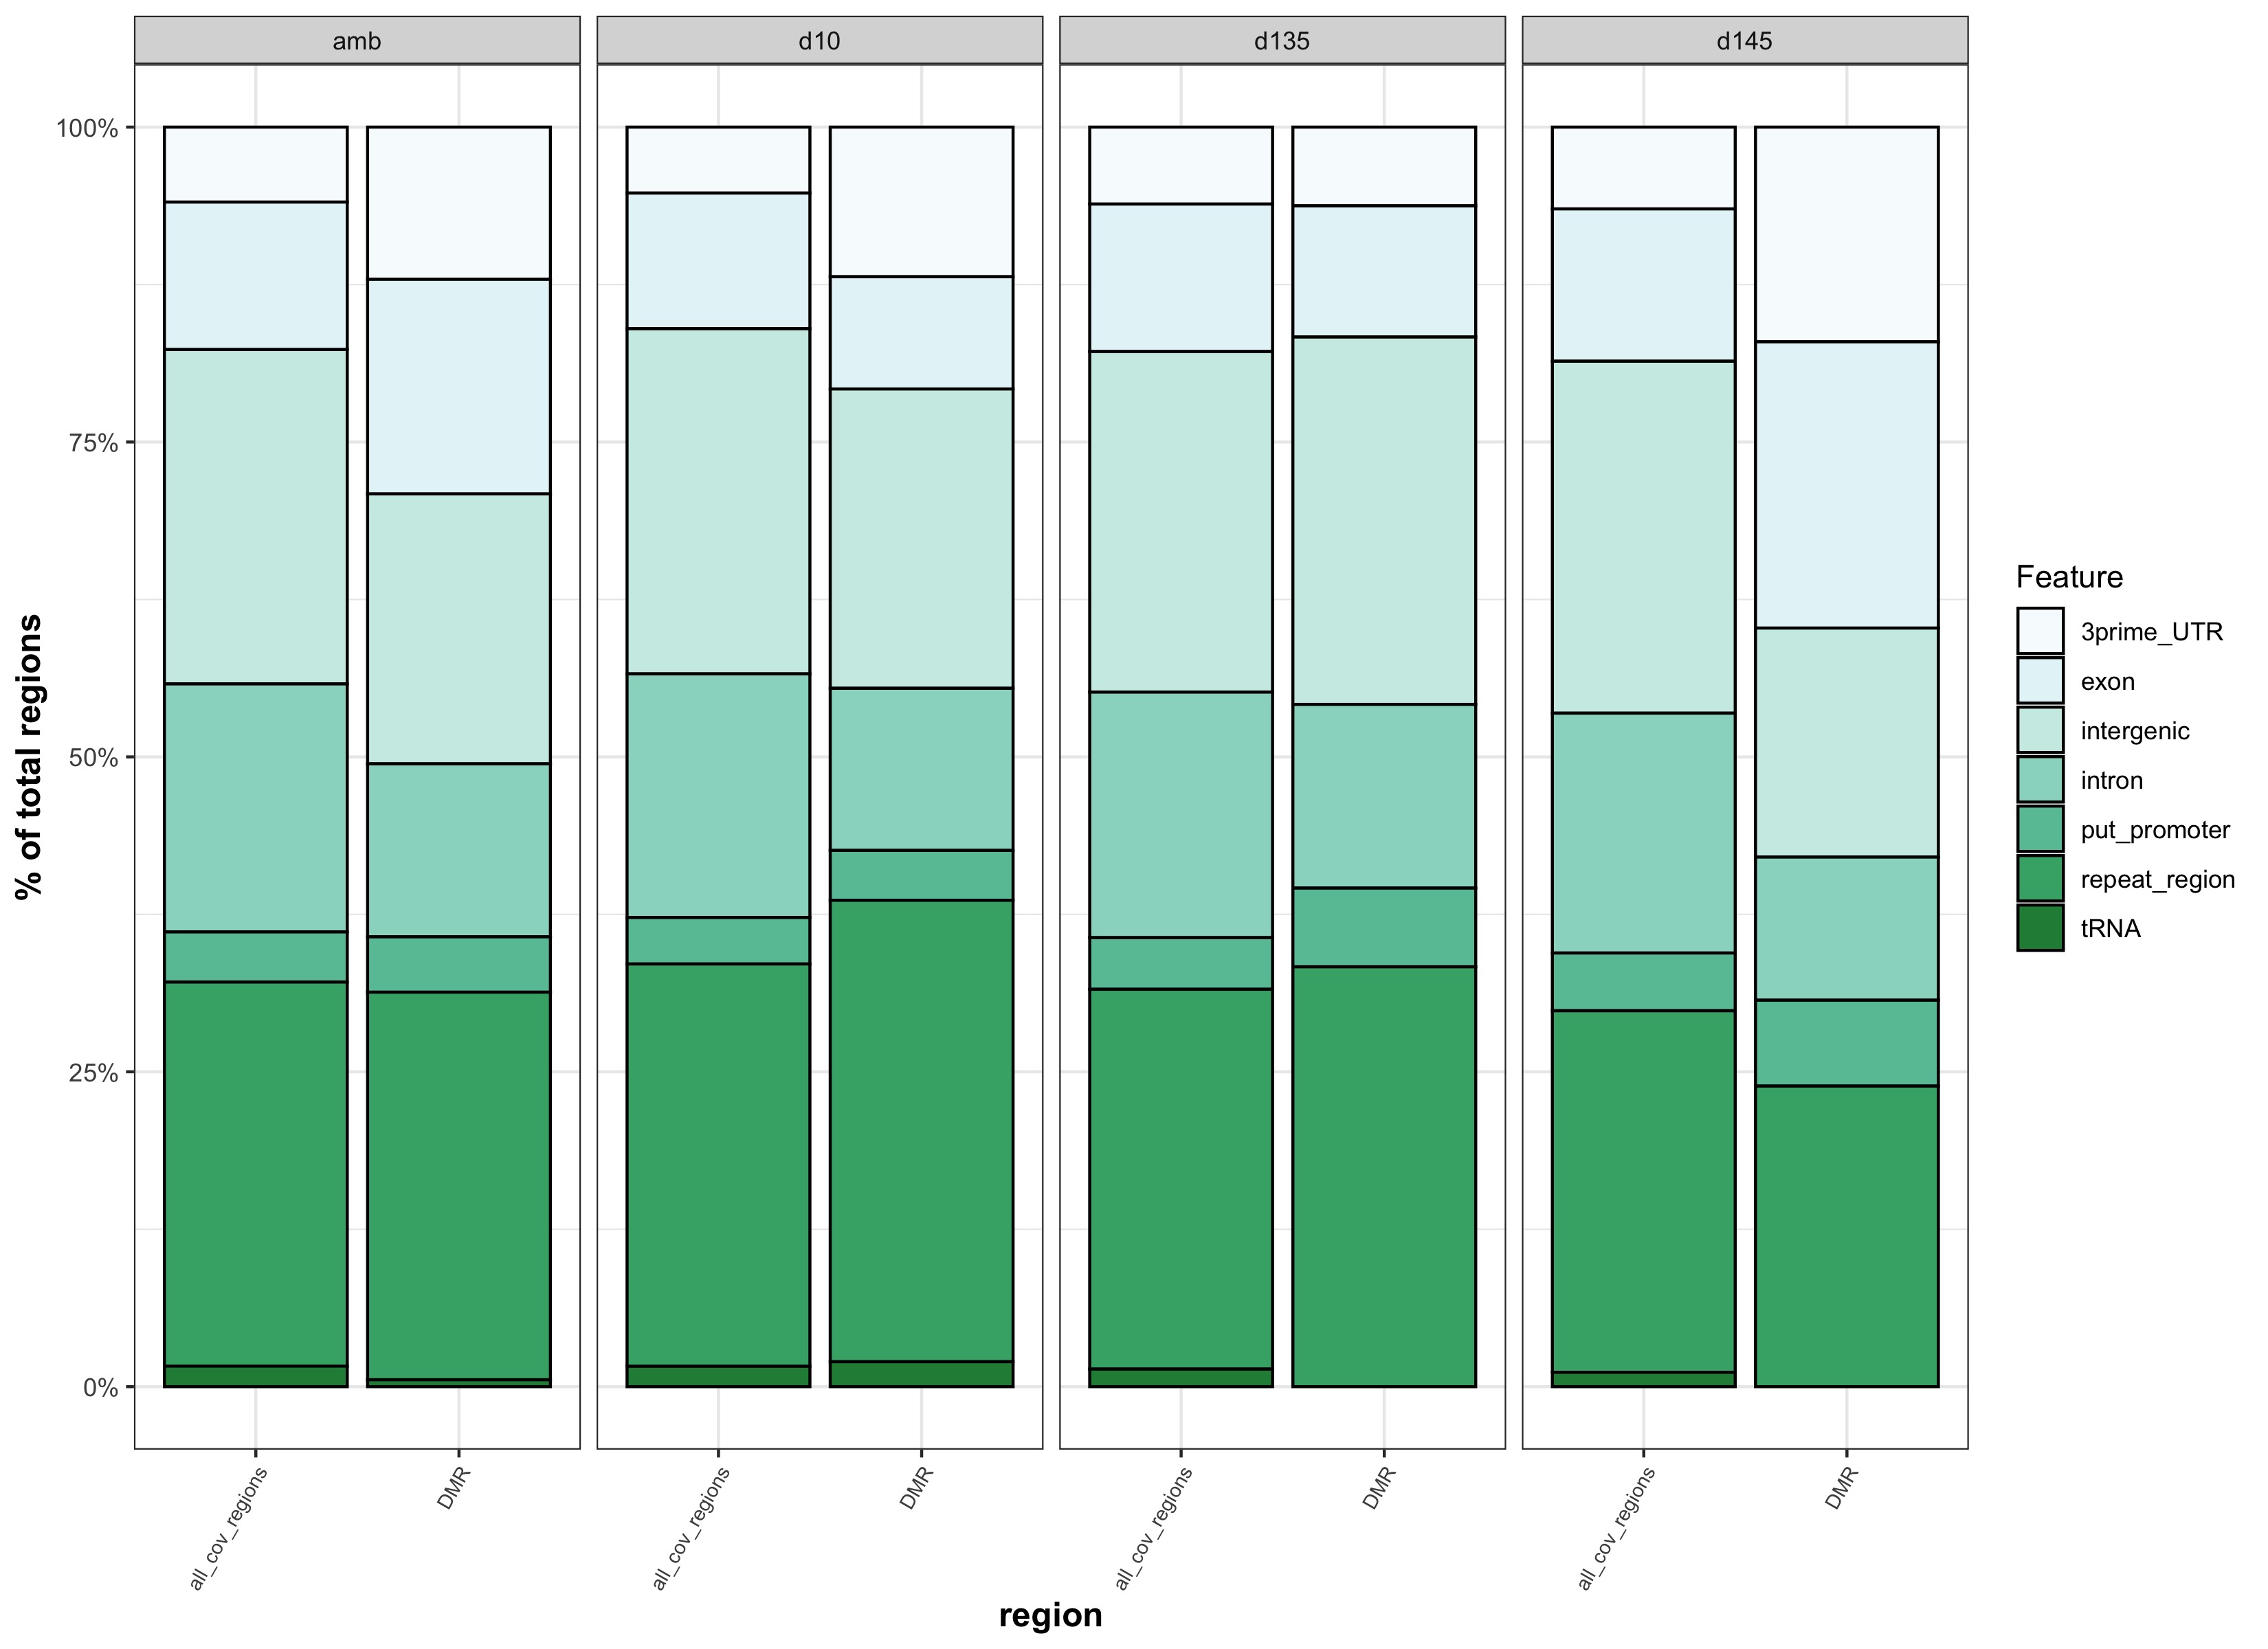
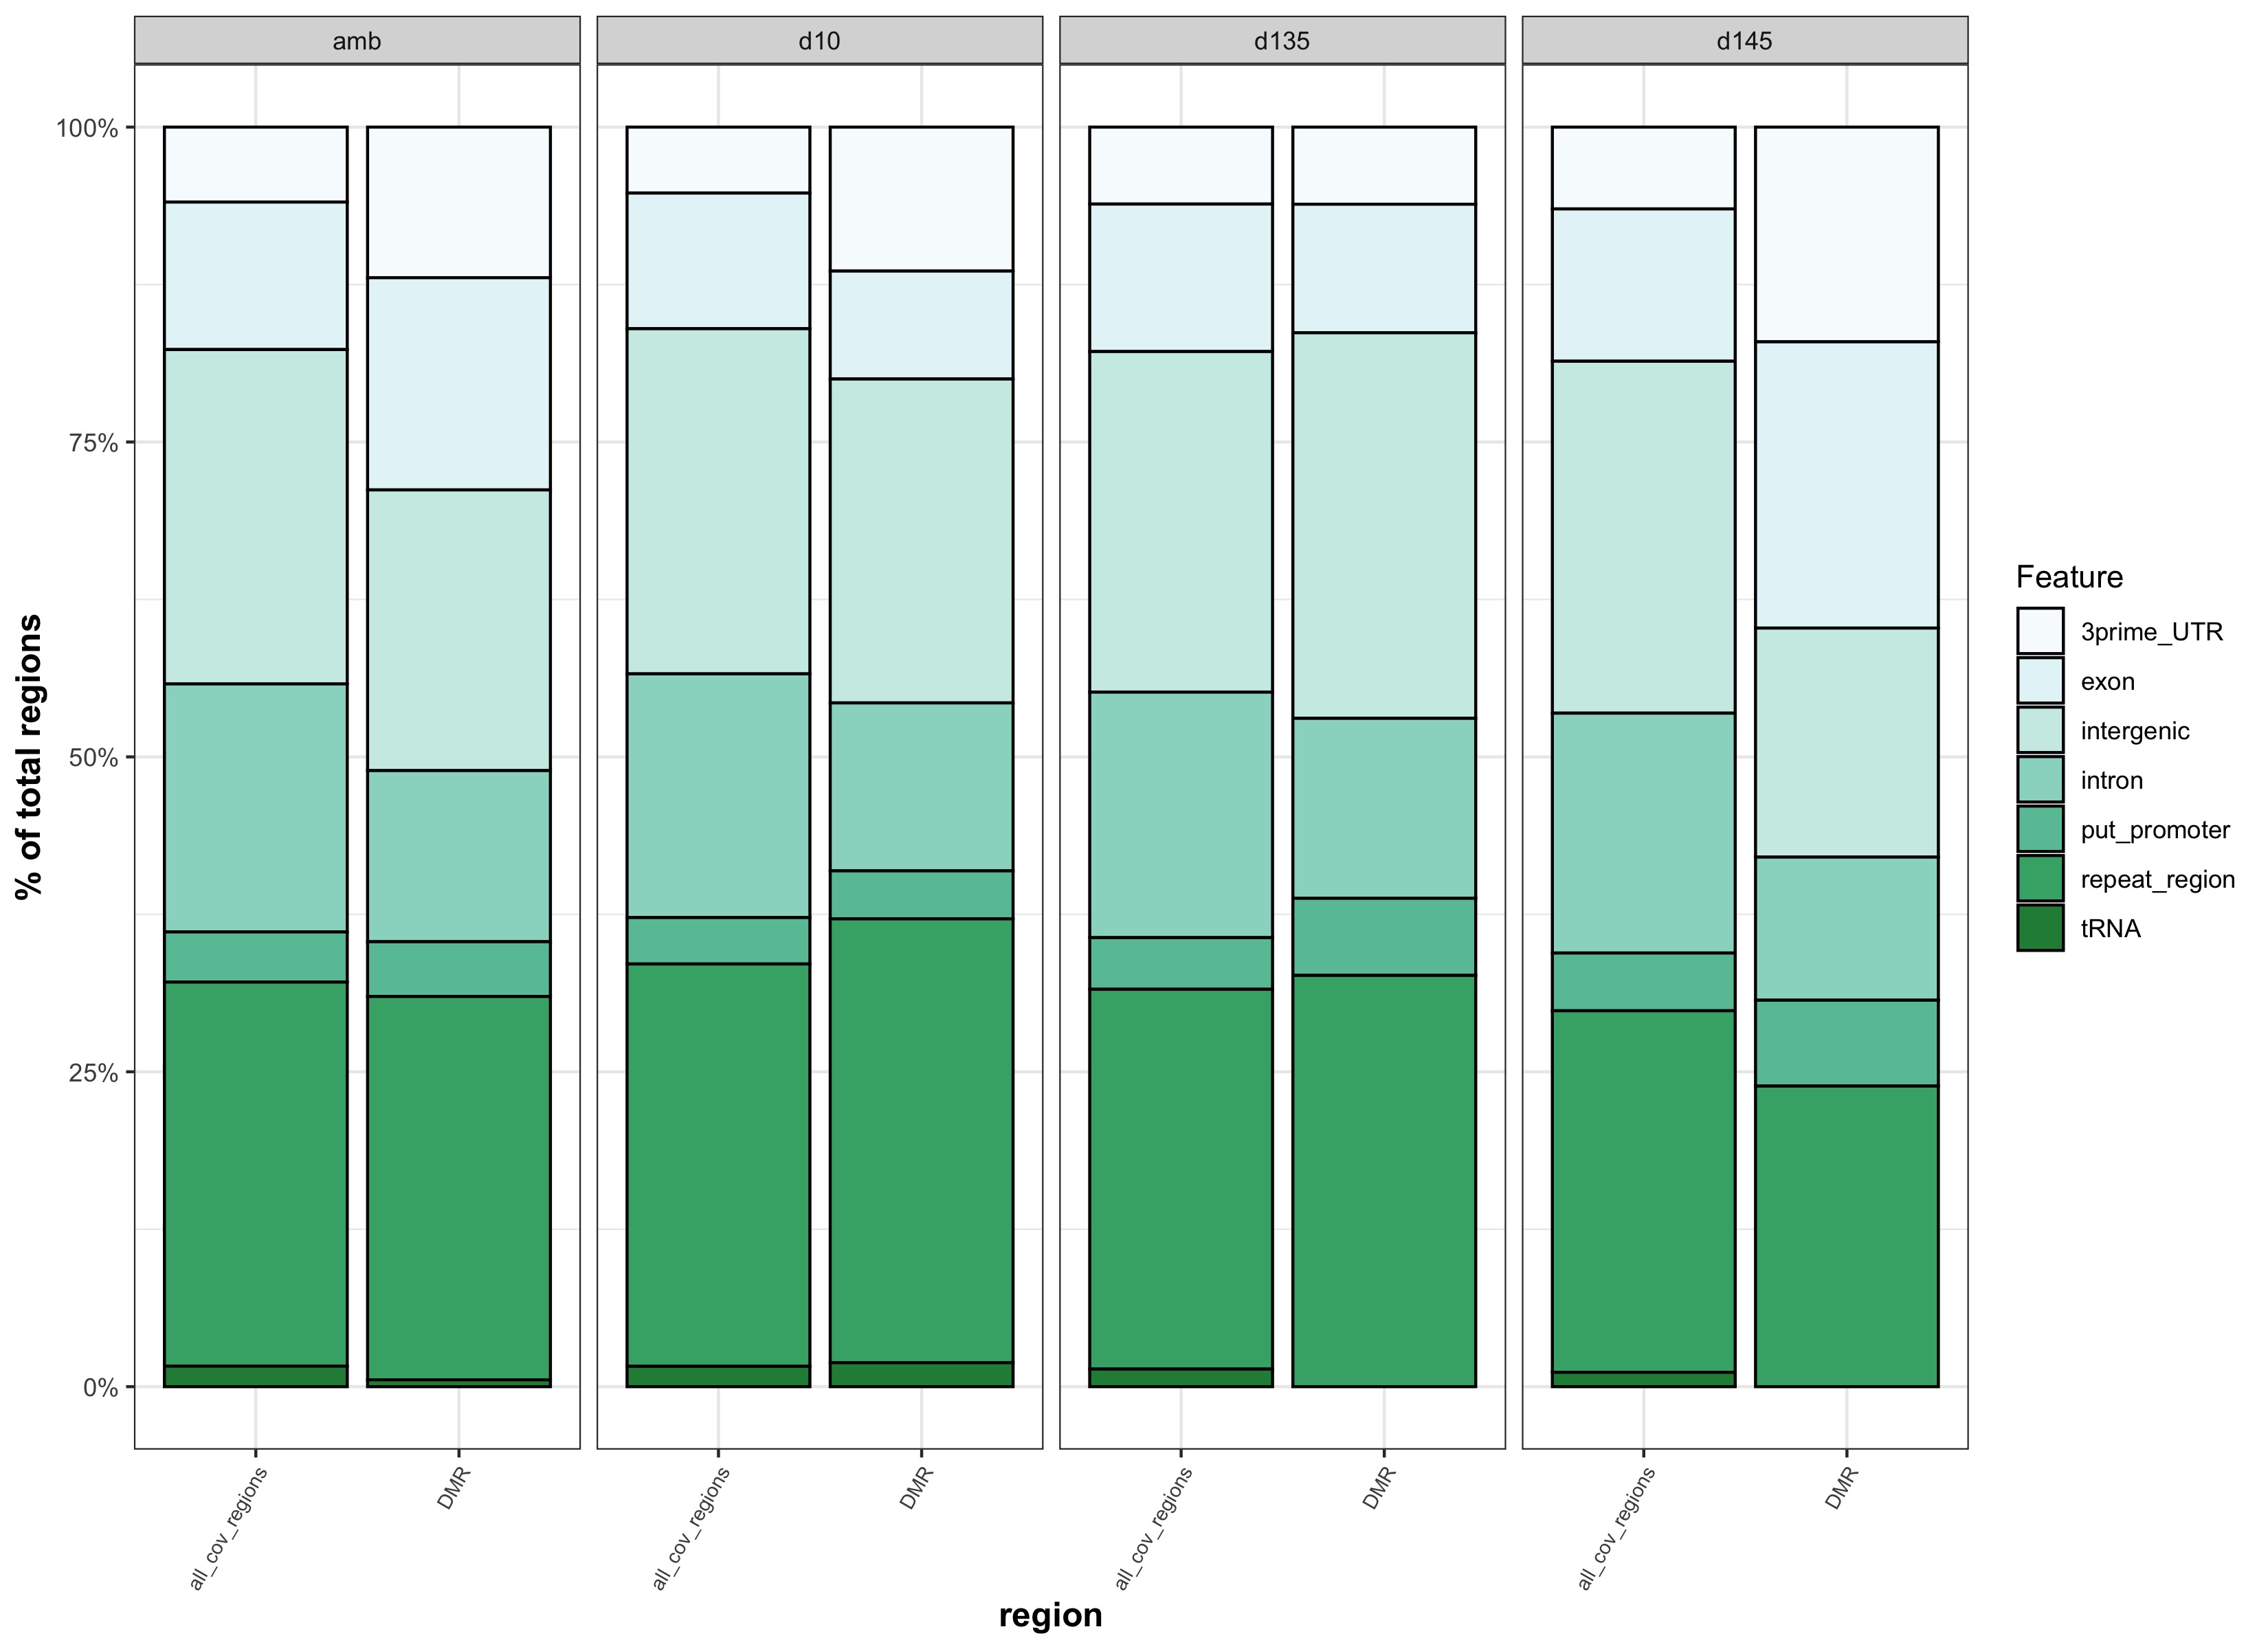
- generate stacked bar plots of features that overlap with background regions and DMRs
- run chi square test on feature proportions and output stats table
- 20200408_anno.Rmd: R markdown that performs step 3 listed in markdown above. This script was created first before adding step 3 to the stats code in Geoduck_Meth repo. This script also checks if DMRs matched to genomic features that aren’t binned (bedtools intersect) give different results than DMRs matched to binned genomic features
Script output
Data
- putative promoter track: https://gannet.fish.washington.edu/metacarcinus/Pgenerosa/GENOMES/feature_tracks/Panopea-generosa-v1.0.a4.putprom.gff3
- putative 3’ UTR track: https://gannet.fish.washington.edu/metacarcinus/Pgenerosa/GENOMES/feature_tracks/Panopea-generosa-v1.0.a4.3primeUTR.gff3
- concatenated features gff: https://gannet.fish.washington.edu/metacarcinus/Pgenerosa/analyses/20200408/Panopea-generosa-v1.0.a4.gff3
- concatenated features bed: https://gannet.fish.washington.edu/metacarcinus/Pgenerosa/analyses/20200408/Panopea-generosa-v1.0.a4.uniq.bed
- concatenated features bed binned at 2kb: https://gannet.fish.washington.edu/metacarcinus/Pgenerosa/analyses/20200408/Panopea-generosa-v1.0.a4.2Kbin.uniq.bed
- DMRs overlapping with binned features:
- Background regions overlapping with binned features:
- https://gannet.fish.washington.edu/metacarcinus/Pgenerosa/analyses/20200408/amb_features.3CpG.txt
- https://gannet.fish.washington.edu/metacarcinus/Pgenerosa/analyses/20200408/day10_features.3CpG.txt
- https://gannet.fish.washington.edu/metacarcinus/Pgenerosa/analyses/20200408/day135_features.3CpG.txt
- https://gannet.fish.washington.edu/metacarcinus/Pgenerosa/analyses/20200408/day145_features.3CpG.txt
- DMRs overlapping with features that ARE NOT BINNED:
- other intermediate files can be found here: https://gannet.fish.washington.edu/metacarcinus/Pgenerosa/analyses/20200408/
plots
- pH.DMR_genom_feat_stacked_barplot.jpg:

- Time.DMR_genom_feat_stacked_barplot.jpg:

Figures
- Figure 5:

- Figure S3:

tables
binned vs. not binned features test output
This comparison was to test whether different results came from matching DMRs to binned genomic features versus genomic features that were not binned. The reason for matching DMRs to binned genomic features was to more similarly match how background regions were identified.
| genomic features binned | genomic features not binned |
|---|---|
| stacked_feats_b.jpg | stacked_feats.jpg |
 |
 |
- because there is no apparent difference if DMRs are matched to binned features vs. features that aren’t binned, we should go with binned features so that DMR feature overlap is more similar to backgound feature overlap