ANOVA seems to model % methylatiion in some DMRs better than GLM and vice versa. So it seems either method should be OK.
There is no noticable difference between the different GLM link settings, so I continued the analysis with link = inverse
Comparing ANOVA vs. GLM significant DMRs
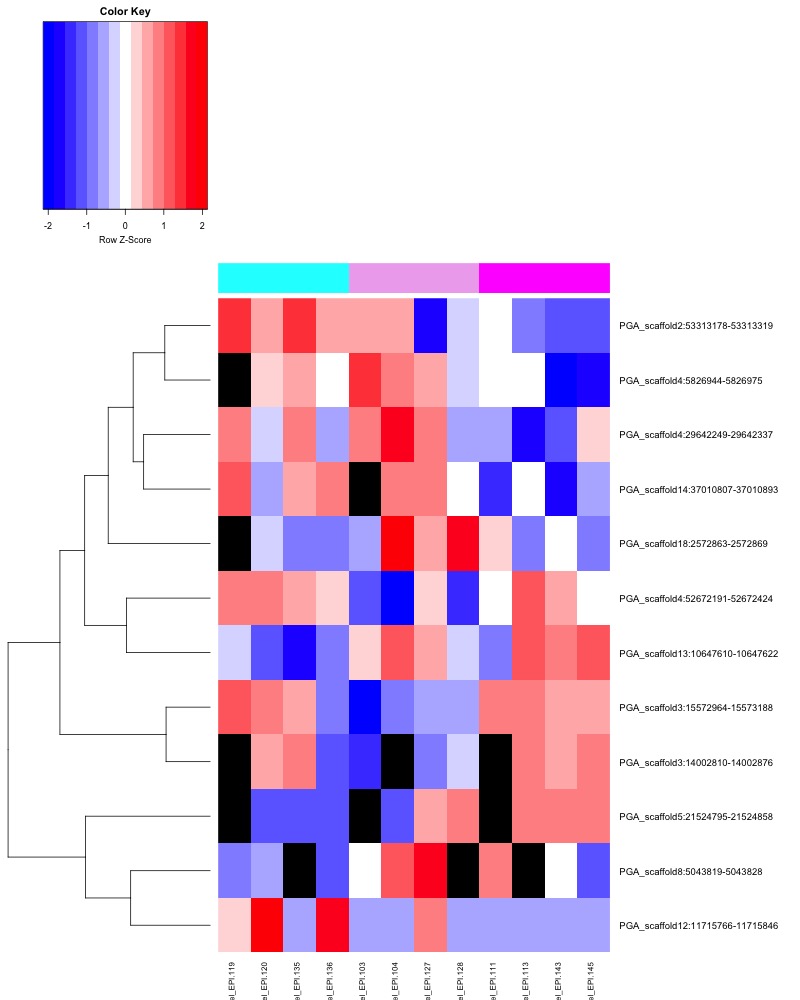
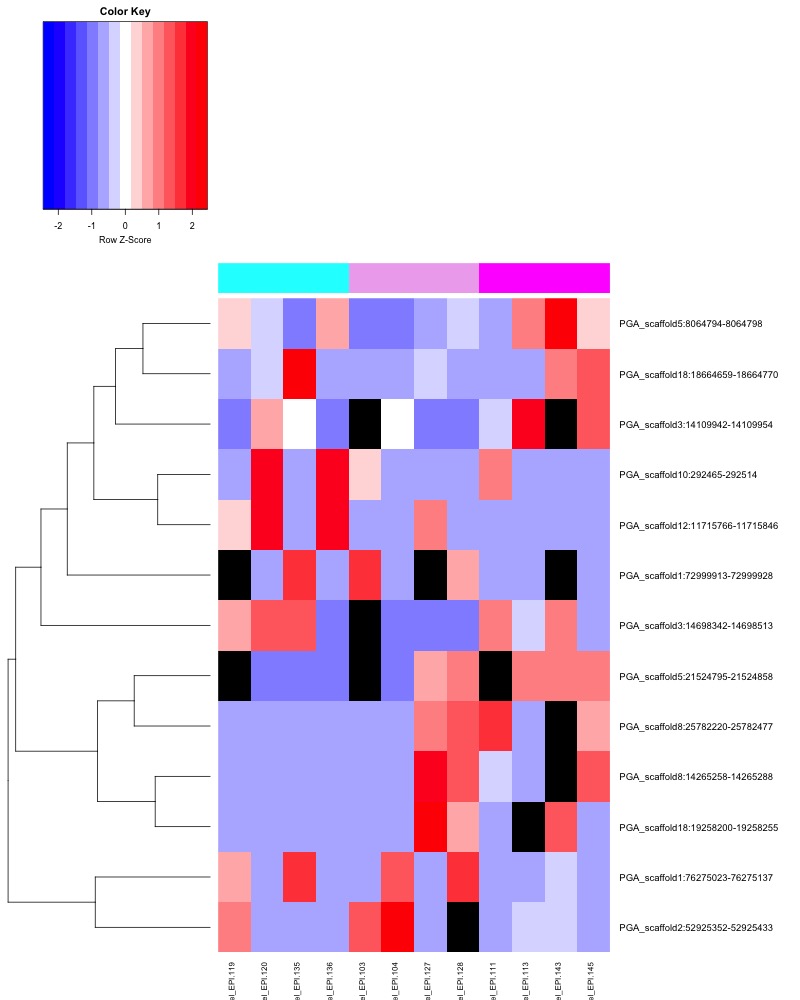
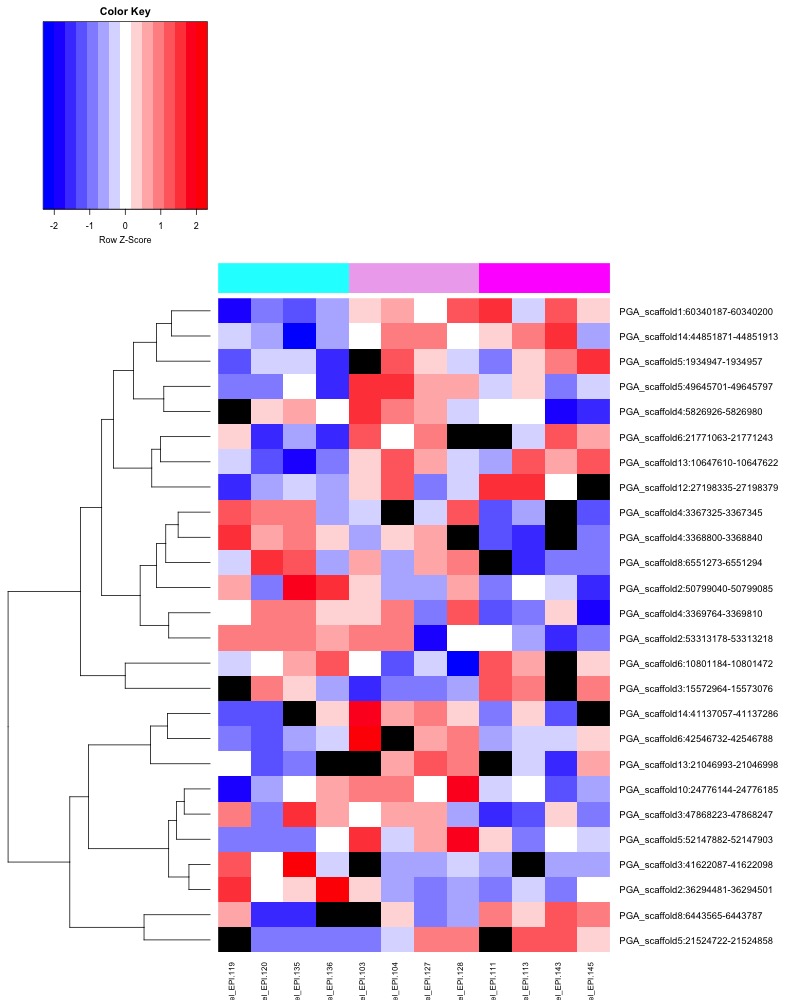
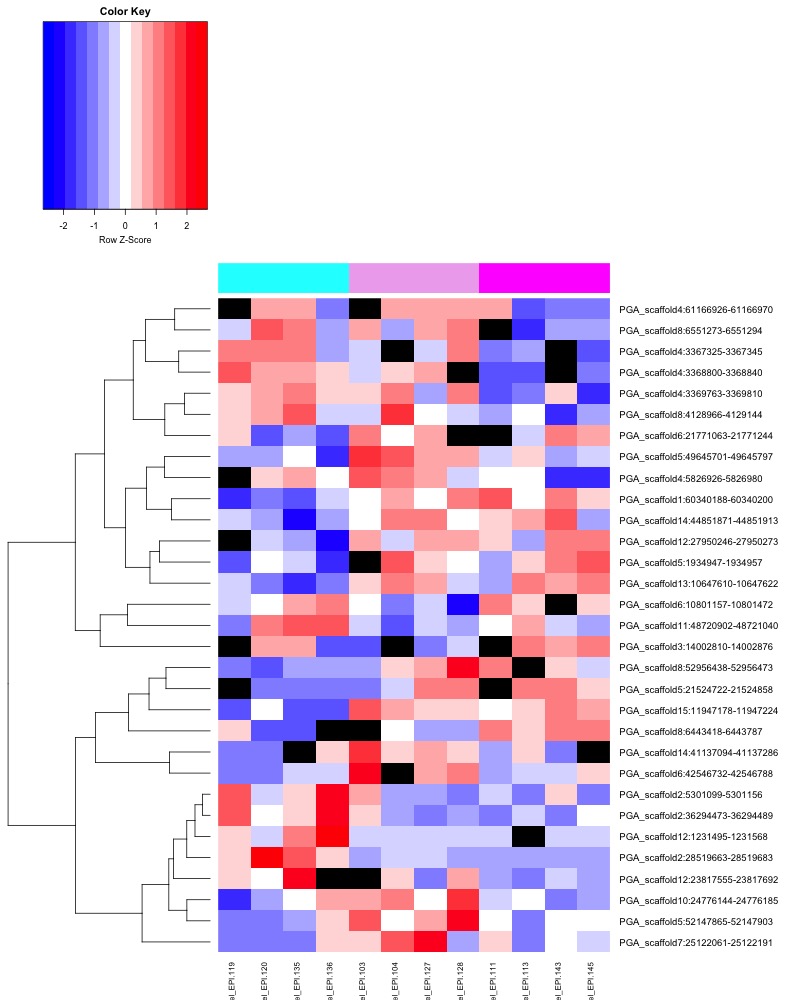
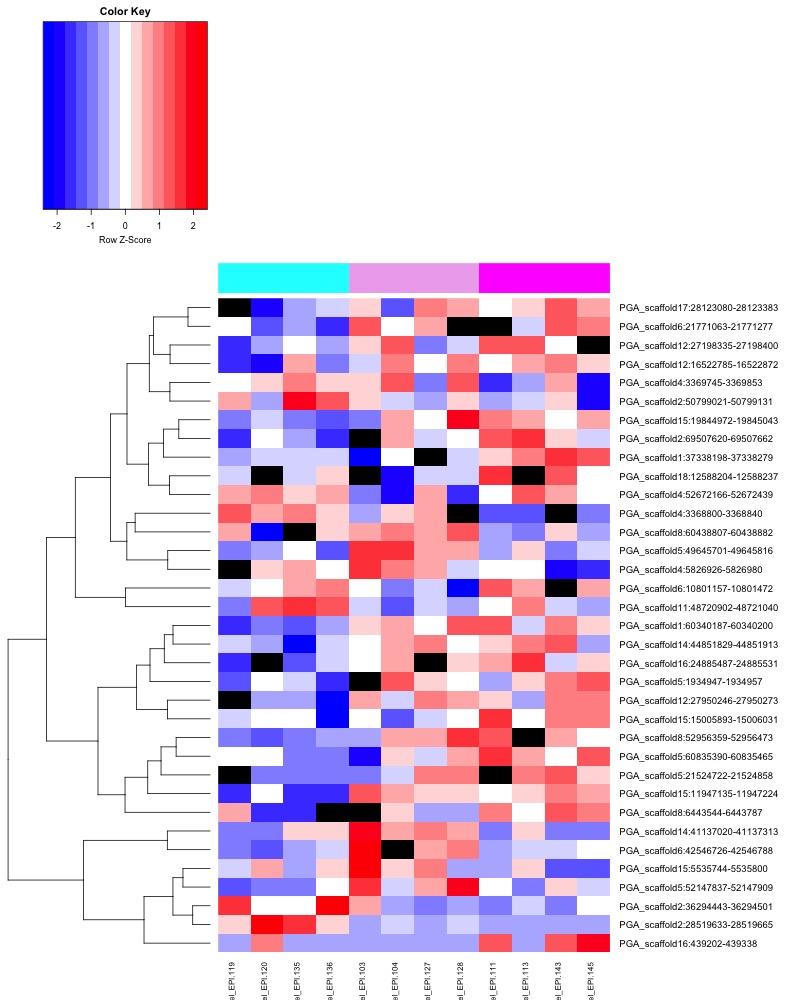
ANOVA and GLM each identify different DMRs so I plotted these using an uncorrected p-value < 0.1. Column color bar in heat maps below: cyan = ambient, light pink = low.pH, magenta = super.low.pH. heatmap color: Red = more methylation, blue = no methylation, black = no data.
ANOVA significant day 10 MCmax10 DMR heatmap:
GLM significant day 10 MCmax10 DMR heatmap:
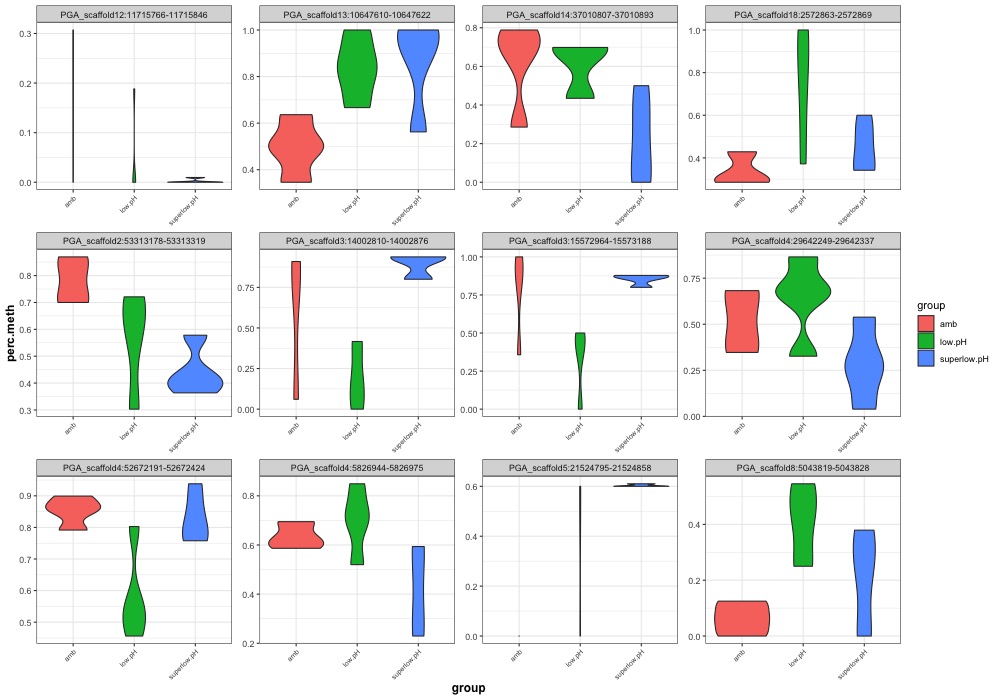
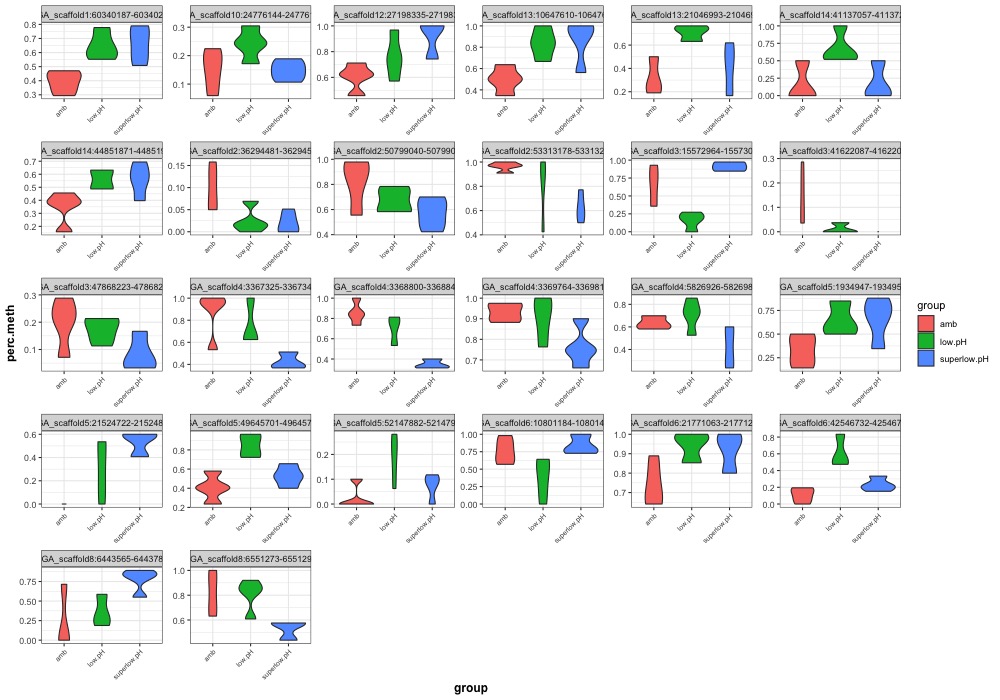
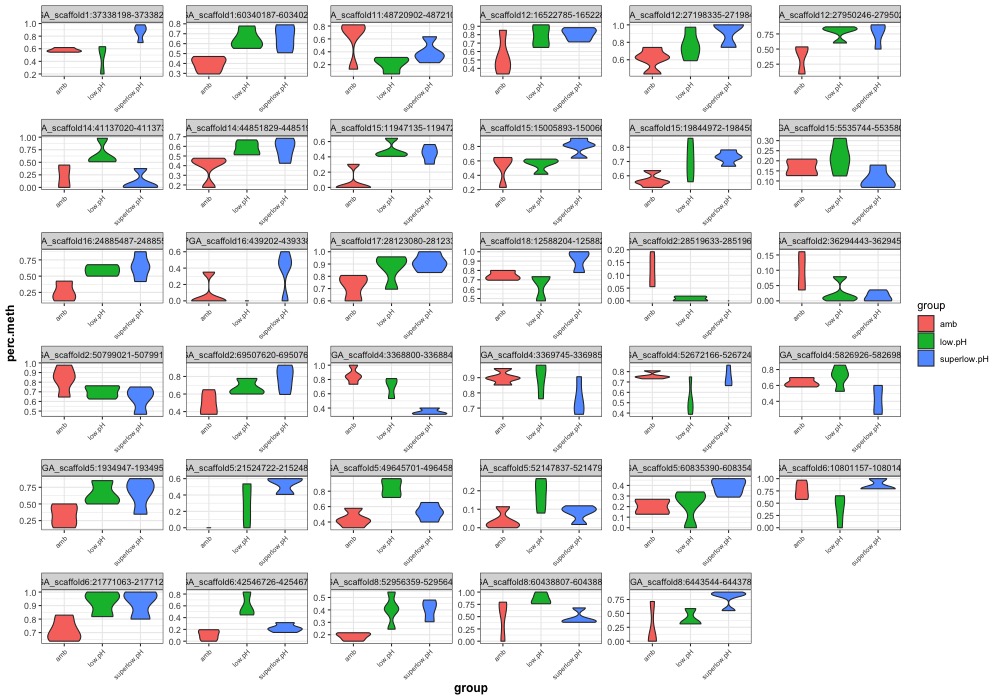
ANOVA significant day 10 MCmax10 DMR violinplots:
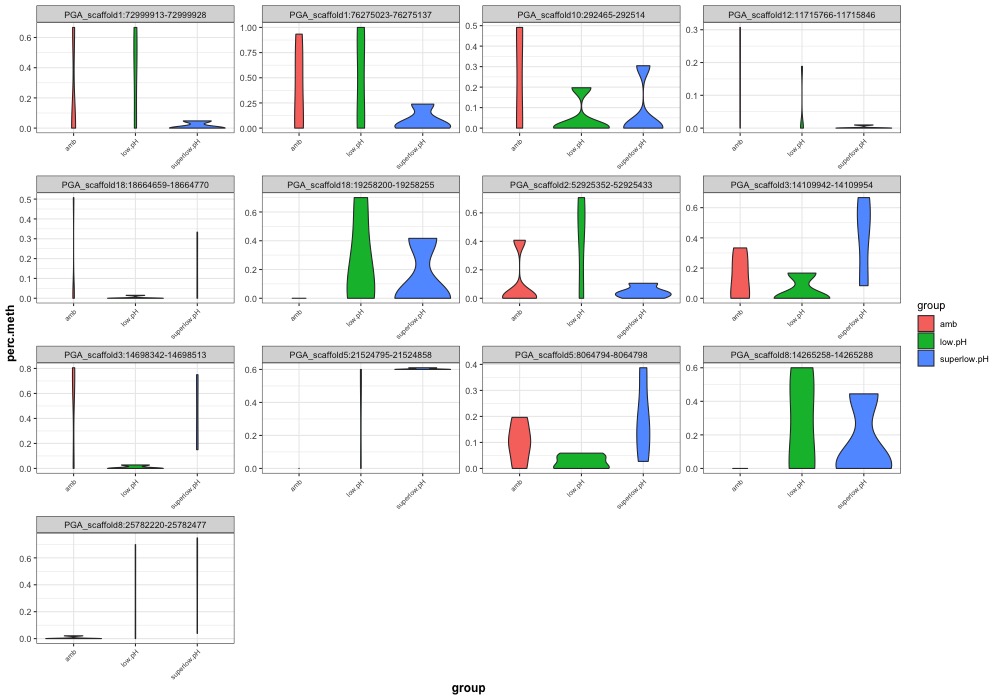
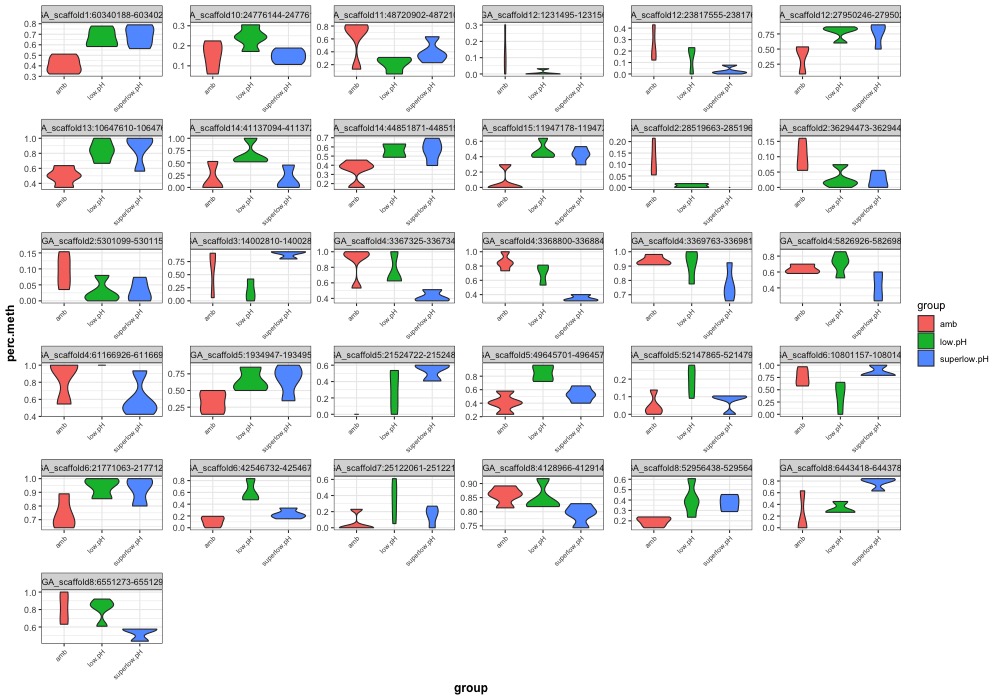
GLM significant day 10 MCmax10 DMR violinplots:
CONCLUSIONS:
the GLM seems more likely to identify DMRs as significant when one group has zero % methylation and/or half of another group’s samples have zero % methylation.
I feel alittle more confident going with the ANOVA
Check ANOVA significant DMRs found by other DMRfind parameters
Next I ran ANOVA DMRs from DMR parameters MCmax = 25bp, 30bp, and 50bp for day10 samples to see if these DMRs show obvious group patterns in the heatmaps and violinplots
Rmarkdown files that generated figures below are here:
CONCLUSIONS: MCmax30 give the most number of DMRs while sill maintaining clear patterns in the heatmap and violinplots. I think the patterns are less obvious in the MCmax50 heatmap. Therefore, I think it’s safe to go with the MCmax30 parameter.
NEXT STEPS: Run ANOVA, generate heatmaps and violinplots for DMRs from all 4 comparisons