Summary of DMR analysis so far:
- Call methylation state from bismark data (mox script here)
- Call DMRs within individual samples (mox script here)
- Filter DMRs for those in at least 3/4 samples/group (R script here, R proj here)
- Filter DMRs for those significant at ANOVA uncorrected p.value < 0.1 R markdown script here, Rproj here
Summary of Step 4 above
Filtering DMRs for those significant at ANOVA uncorrected p.value < 0.1 from all 4 comparisons (all ambient samples, day10 samples, day 135 samples, and day 145 samples)
- R markdown here: Oct29_MCmax30DMR_group_stats.Rmd
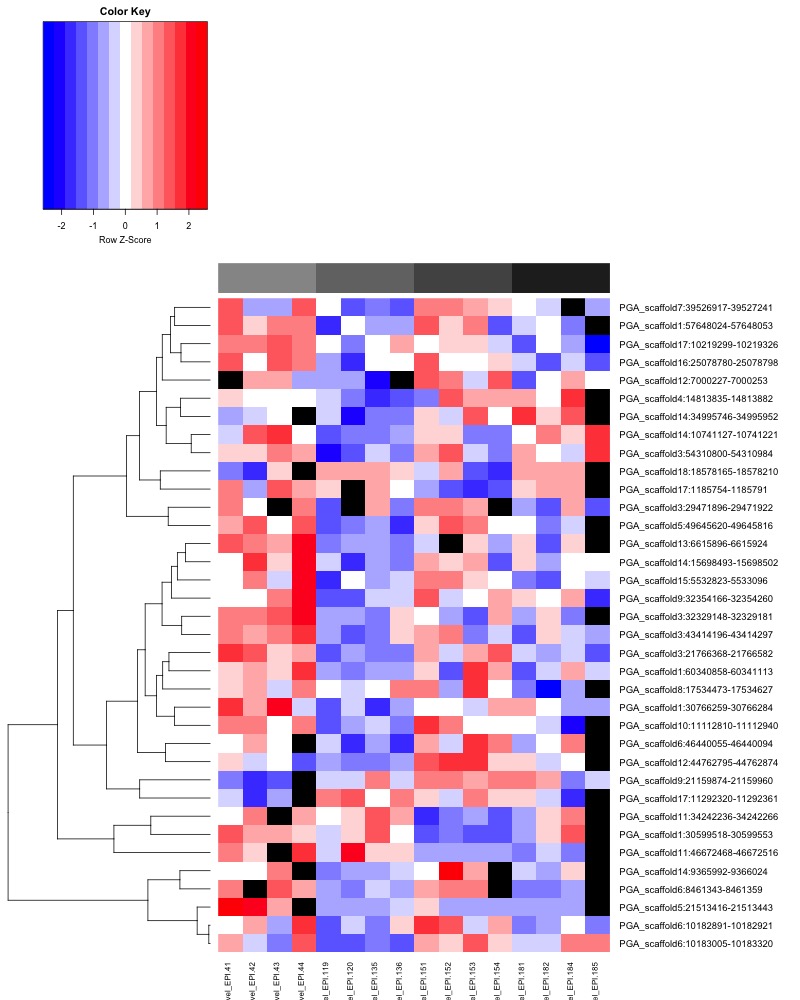
- ANOVA significant all ambient MCmax30 DMR heatmap:
- Heatmap key: Column color bar: light gray -> dark gray = day 0 -> day 145, heatmap cell color: Red = more methylation, blue = no methylation, black = no data.
-
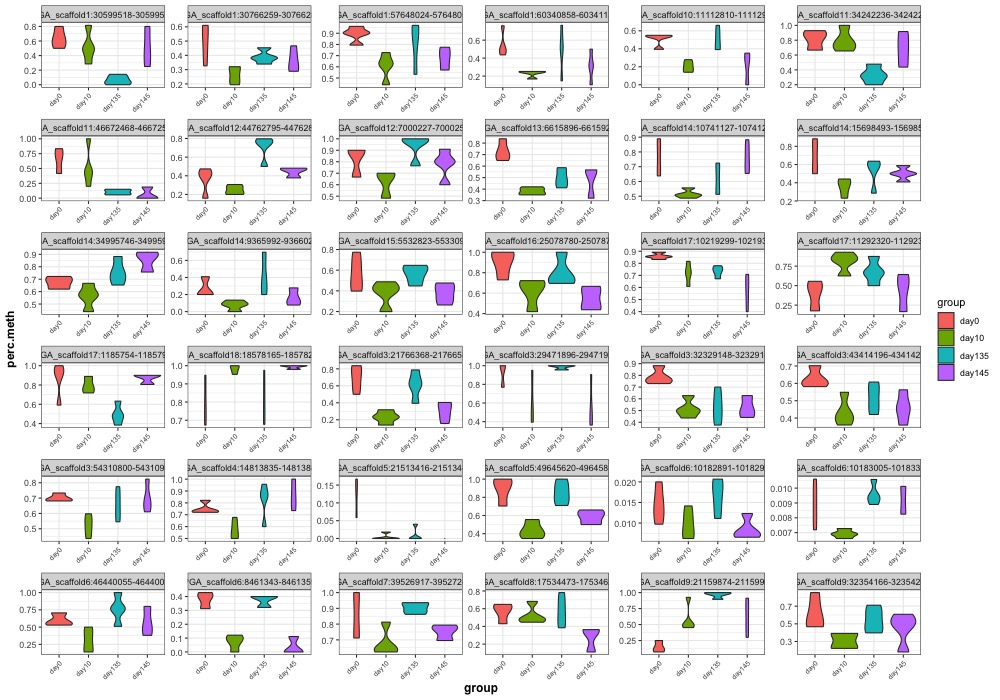
ANOVA significant all ambient MCmax30 DMR violinplots:
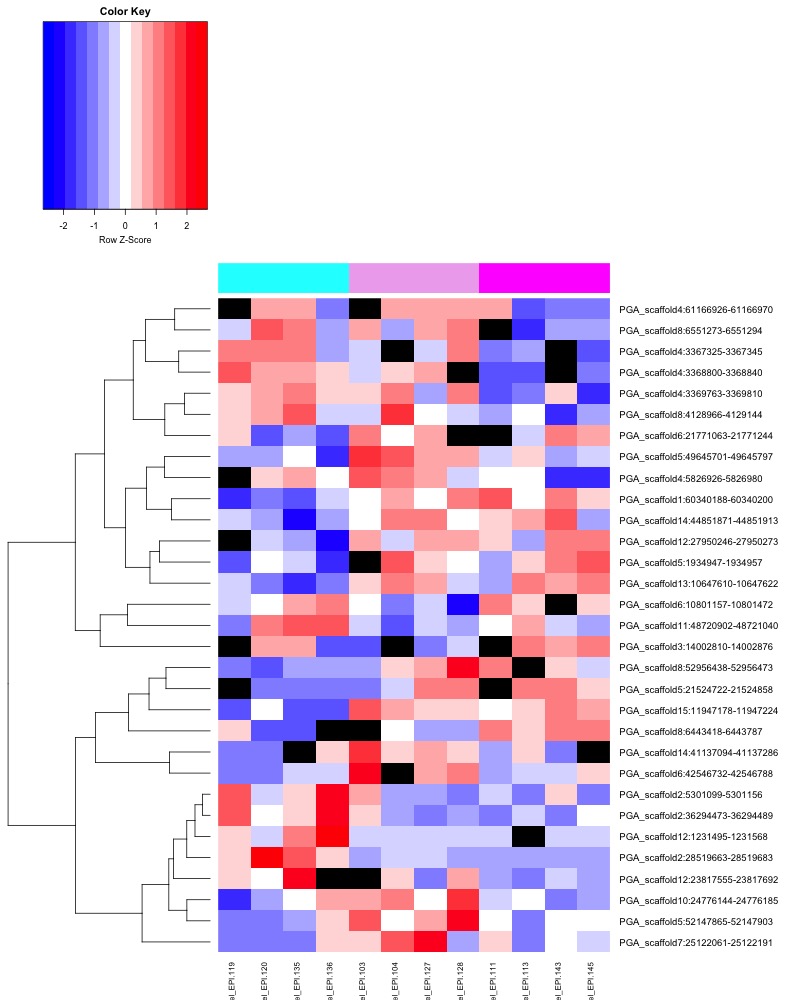
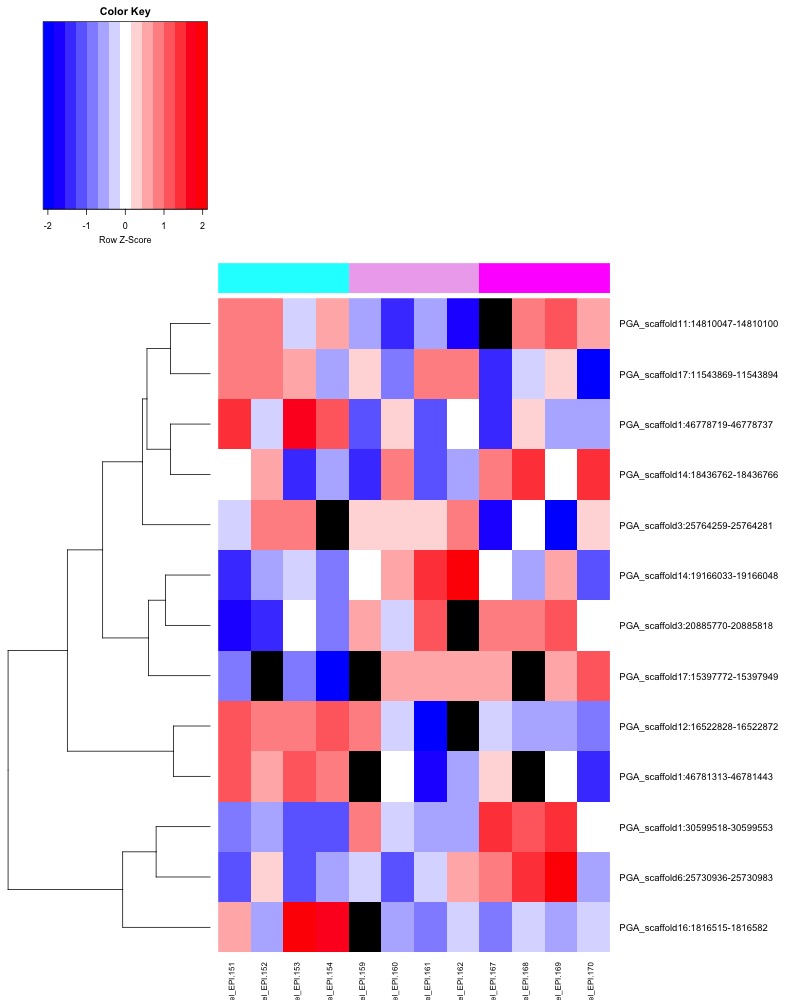
- ANOVA significant day 10 MCmax30 DMR heatmap:
- Heatmap key: Column color bar: cyan = ambient, light pink = low.pH, magenta = super.low.pH. heatmap cell color: Red = more methylation, blue = no methylation, black = no data.
- Heatmap key: Column color bar: cyan = ambient, light pink = low.pH, magenta = super.low.pH. heatmap cell color: Red = more methylation, blue = no methylation, black = no data.
-
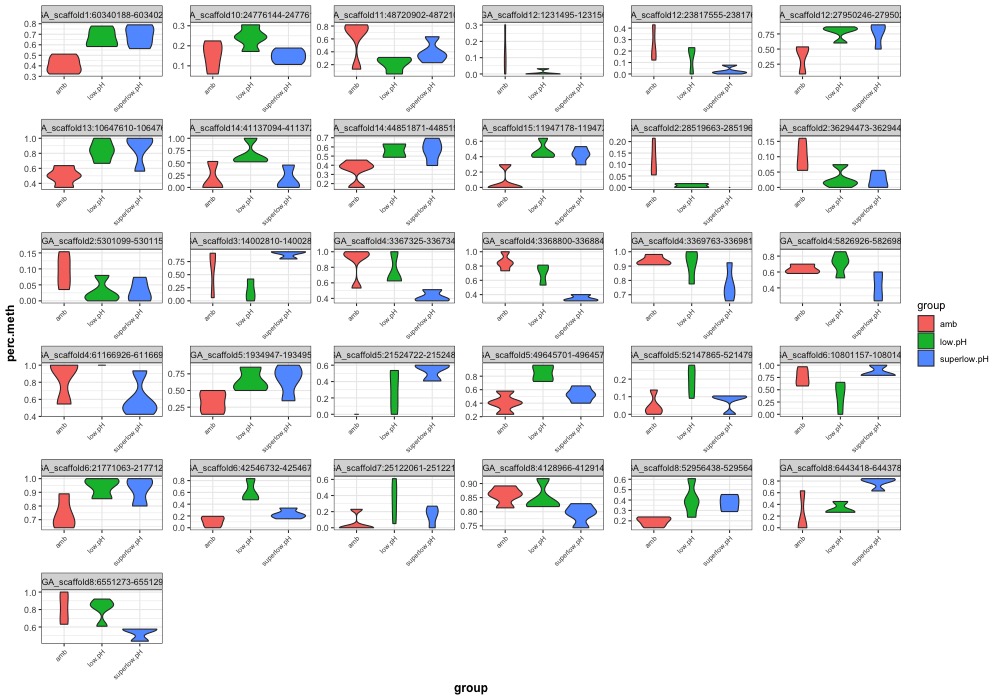
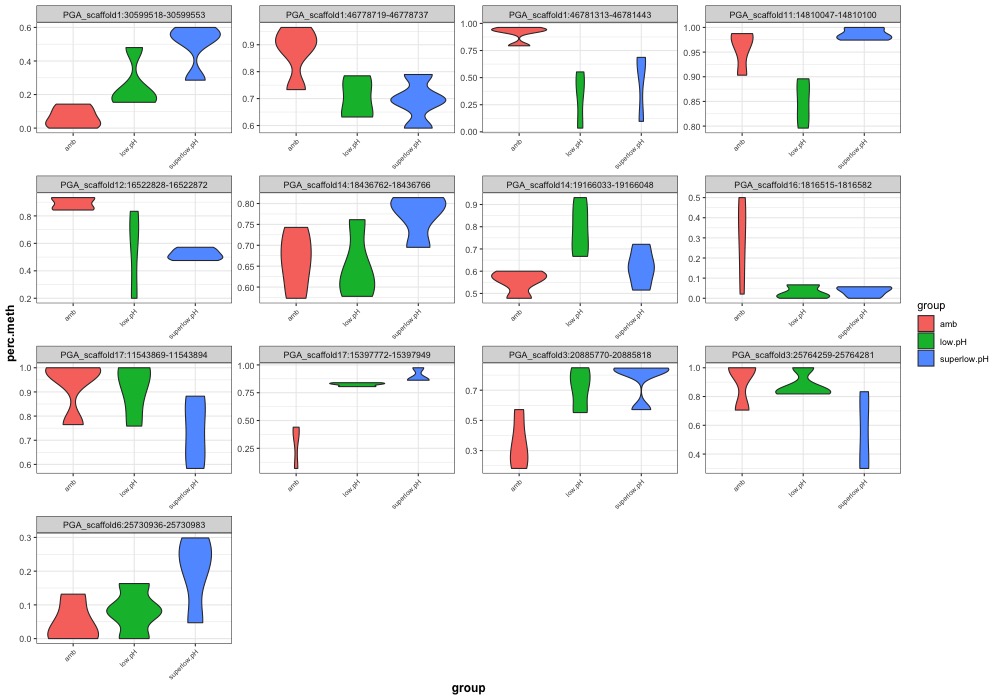
ANOVA significant day 10 MCmax30 DMR violinplots:
- ANOVA significant day 135 MCmax30 DMR heatmap:
- Heatmap key: Column color bar: cyan = ambient, light pink = low.pH, magenta = super.low.pH. heatmap cell color: Red = more methylation, blue = no methylation, black = no data.
- Heatmap key: Column color bar: cyan = ambient, light pink = low.pH, magenta = super.low.pH. heatmap cell color: Red = more methylation, blue = no methylation, black = no data.
-
ANOVA significant day 135 MCmax30 DMR violinplots:
- ANOVA significant day 145 MCmax30 DMR heatmap:
- Heatmap key: Column color bar: cyan = ambient, light pink = low.pH, magenta = super.low.pH. heatmap cell color: Red = more methylation, blue = no methylation, black = no data.
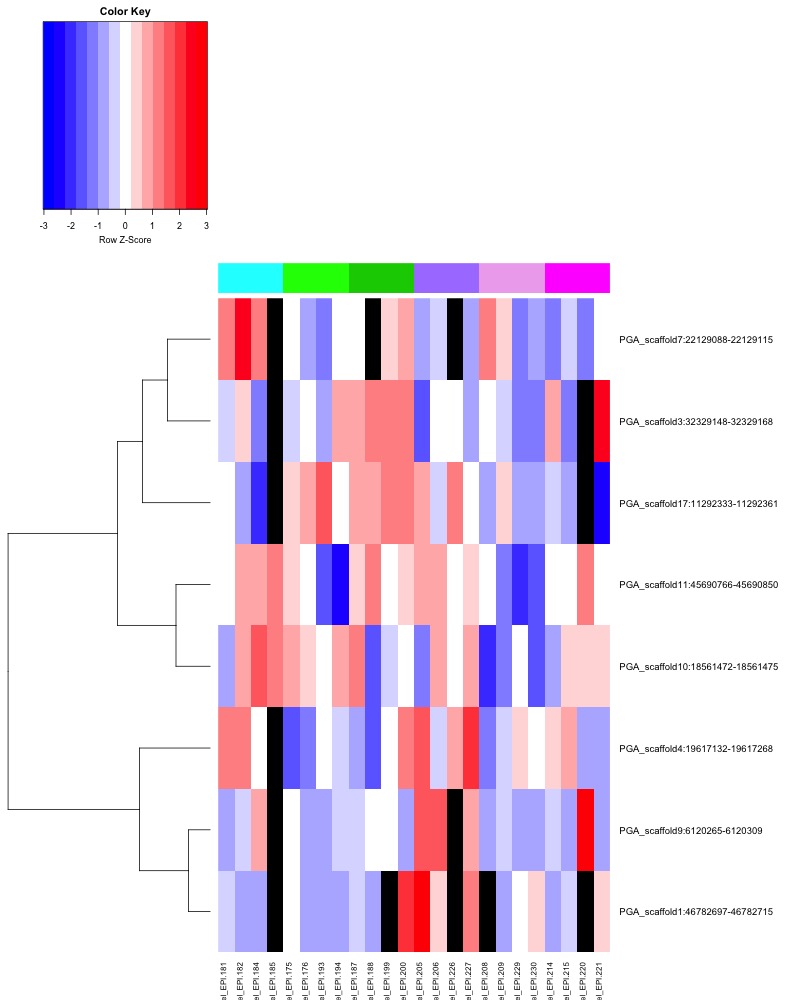
- Heatmap key: Column color bar: cyan = ambient, light pink = low.pH, magenta = super.low.pH. heatmap cell color: Red = more methylation, blue = no methylation, black = no data.
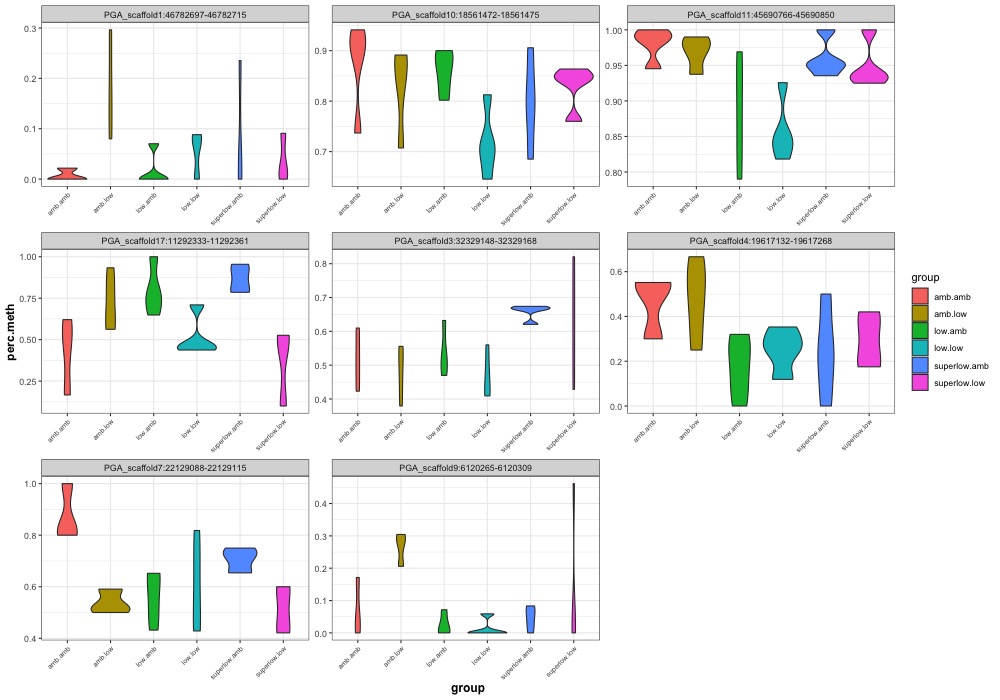
- ANOVA significant day 145 MCmax30 DMR violinplots:
Next steps:
- visualize significant DMRs in IGV
- Functional analysis of DMRs