Re-do analysis with updated selected proteins from clustering without day 0.
Kaitlin’s previous clustering analysis included day 0. She made a euclidean distance matrix and cut the dendrogram at 250 to ID 33 proteins in 35 different clusters.
In the new analysis, she made a euclidean distance matrix and cut the dendrogram at 150 to ID 135 proteins in 61 different clusters.
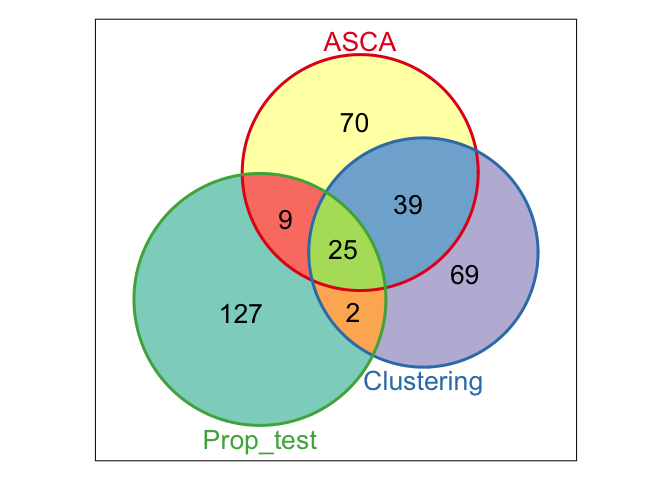
There are now 135 protiens ID’d by clustering, 143 proteins ID’d by ASCA, and 163 proteins ID’d by proportions test to be significantly influenced by temperature.
I made a new proportional venn diagram in R to show proteins commonly and uniquely identified by different statistical methods.
I also made a new heatmap of these proteins.
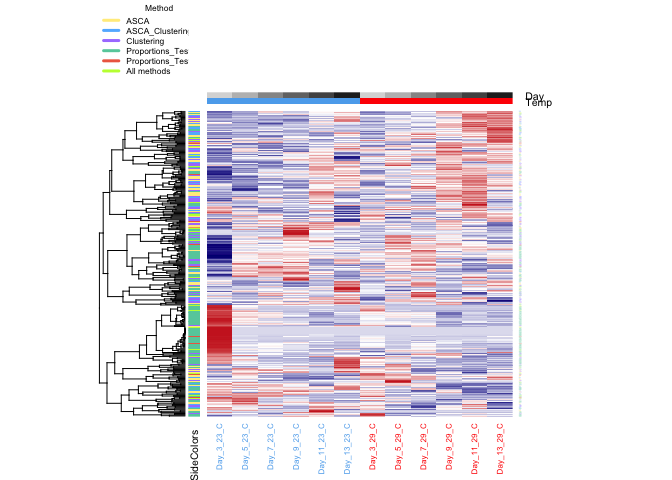
These figures will be the new figure 3 in the manuscript.
I also plotted heatmaps and abundance line plots of proteins identified by each individual method as a way to verify the methods are selecting proteins that have abundances affected by temperature. To see these, CHECK OUT THIS MARKDOWN FILE FOR NEW FIGURES
Markdown file was generated by this R markdown file, so it out if you’re interested in the R code.
Still need to:
- Re-run the GO analysis/cytoscape with updated protein list generated today
- dig into the last figure in terms of what the biological significance actually is
- work on the discussion