General proteome characterization
For preliminary figures to generally describe the types of proteins detected in the proteomes from different temperatures and different time points; I wanted to do a functional classification of all proteins detected in different samples.
In brief:
- I merged the average NSAF data with the uniprot mapping data and used an e-value cut off of 10^-10. This kept about half of all the proteins detected (~3500).
- I extracted all their GO IDs that were annotated in the Uniprot database and reformated them so that for each protein is listed with only one GO ID, repeated proteins on a new line for each different GO ID it has.
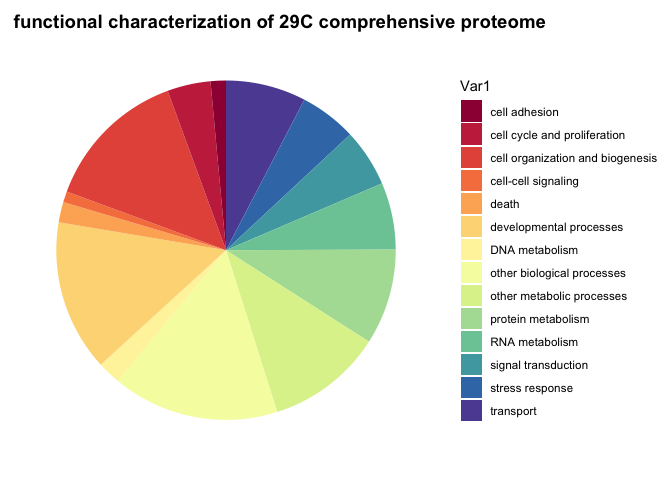
- I mapped the GO IDs to the Roberts lab GO slim terms and plotted pie charts for:
- each proteome from a different time point and temperature
- there were no differences between the pie charts, meaning they mostly have the same GO slim terms. This makes sense because most proteins were overlapping between time points and temperatures. See markdown file linked below for these plots.
- comprehensive proteomes for each temperature
- again no difference in pie charts

- again no difference in pie charts
- the comprehensive proteome of all samples
- this is what I’m thinking to report in the paper:
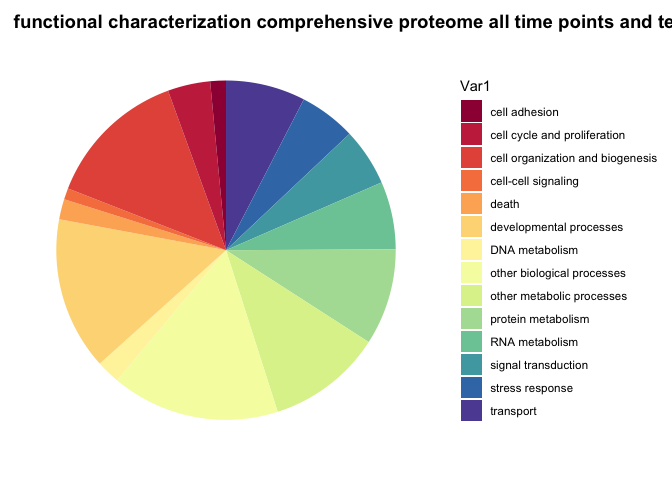
- this is what I’m thinking to report in the paper:
- each proteome from a different time point and temperature
For more details, refer to markdown file : https://github.com/shellywanamaker/OysterSeedProject/blob/master/analysis/UniprotAnnotations_NetworkAnalysis/General_proteome_characterization/General_proteome_characterization.md
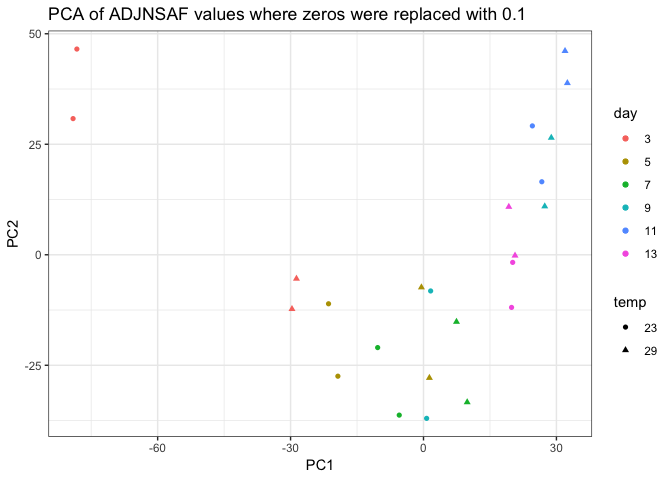
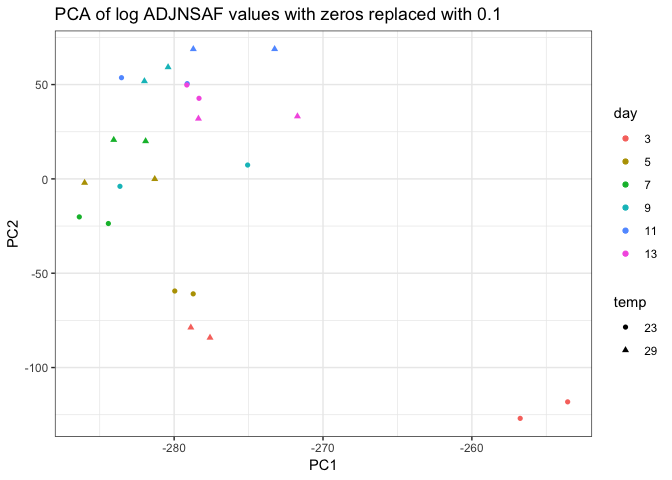
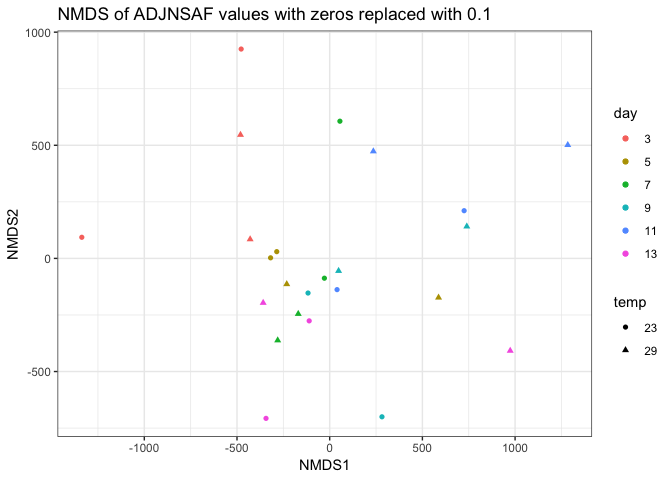
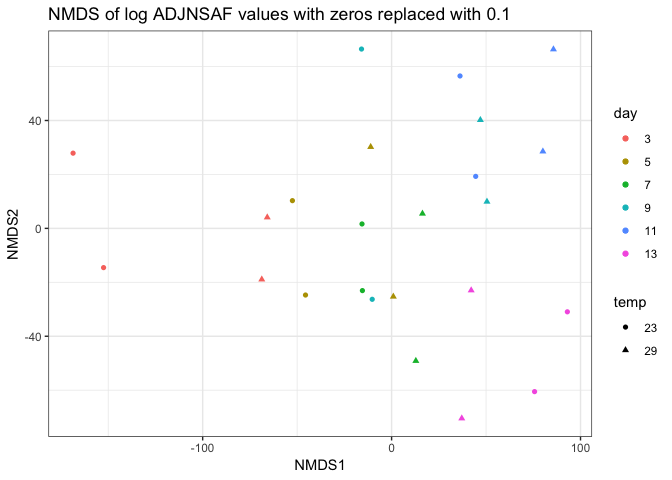
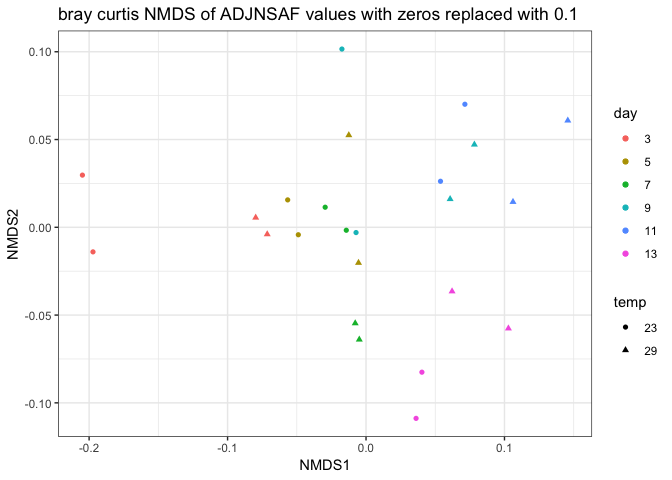
Redo the PCA of the technical replicates
I removed day 0 from clustering technical replicates and generated the plots below in this markdown file and corresponding Rmarkdown file. I think the PCA of log ADJ NSAF values show the tighest clustering between technical replicates, so I’ll replace the current PCA in Supplementary figure 1 with this one.
Still need to work on the following:
- Make heat map plot of hierarchical clustered proteins, now clustered without day 0.
- Re-run the GO analysis/cytoscape with the updated significantly changed protein list
- dig into the last figures
- discussion