Calculating abundance fold change between temperatures on the same day
- Completed foldchange analysis between temperatures at each time point (day 3,5,7,9,11,and 13). See code: TotNumSpec_plus1_ratioFC_Pval_compareTempsSameDay.Rmd
- output file is sumNUMSPECSTOT_plus1_ratioFC_logFC_pval_DAYSCOMPARED.csv
- Pulled out only proteins affected by time and temp determined by ASCA from the output file and made it into a nodes attribute file. See code ASCA_proteinNetworkAnalysis_withGO.R lines 233-248.
- node attribrute file is ASCA_all_FCtosameday_pval.csv
Check that GO Slim terms in protein-GO Slim Terms file match REVIGO’s GO slim terms
- figured out revigo changes the names of GO terms (or is using a version of GO terms with different names). See code CheckREVIGOterms.R.
- 17 GO slim terms from REVIGO don’t overlap with the GO slims from OntologyX analysis
- 26 GO slim terms from Ontology X don’t overlap with REVIGO GO slims.
Conclusions:
- only 2/3 of protein-term associations can map to REVIGO GOslim terms
- REVIGO does not provide a file showing how the 62 OntologyX terms mapped to their GOslim terms
- Need another way to get GO slim term-term relationships instead of using REVIGO; or another way to relate proteins to each other
Trying Cytoscape STRINGapp to get protein-protein relationships
The Stringapp gets protein-protein interaction data from the STRING database and uses the data to create a Cytoscape network. Publication here
- After installing the STRINGapp, I uploaded a list of unique uniprot accessions from ASCA_entry_GO.txt generated by lines 255-258 in ASCA_proteinNetworkAnalysis_withGO.R to this cytoscape session OysterProteomicsNetworkAnalysis.cys
- Selected human as the species as the app only allows you to select one species.
- The resulting network only contained 26 proteins indicating poor mapping
- The uniprot accessions I have from mapping the protein sequences to the uniprot database are from many different species
Conclusions:
- Find a non-species specific way to find protein-protein relationships
Using GO semantic similarity in R to get term-term relationships
REVIGO uses GO semantic similarity to determine slim term relationships. The standard cutoff is 0.7.
I used the get_sim_grid() function in package OntologySimilary (part of OntologyX) to get GO semantic similarity values. This output a symmetric matrix from which I took the upper half and reshaped it to make a network file listing each GO slim term combination and their GO semantic similarity values. See code: SymanticSim.R that i used in combination with ASCA_proteinNetworkAnalysis_withGO.R in the UniprotAnnotations_preliminaryNetworkAnalysis.Rproj. The output has 4 columns: 1. Term1 2. Term2 3. Semantic Similarity score 4. relationship type (term-term or protein-term). The ouput file is edge_attb_semsim0.7.csv.
I also generated an edge attribute file with the original GO IDs (not the GO Slim IDs) to avoid loss of information in mapping to slim terms via my OntologyX method and to see if clustering in cytoscape alone would be able to group terms into simpler categories. See lines 65-96 of code SymanticSim.R
- the output network file is term-term.csv
Cytoscape network mapping with GO semantic similarity edges
In the same cytoscape session (OysterProteomicsNetworkAnalysis.cys):
- I created a new network from term-term.csv. This network does not have protein information, only term-term info just to see if Cytoscape can cluster the non-slim GO terms into simpler categories. I chose organic clustering and it made this:
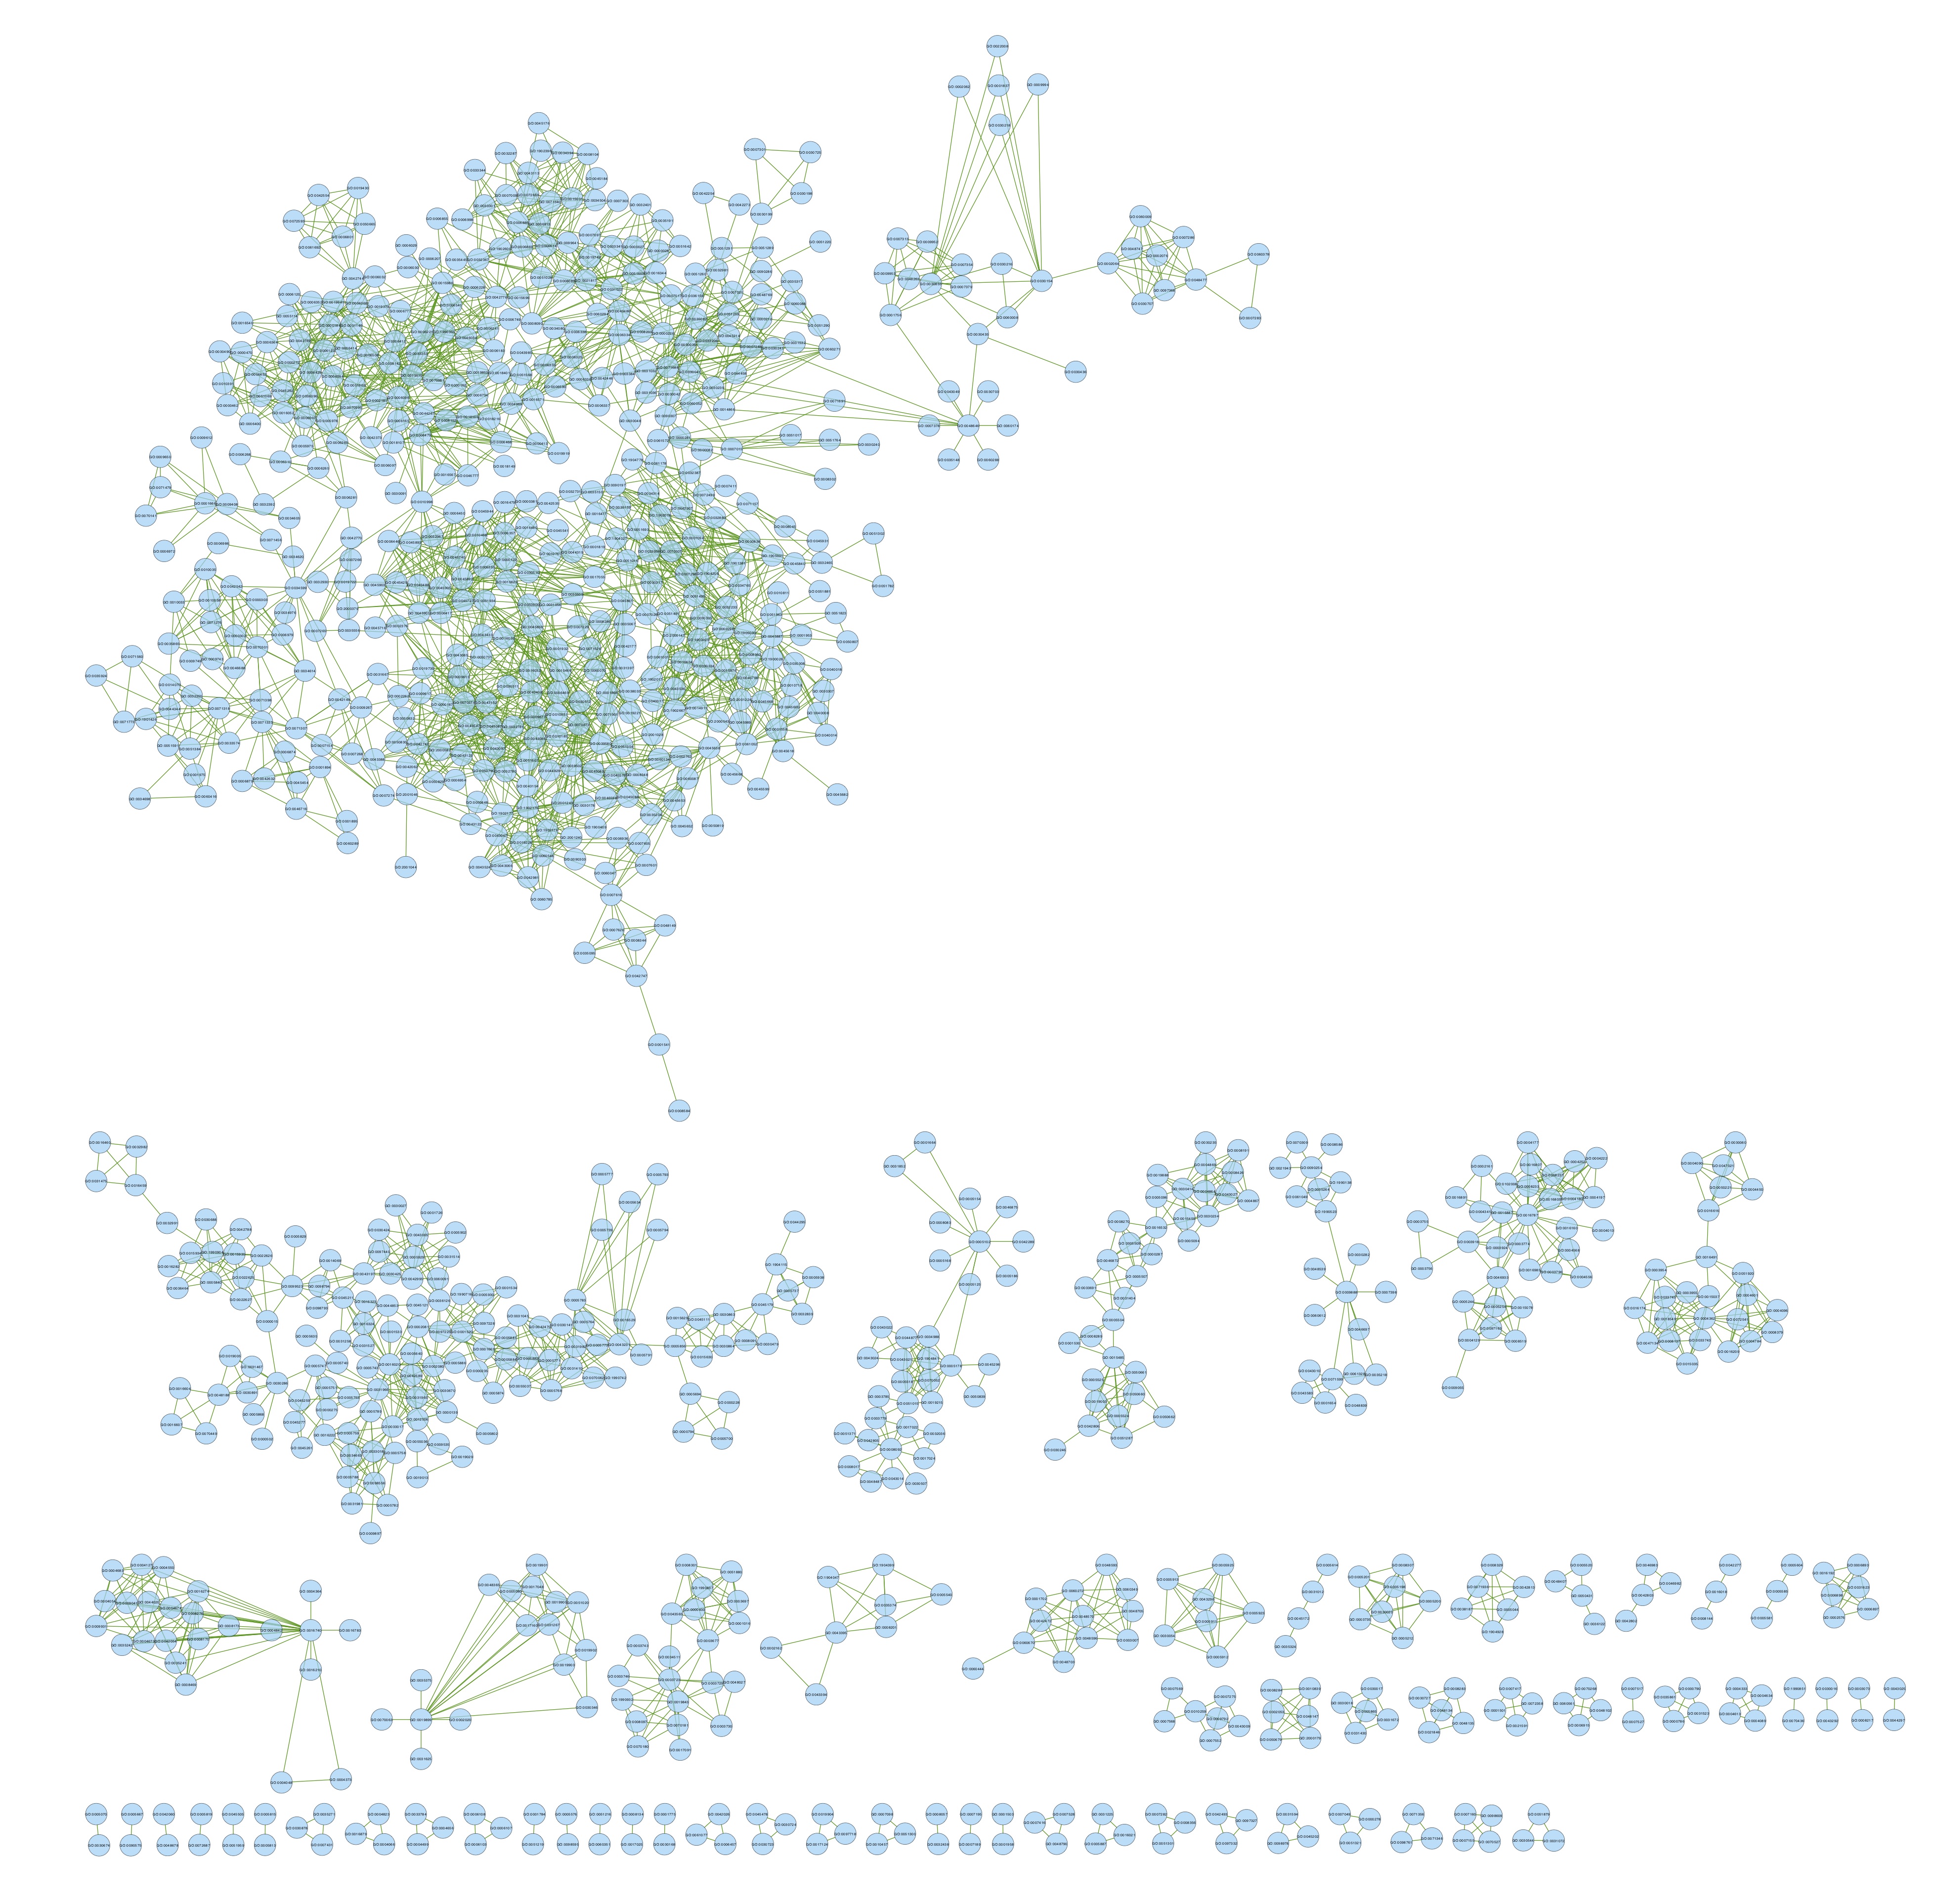
It seems like too many GO terms are falling into the same cluster so I’m not sure how meaningful this is.
-
I created a new network from edge_attb_semsim0.7.csv and ASCA_all_FCtosameday_pval.csv as node attributes. I selected just the GO term nodes, made a new sub-network from those, and did organic clustering to find GO modules.
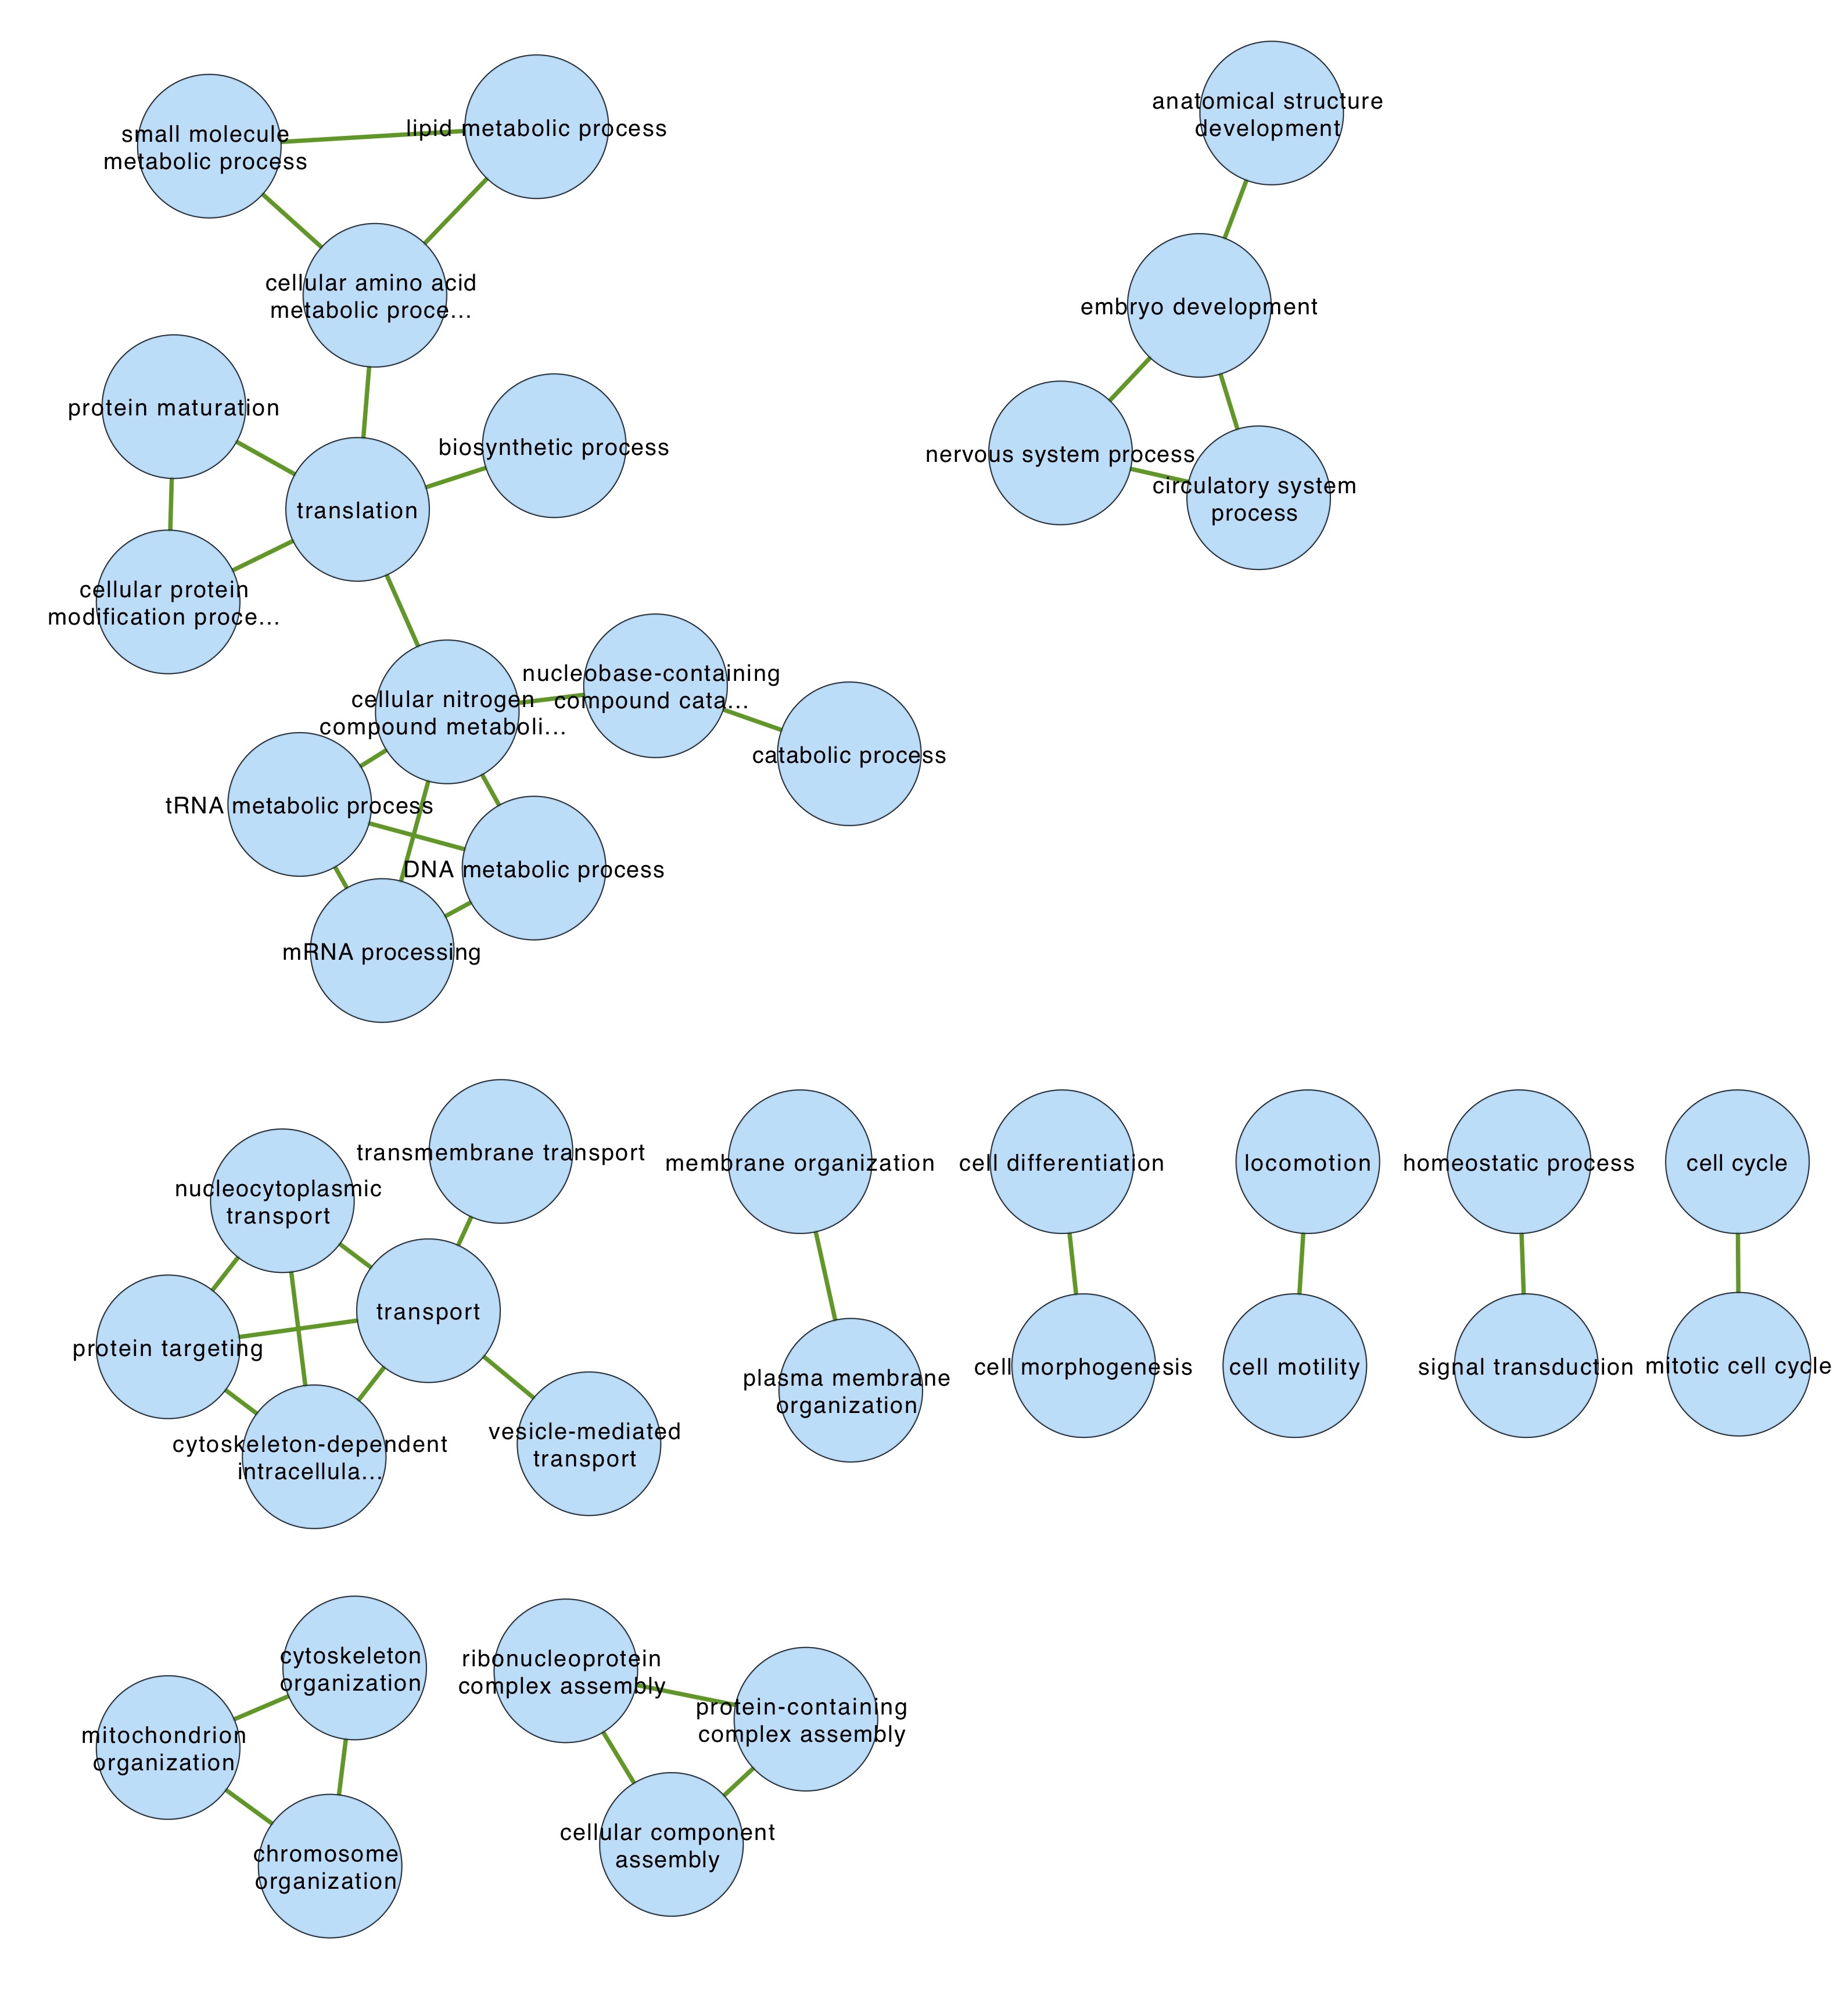 These smaller clusters of GO slim terms seem a lot easier to interpret than the non-GO slim clusters above
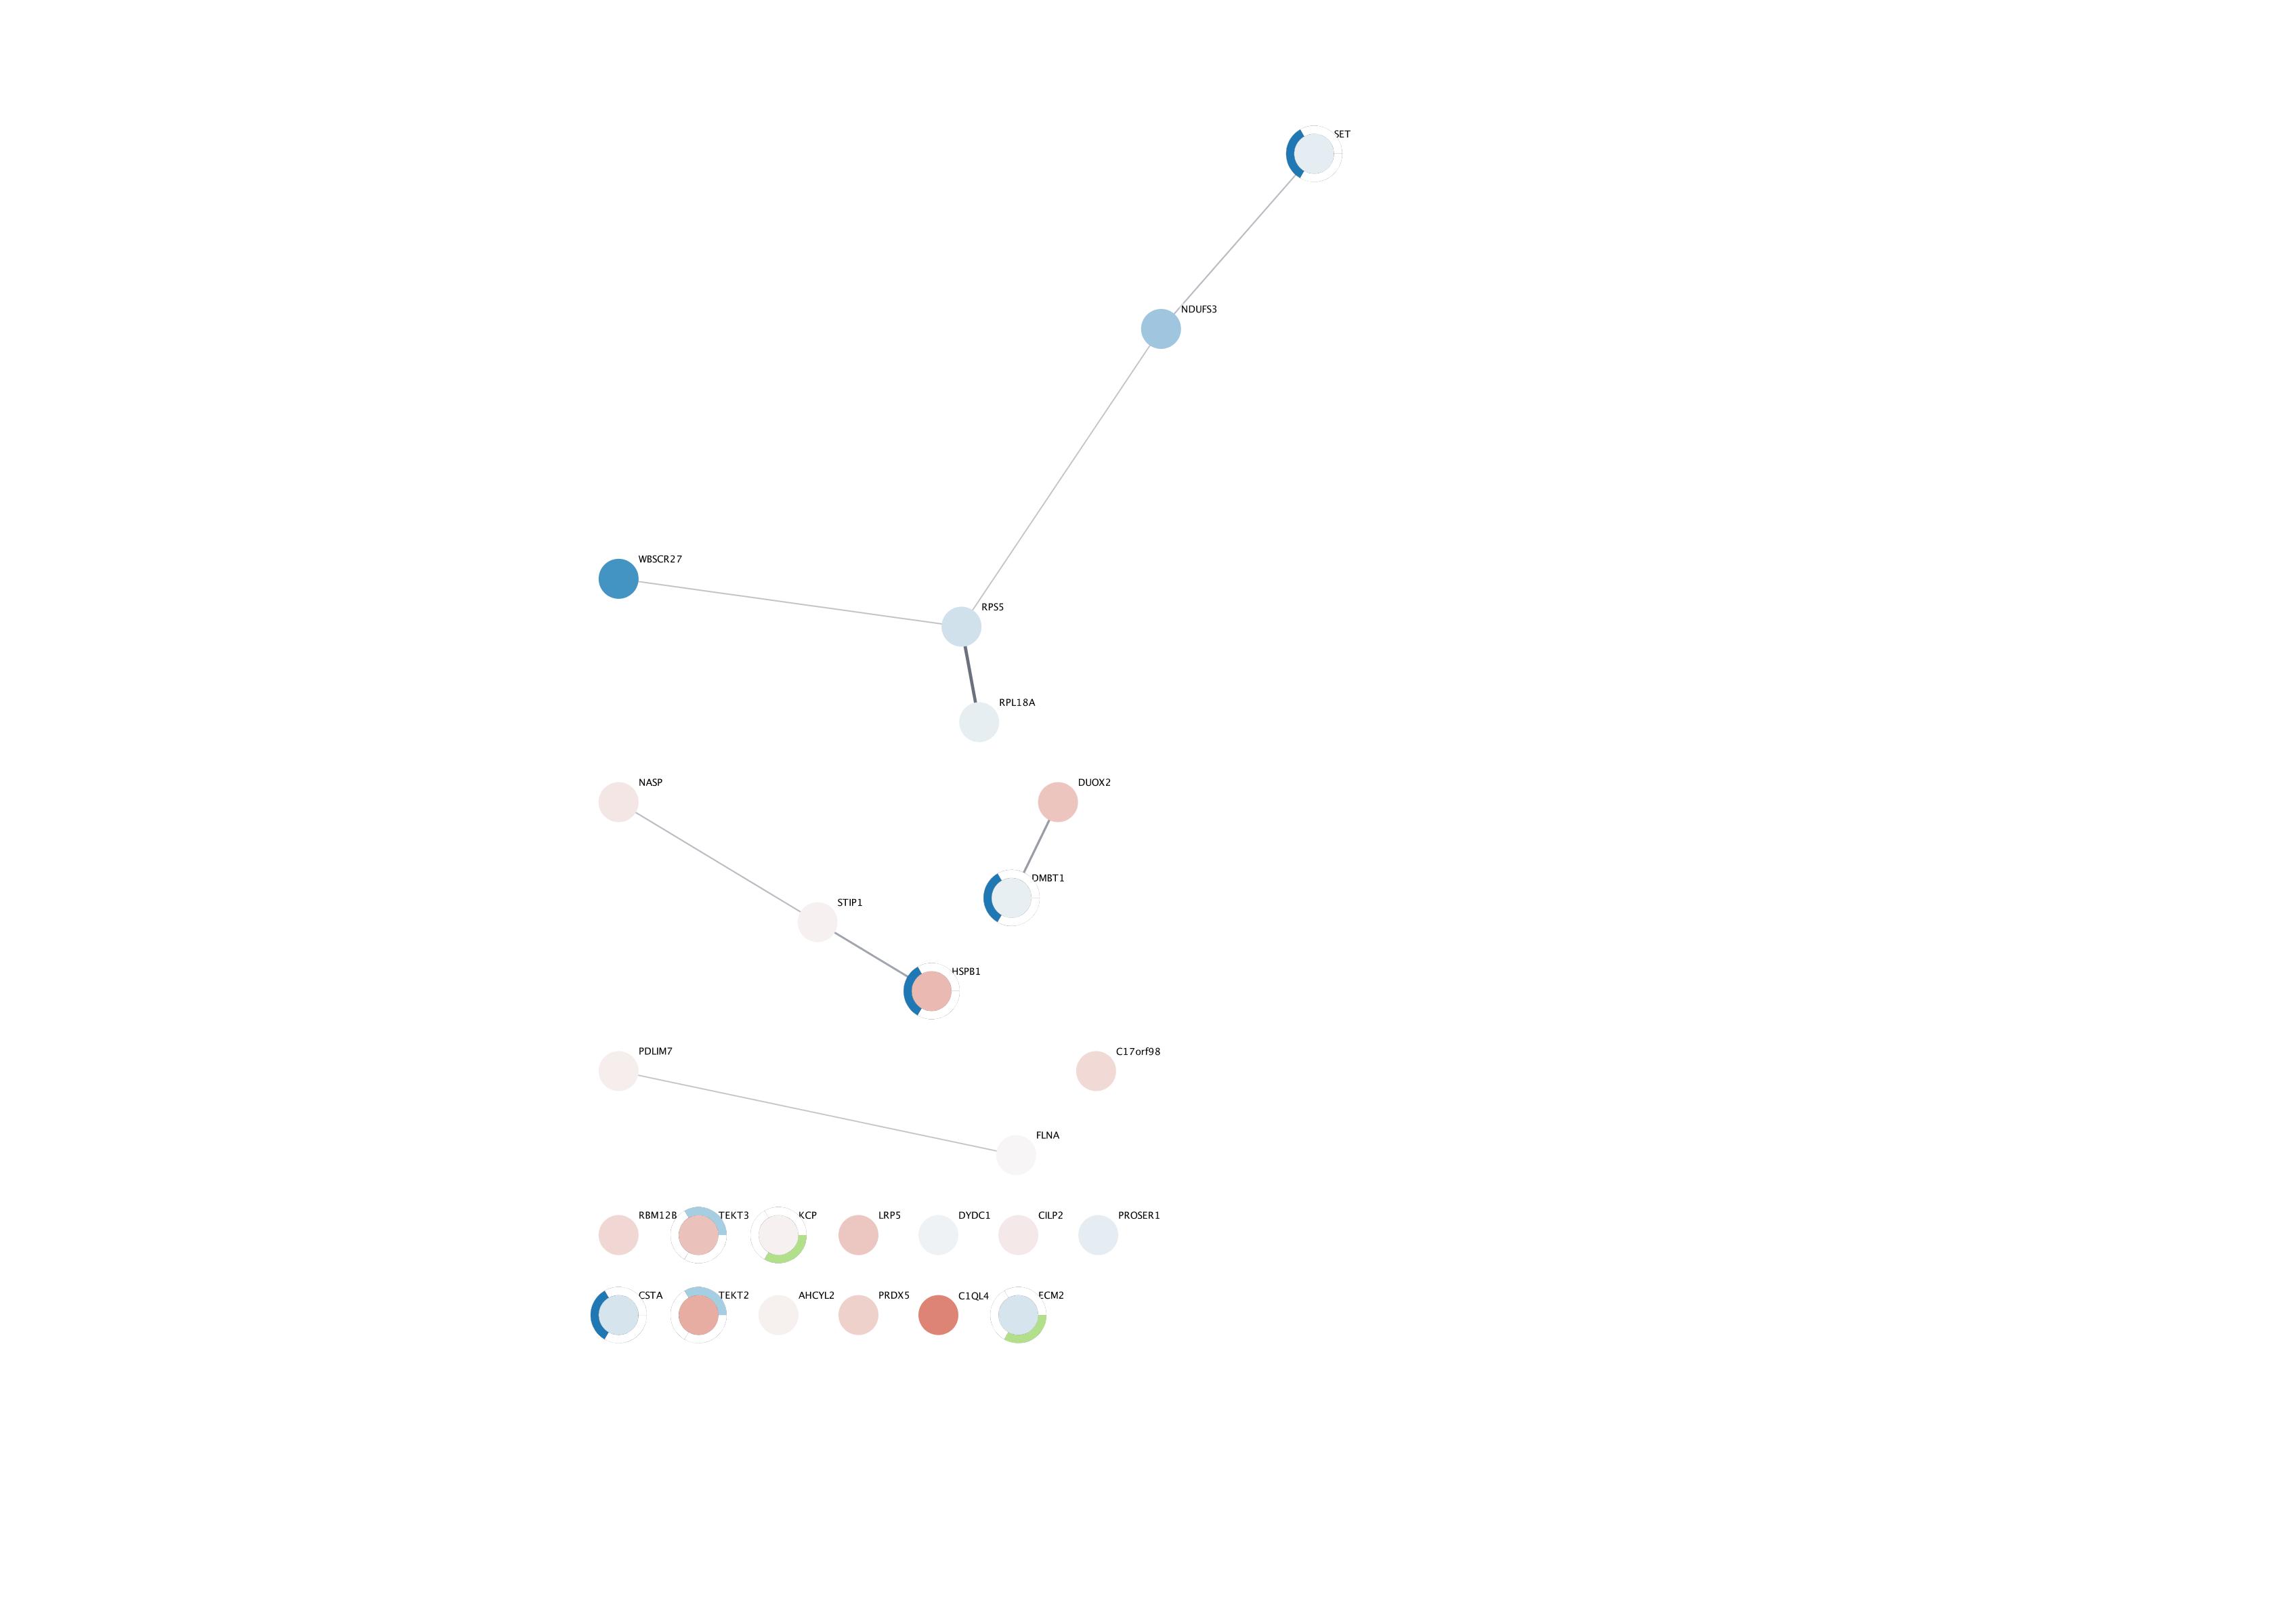
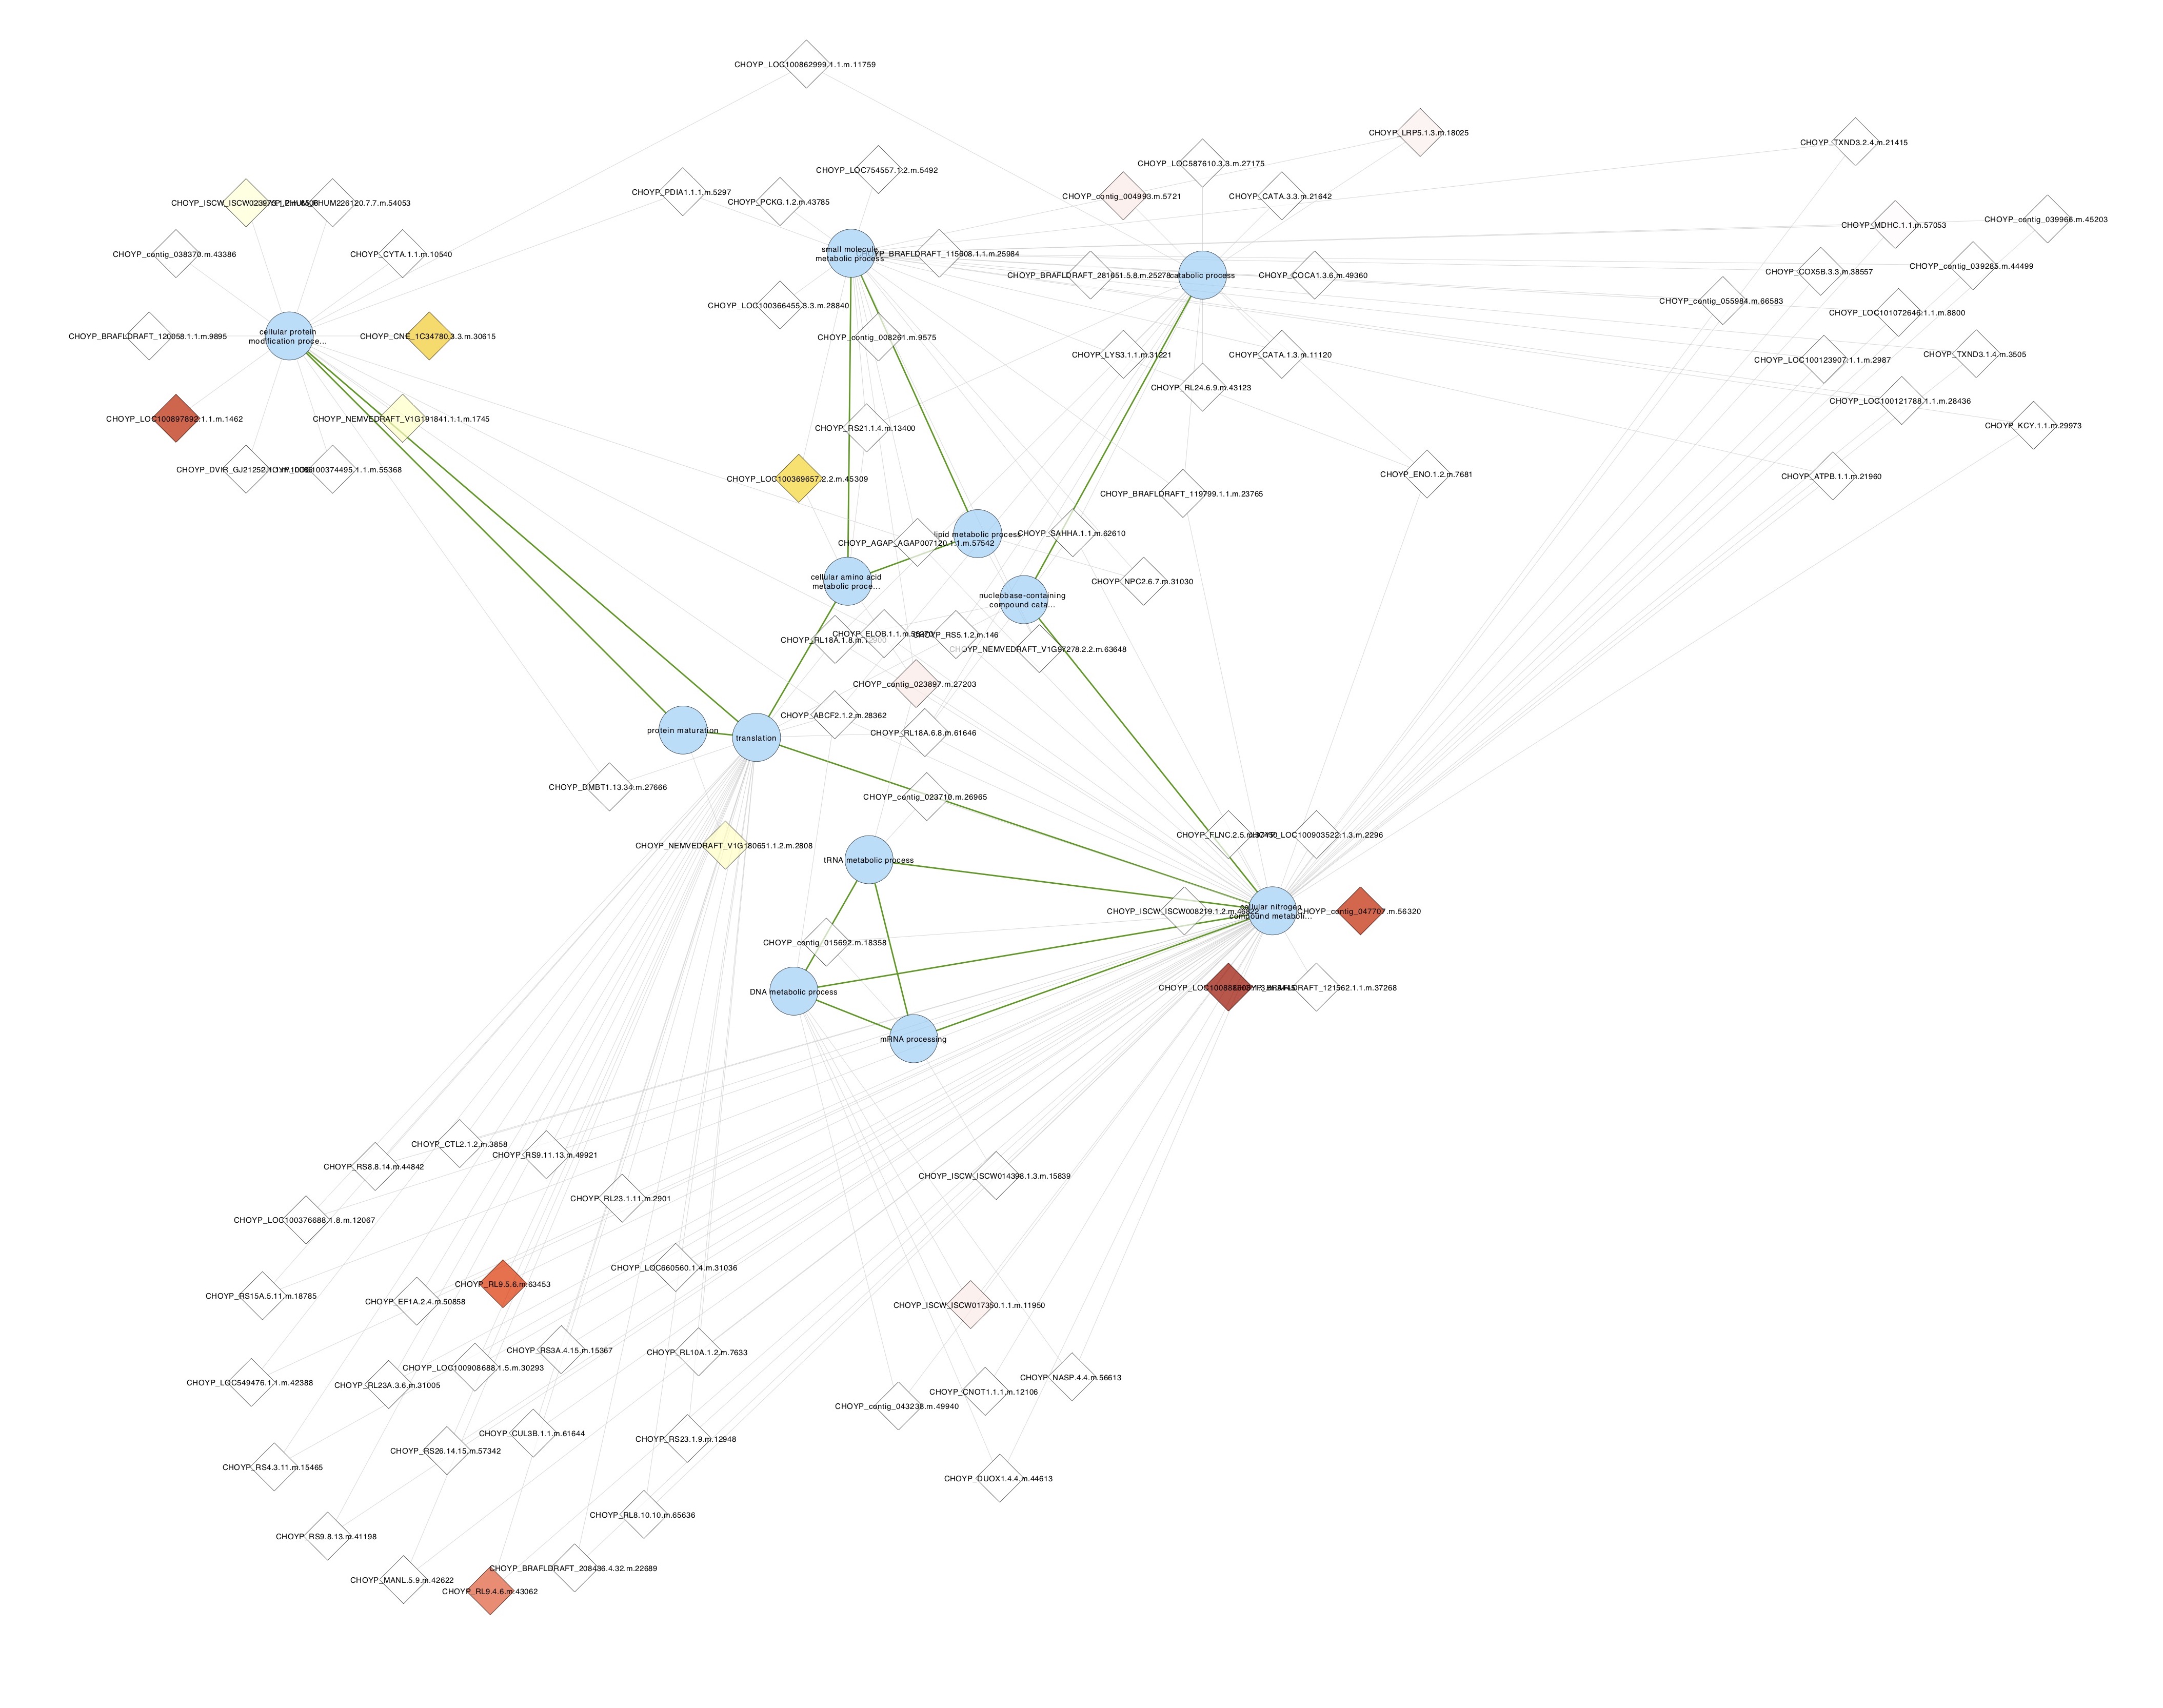
 - For one modules that I’m calling metabolism, I selected all proteins containing any of these terms and made a new network from that
-
I colored nodes by Day 13 log FC.
- I exported the networks as a figures and save the cystoscape session OysterProteomicsNetworkAnalysis.cys
Conclusions :
- GO slim terms seem to cluster into more easy-to-interpret groups than non-GO slim terms
- The Day 13 log FC network does not show many changing proteins
- Maybe the ASCA selection is too stringent? Or the temperature effect was just overpowered by the time effect so ASCA missed some proteins affected by temperature?
- I can try this analysis on all proteins showing same-day logFC between temperatures of 1 or more, or based on ChiSq. pvalue =< 0.1.