Geoduck Broodstock experiment
- Finished making list of all samples we’ve obtained so far
- It is in our FFAR team drive under Geoduck_rearing_PtWhitney -> 2018_Fall_Broodstock:
- MasterSampleTracker_Geoduck2018-2019
- Started Broodstock log datasheet to combine all broodstock data (e.g. mortality, observations, etc.)
- will combine this info with log
- Kaitlyn is helping to populate the log
Oyster Proteomics
Goal: make focused network diagrams of proteins affected by temperature throughout development
- need list of affected proteins
- Made a file of proteins with ASCA loadings values > abs(0.025) for time effect, temp effect, and their interaction (see lines 260-275 of ASCA_avgNSAFvals_AllProteins.Rmd). The table contains protein ID, temp PC2 loadings, time PC1 and 2 loadings sum, and temp x time PC1 and 2 loadings sum. There are 341 proteins in this list.
- Get the log FC and proportions pvals for these proteins (to be used as network node attributes)
- The log FC and pvalues can be used for coloring the nodes in the network and to compare networks between time points
- I had previously calculated log FC and pvalues of each time point relative to Day 0. R code: TotNumSpec_plus1_ratioFC_Pval.Rmd and data file generated: sumNUMSPECSTOT_plus1_ratioFC_logFC_pval.csv
- I merged the fold change and pvalue data with the ASCA proteins and their loadings values (code: line 34 in ASCA_proteinNetworkAnalysis_withGO.R)
- The log FC and pvalues can be used for coloring the nodes in the network and to compare networks between time points
- Get the relationships between proteins (to be used as network edges)
- get their associated GO terms and download GO relationship table (under Interactive Graph tab, click link that says ‘Download Cytoscape XGMML file for offline use’) from Revigo that can be uploaded as a network file in Cytoscape
- I merged the ASCA protein fold change and pvalue data with the uniprot mapping data to get all GO terms associated with these proteins (code: lines 37-54 in ASCA_proteinNetworkAnalysis_withGO.R
- there are 1190 unique GO terms associated with these proteins (see data file ASCA_all_GOterms.csv). These need to be slimmed so that the network is not too busy.
- get their associated GO terms and download GO relationship table (under Interactive Graph tab, click link that says ‘Download Cytoscape XGMML file for offline use’) from Revigo that can be uploaded as a network file in Cytoscape
Slimming GO terms
I used GSEABase in R and the getOBOCollection() and goSlim() function to get a readable list of GOSlim generic terms and an estimate of how many of my GO terms fit into the GOSlim BP terms. The code is in ASCA_proteinNetworkAnalysis_withGO.R lines 58-68. Here is an example of the output:
| Count | Percent | GO Slim Term | GO Slim id |
|---|---|---|---|
| 40 | 2.2123894 | reproduction | GO:0000003 |
| 7 | 0.3871681 | mitotic cell cycle | GO:0000278 |
| 15 | 0.8296460 | cell morphogenesis | GO:0000902 |
| 23 | 1.2721239 | immune system process | GO:0002376 |
| 5 | 0.2765487 | circulatory system process | GO:0003013 |
| 11 | 0.6084071 | carbohydrate metabolic process | GO:0005975 |
Although I couldn’t figure out how to extract the mapping (e.g. GO term: GO slim term), which I need to in order to connect proteins with GO terms in the network.
Slimming GO terms without losing protein-GO Slim term associations
I next used the R package OntologyX and the ontologyIndex() function to extract GO ancestor, parent, and child terms for my GO terms. I then made a long file with two columns: 1. my GO terms 2. parent, ancestor, or child term. Then I extracted any term in the parent, ancestor, or child term column that was a GO slim term. I ended up with 62 unique GO slim BP terms that 186 proteins map to. There were 220 proteins that did not map to these terms because they only had cellular component or molecular function GO terms. The code is in ASCA_proteinNetworkAnalysis_withGO.R lines 70-200. The resulting list of unqiue GO slim IDs is here: ASCA_all_GOSLIMterms.csv .
In comparing GSEAbase GOslim mapping to the GO slim mapping I did with OntologyX functions, I found that GSEAbase typically maps more GO terms to GO slim terms than I was able to with the OntologyX function (see example table below and line 205 of ASCA_proteinNetworkAnalysis_withGO.R for full table).
Compaing GO slim mapping between GSEAbase and OntologyX:
| GO slim id | GSEA count | OntologyX count |
|---|---|---|
| GO:0000003 | 40 | 1 |
| GO:0000278 | 7 | 3 |
| GO:0000902 | 15 | 3 |
| GO:0002376 | 23 | 10 |
| GO:0003013 | 5 | 1 |
| GO:0005975 | 11 | 12 |
| GO:0006091 | 6 | 4 |
| GO:0006259 | 6 | 8 |
| GO:0006397 | 2 | 2 |
| GO:0006399 | 2 | 2 |
| GO:0006412 | 13 | 5 |
| GO:0006790 | 5 | 5 |
| GO:0006810 | 43 | 32 |
| GO:0006914 | 1 | NA |
I could not find an explanation to how GSEA is mapping GO terms to GO slims in the support website to reproduce that mapping. So I decided to just go with the ontologyX method for now.
Using REVIGO to get term-term relationships
- need GO term-GO term network file
- REVIGO:
- I uploaded ASCA_all_GOSLIMterms.csv to Revigo.
- I selected medium slimming and clicked start.
- I downloaded the .xgmml file from the interactive graph tab.
- REVIGO:
Adding protein-term relationships to term-term relationships to make edge attribute file
- Cytoscape:
- I loaded the REViGOmedium_ASCA_all_GOSLIMterms.xgmml file into cytoscape.
- I exported the network file as a .sif (ASCA_GOslim.sif)
- Excel:
- opened ASCA_GOslim.sif file in excel
- I opened ASCA_all_proteins_GOSLIMterms_uniprot.csv (generated by lines 225 in ASCA_proteinNetworkAnalysis_withGO.R) in excel
- copied the Entry_name and GOslimTerm columns and appended them to the .sif file. Added ‘protein-term’ to the ‘type’ column for all appended lines. Highlighted all protein-term lines, removed duplicates, and saved the file.
- the output file is ASCA_GOslim.sif
Making node attribute file
- Excel:
- opened ASCA_all_UNIQUE_proteins_wGSLIM_uniprot.csv (generated by line 231 in ASCA_proteinNetworkAnalysis_withGO.R) in excel
- changed Entry_name column to just name
- appended unique GO slim terms from ASCA_all_GOSLIMterms.csv to the name column
- created a new column ‘type’ which says ‘protein’ for protein lines and ‘term’ for GO slim term lines
- saved the file ASCA_GOslim_node_attrb.csv
Cytoscape Network Mapping
- Cytoscape:
- loaded ASCA_GOslim.sif into cytoscape as a new network.
- imported node attributes file ASCA_GOslim_node_attrb.csv
- I chose organic layout
- colored nodes by log fold change
- colored edges by protein-term (red) or term-term (green) interaction
- I exported networks for day 9 23C and day 9 29C
- saved cytoscape session ASCA_goslim_FCtoDay0.cys
| Day 9 23C network | Day 9 29C network |
|---|---|
 |
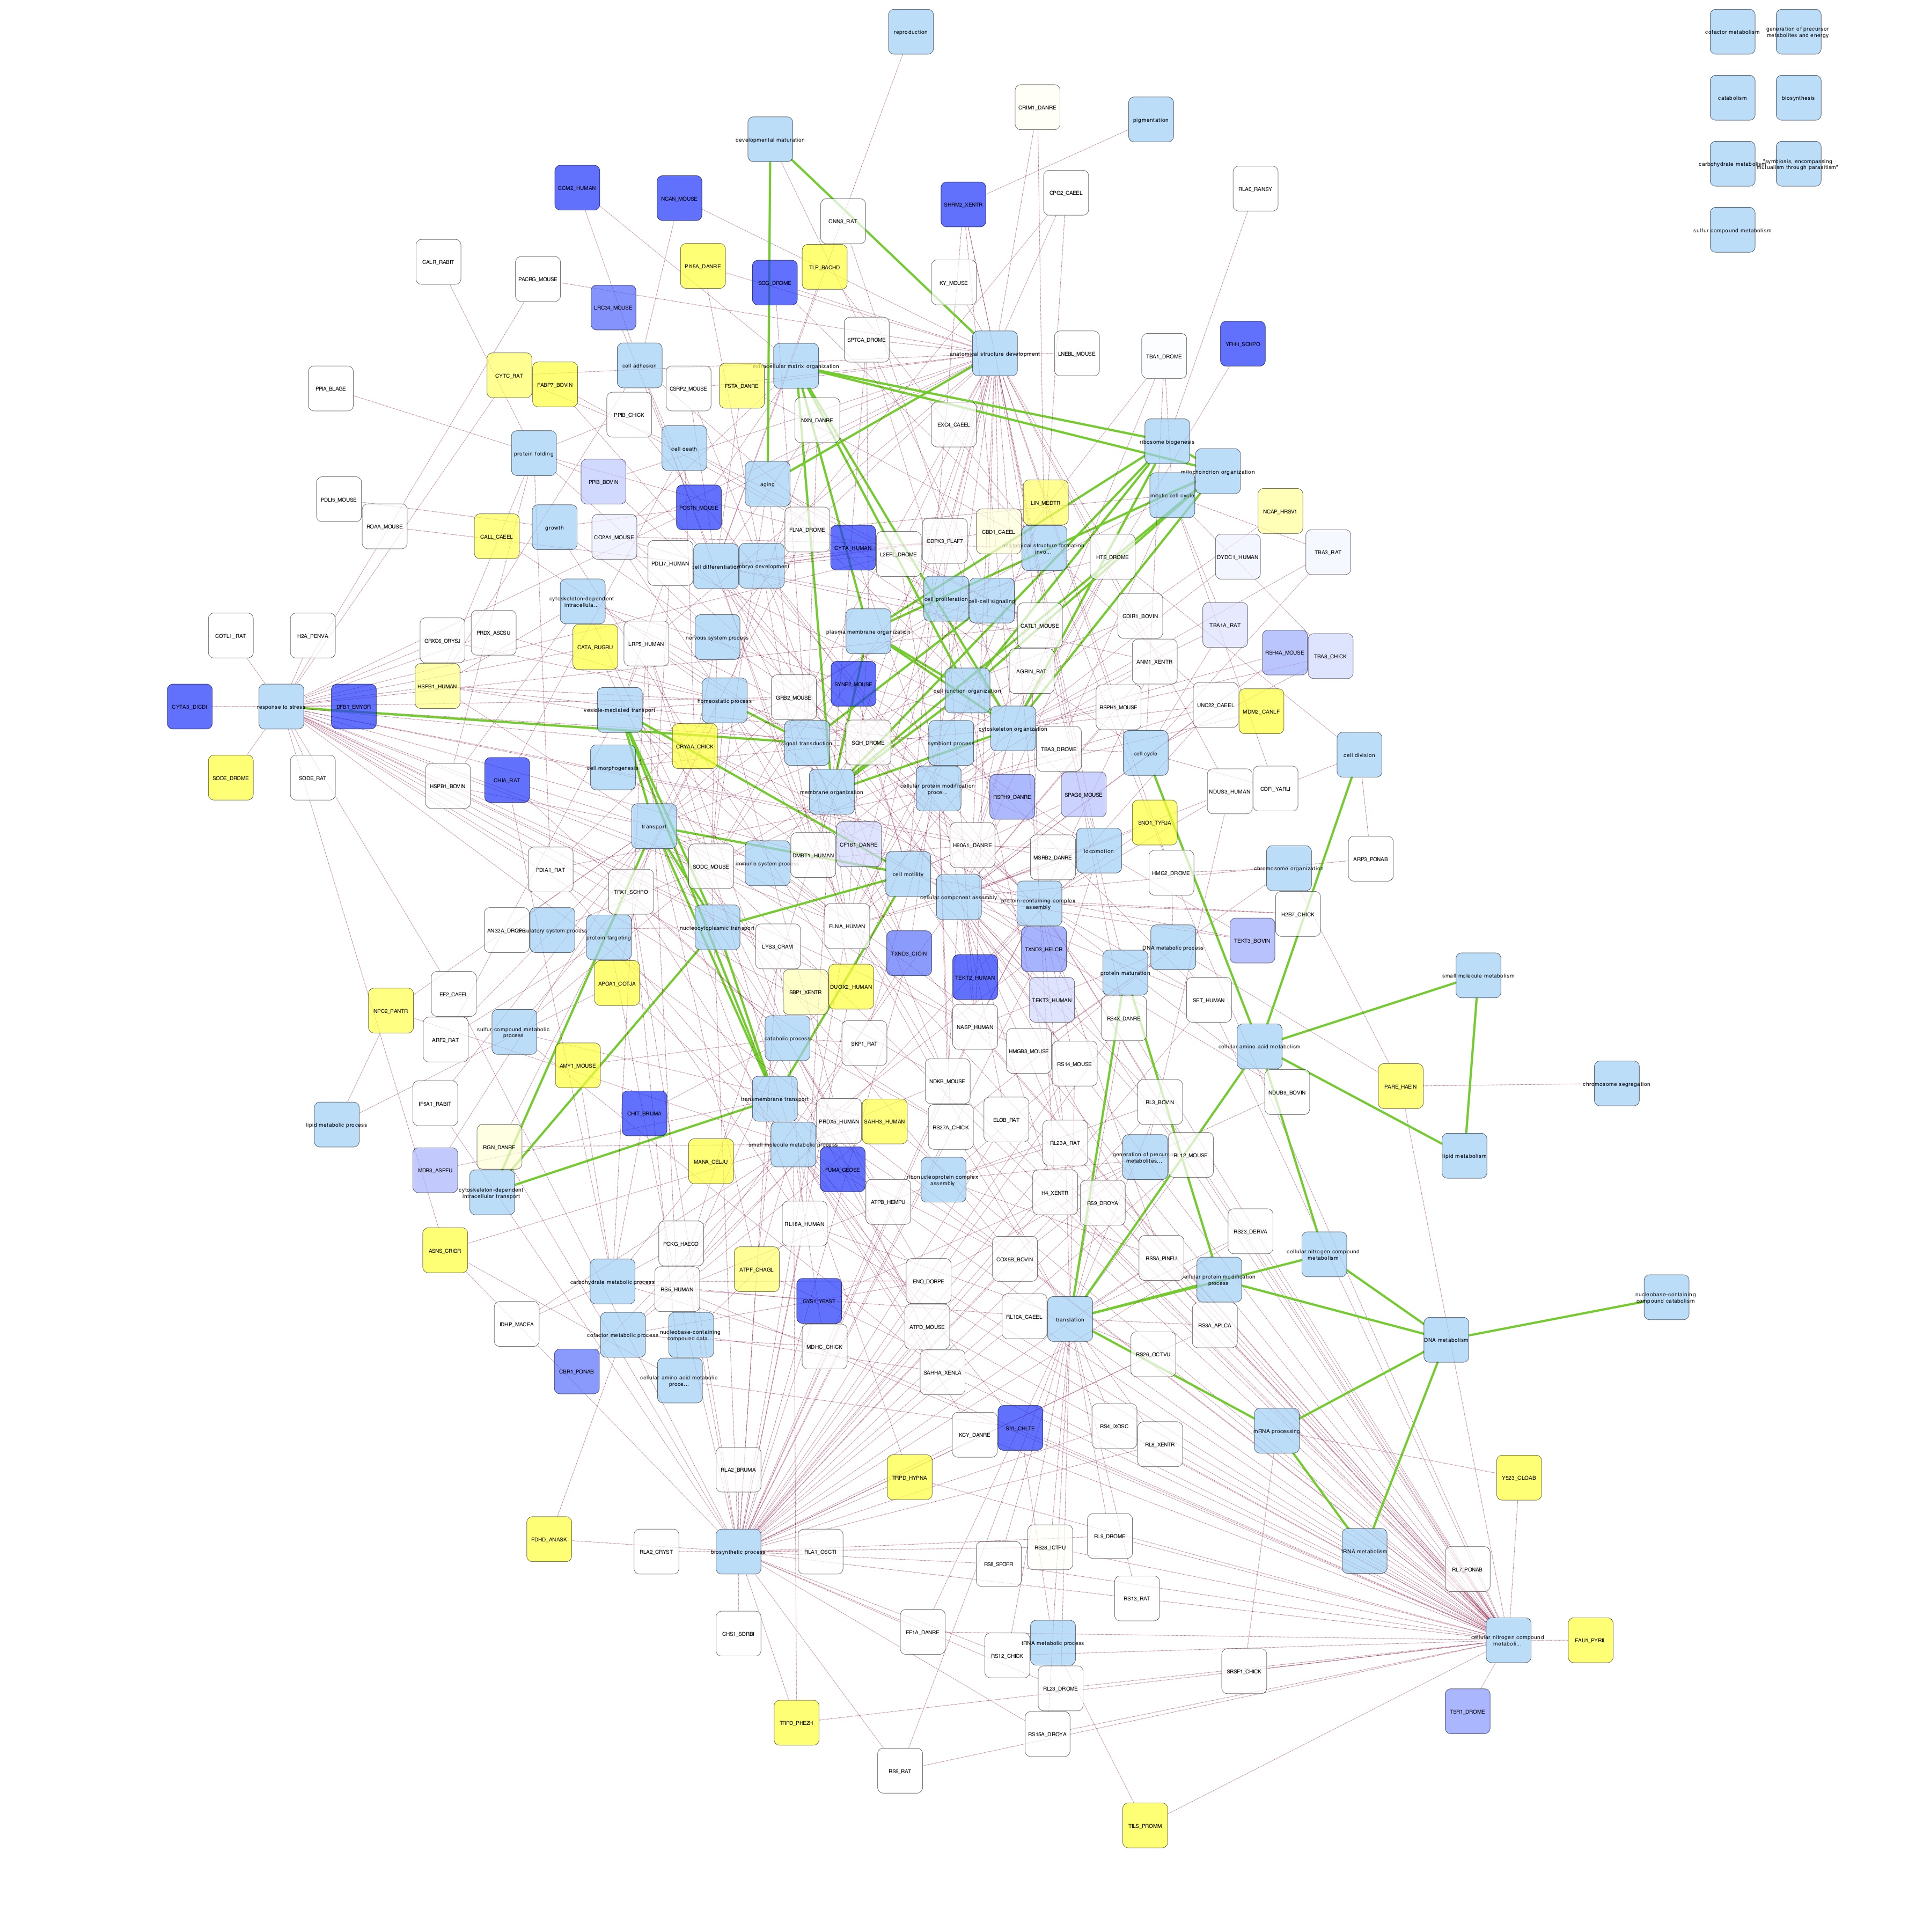 |
CONCLUSIONS:
- networks are too busy
- maybe only select a couple of processes to focus on?
- there are no obvious differences in node color
- perhaps that’s because the foldchanges are relative to day 0, and time had a greater effect on protein abundance than temperature did.
- Need to try to calculate abundance fold change between temperatures on the same day
- perhaps that’s because the foldchanges are relative to day 0, and time had a greater effect on protein abundance than temperature did.
- Some GO slim terms are not connected to anything; at the very least they should be connected to proteins so something with the protein-term mapping is off.
- Need to check that GO Slim terms in protein-GO Slim Terms file match REVIGO’s GO slim terms