I compared NMDS and PCA plots of technical replicate ADJNSAF values in this md file. Rmarkdown here
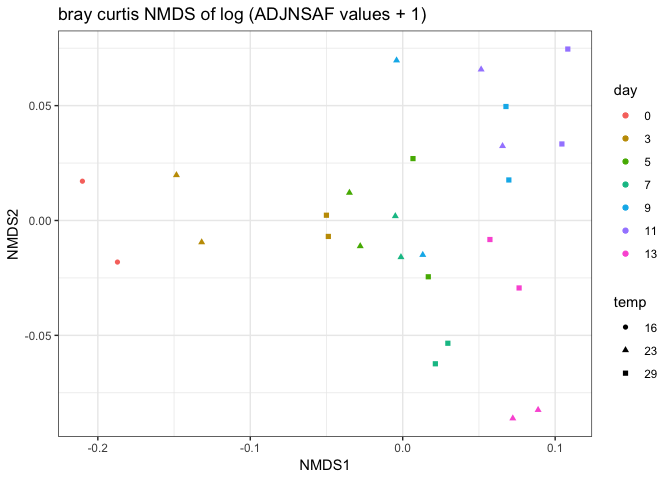
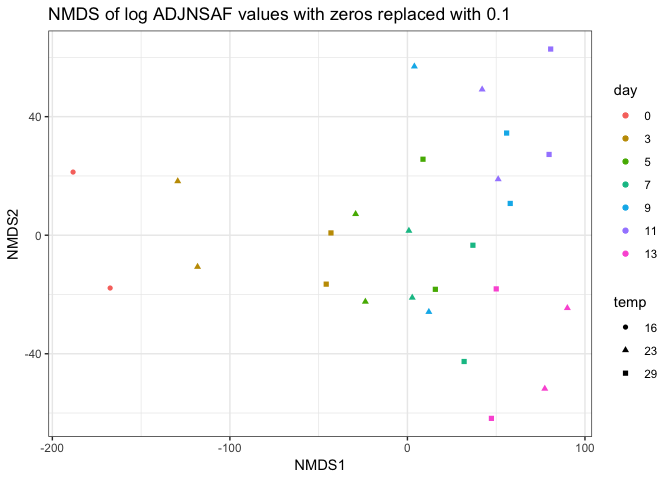 Following Emma’s NMDS analysis with log tranformed ADJNSAF values and using Bray-curtis distance. This looks the same as the plot above which was euclidean distance.
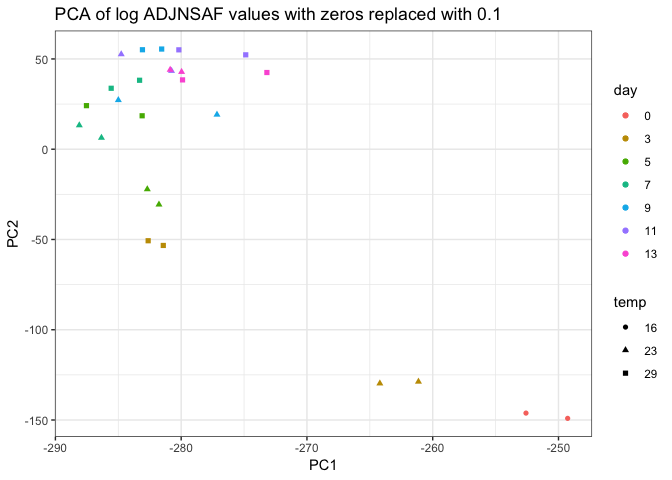
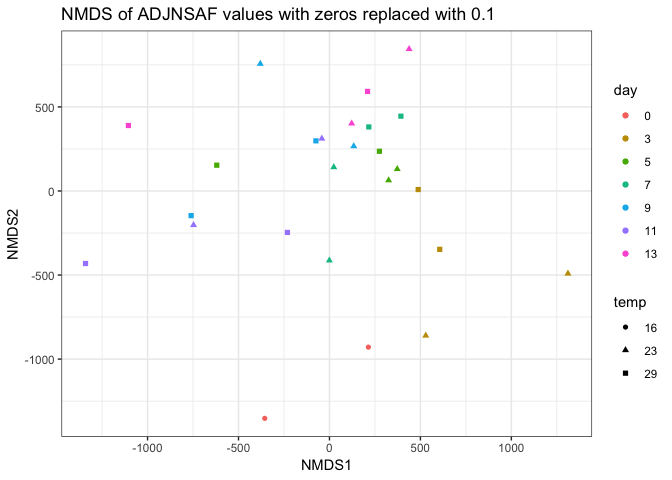
Overall, it seems like the PCAs are a little more informative than the NMDS. I’m wondering why we use NMDS for this analysis as opposed to PCA?
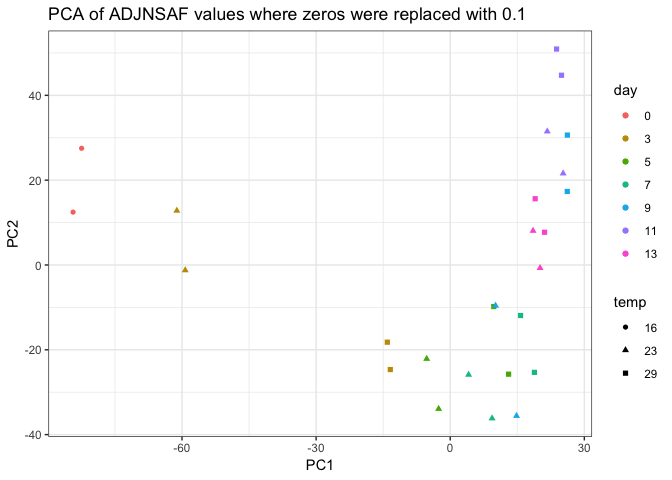
Looking at the PCAs, it’s a little concerning that the technical replicates don’t cluster better, particularly for sample 23C day 9. It seems there may be some unreliably detected proteins between technical replicates (e.g. 0 in one replicate and > 200 in the other), so I will try to go through the data to weed those out if possible.
It’s interesting in the PCA below that some of the 29C proteomes at earlier time points cluster with 23C proteomes of later time points. For example, gold squares with green triangles, green squares with blue triangles, blue squares with purple triangles.
Perhaps there is a a development program that is sped up in the 29C proteomes? Will need to further investigate.