In the methylpy DMRfind code, DMCpGs are collapsed into DMRs if any two are no more than 250bp apart. This is the default setting, but can be changed to any distance specified by the user with the –dmr_max_dist parameter.
Evaluating DMRs with different DMCpG proximity requirements
- Jeong et al 2018 defined methylation island size by comparing:
- the number of methylation islands
- the mean % methylation of methylation islands
What about location of methylation islands? Do the same islands get identified?
Run DMRfind using different proximity requirements each time
- Overview: DMRfind was run on all samples from Day 10 that vary in pH treatment. DMCpG proximity requirements tested were as follows:
- 25bp
- 50bp
- 100bp
- 150bp
- 200bp
- 250bp
- 300bp
- 500bp
- 1000bp
- DMRfind analysis (inc. all files below) can be found here: https://gannet.fish.washington.edu/metacarcinus/Pgenerosa/analyses/20200415
- Script run on Ostrich: 20200415_DMRfind_proximTestA.sh
- Script log file: screenlog.A
- All DMRfind output files end with ‘_collapsed.tsv’
- In this same directory, I had first attempted to run the reidentify-DMR function (script: 20200415_DMRfind_proximTest.sh and log: screenlog.0) but the output files (files ending in ‘_recollapsed.tsv’ did not retain individual sample %methylation for DMRs so I could not run filtering or statistics on this output.
Filter regions and run group stats
- Regions from DMRfind need to be filtered for coverage in 3/4 samples per treatment group. After that, group statistics need to be run to identify regions that show significantly different methylation across treatment groups
- Did all analyses and visualizaitons in this Rmarkdown file: DMRfind_ProxTest.Rmd
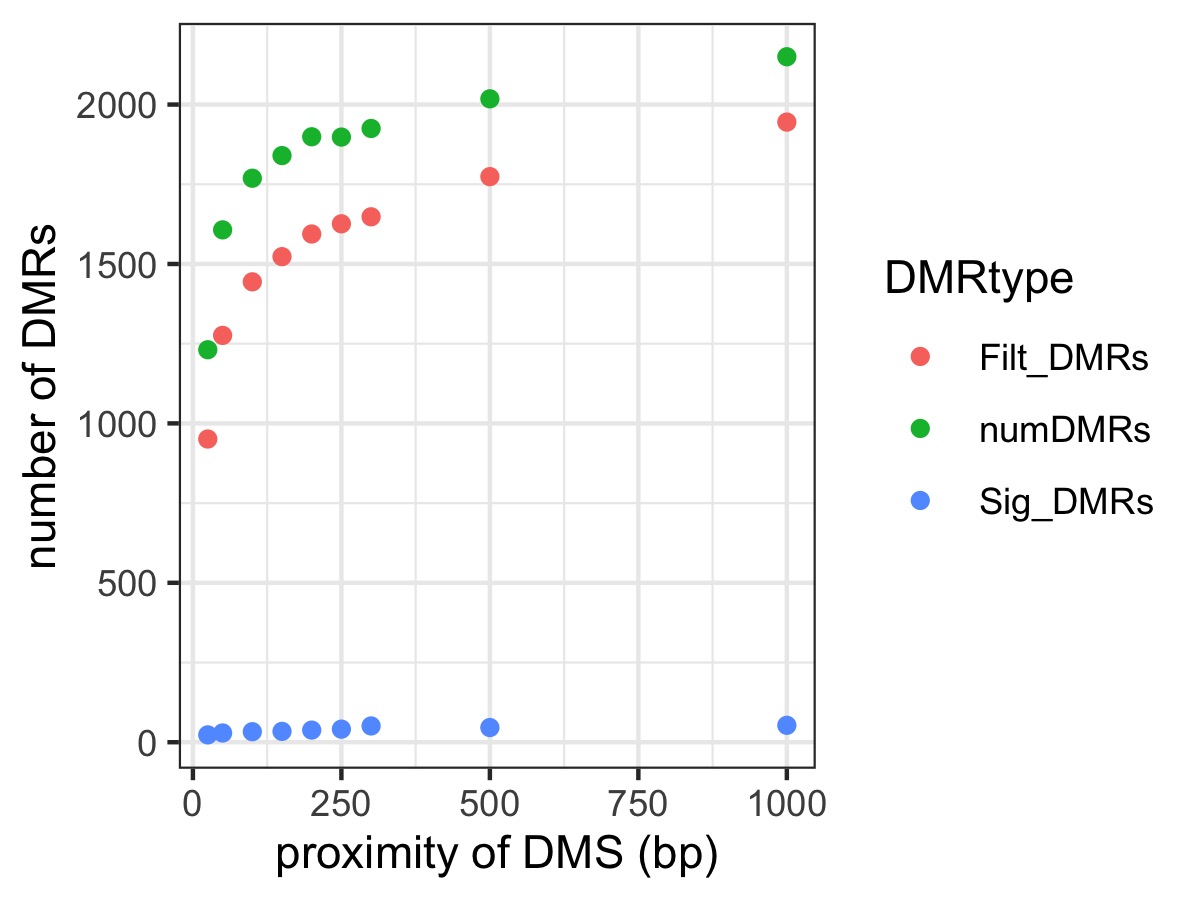
- Scatterplot of the number of DMRs detected at each different DMCpG proximity requirement for regions that were output by DMRfind (“numDMRs”, green), filtered regions that were output by DMRfind (“FiltDMRs”, red), and regions that show significant treatment group effect (“SigDMRs”, blue)
Plots below are of DMRs that showed a significant treatment group effect
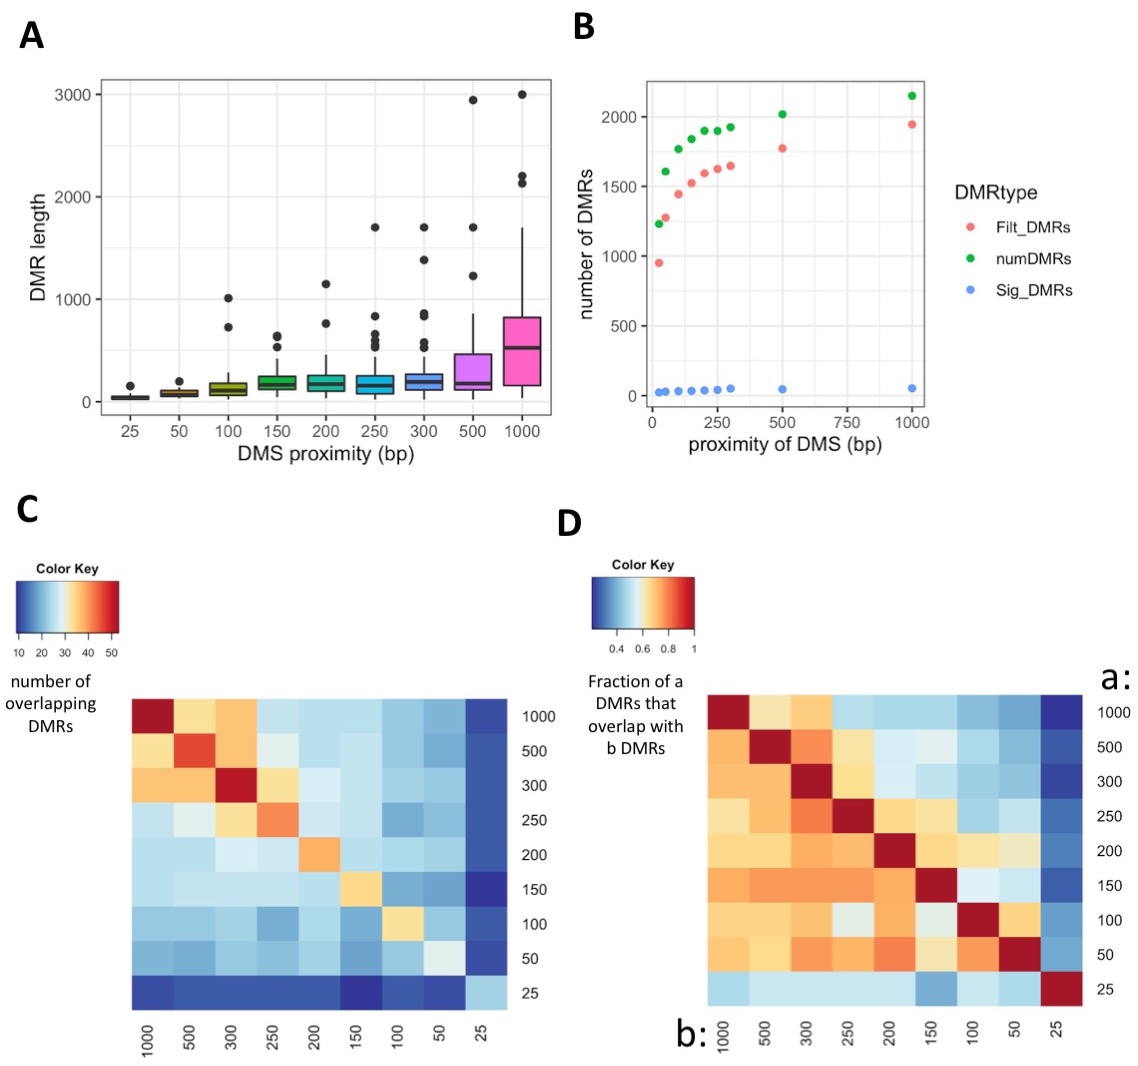
- DMR length distribution among different DMCpG proximity requirements.

Determine intersection of DMR outputs
To check for overlap among DMRs identified in each iteration, I ran bedtools intersect in this jupyter notebook:
- 20200416_ProxTest_DMRcompare.ipynb
- I generated the following matrix from the jupyter notebook output
- Overlap of DMRs across different DMCpG proximity requirements. Value refers to the number of DMRs overlapping between each contrast.
-

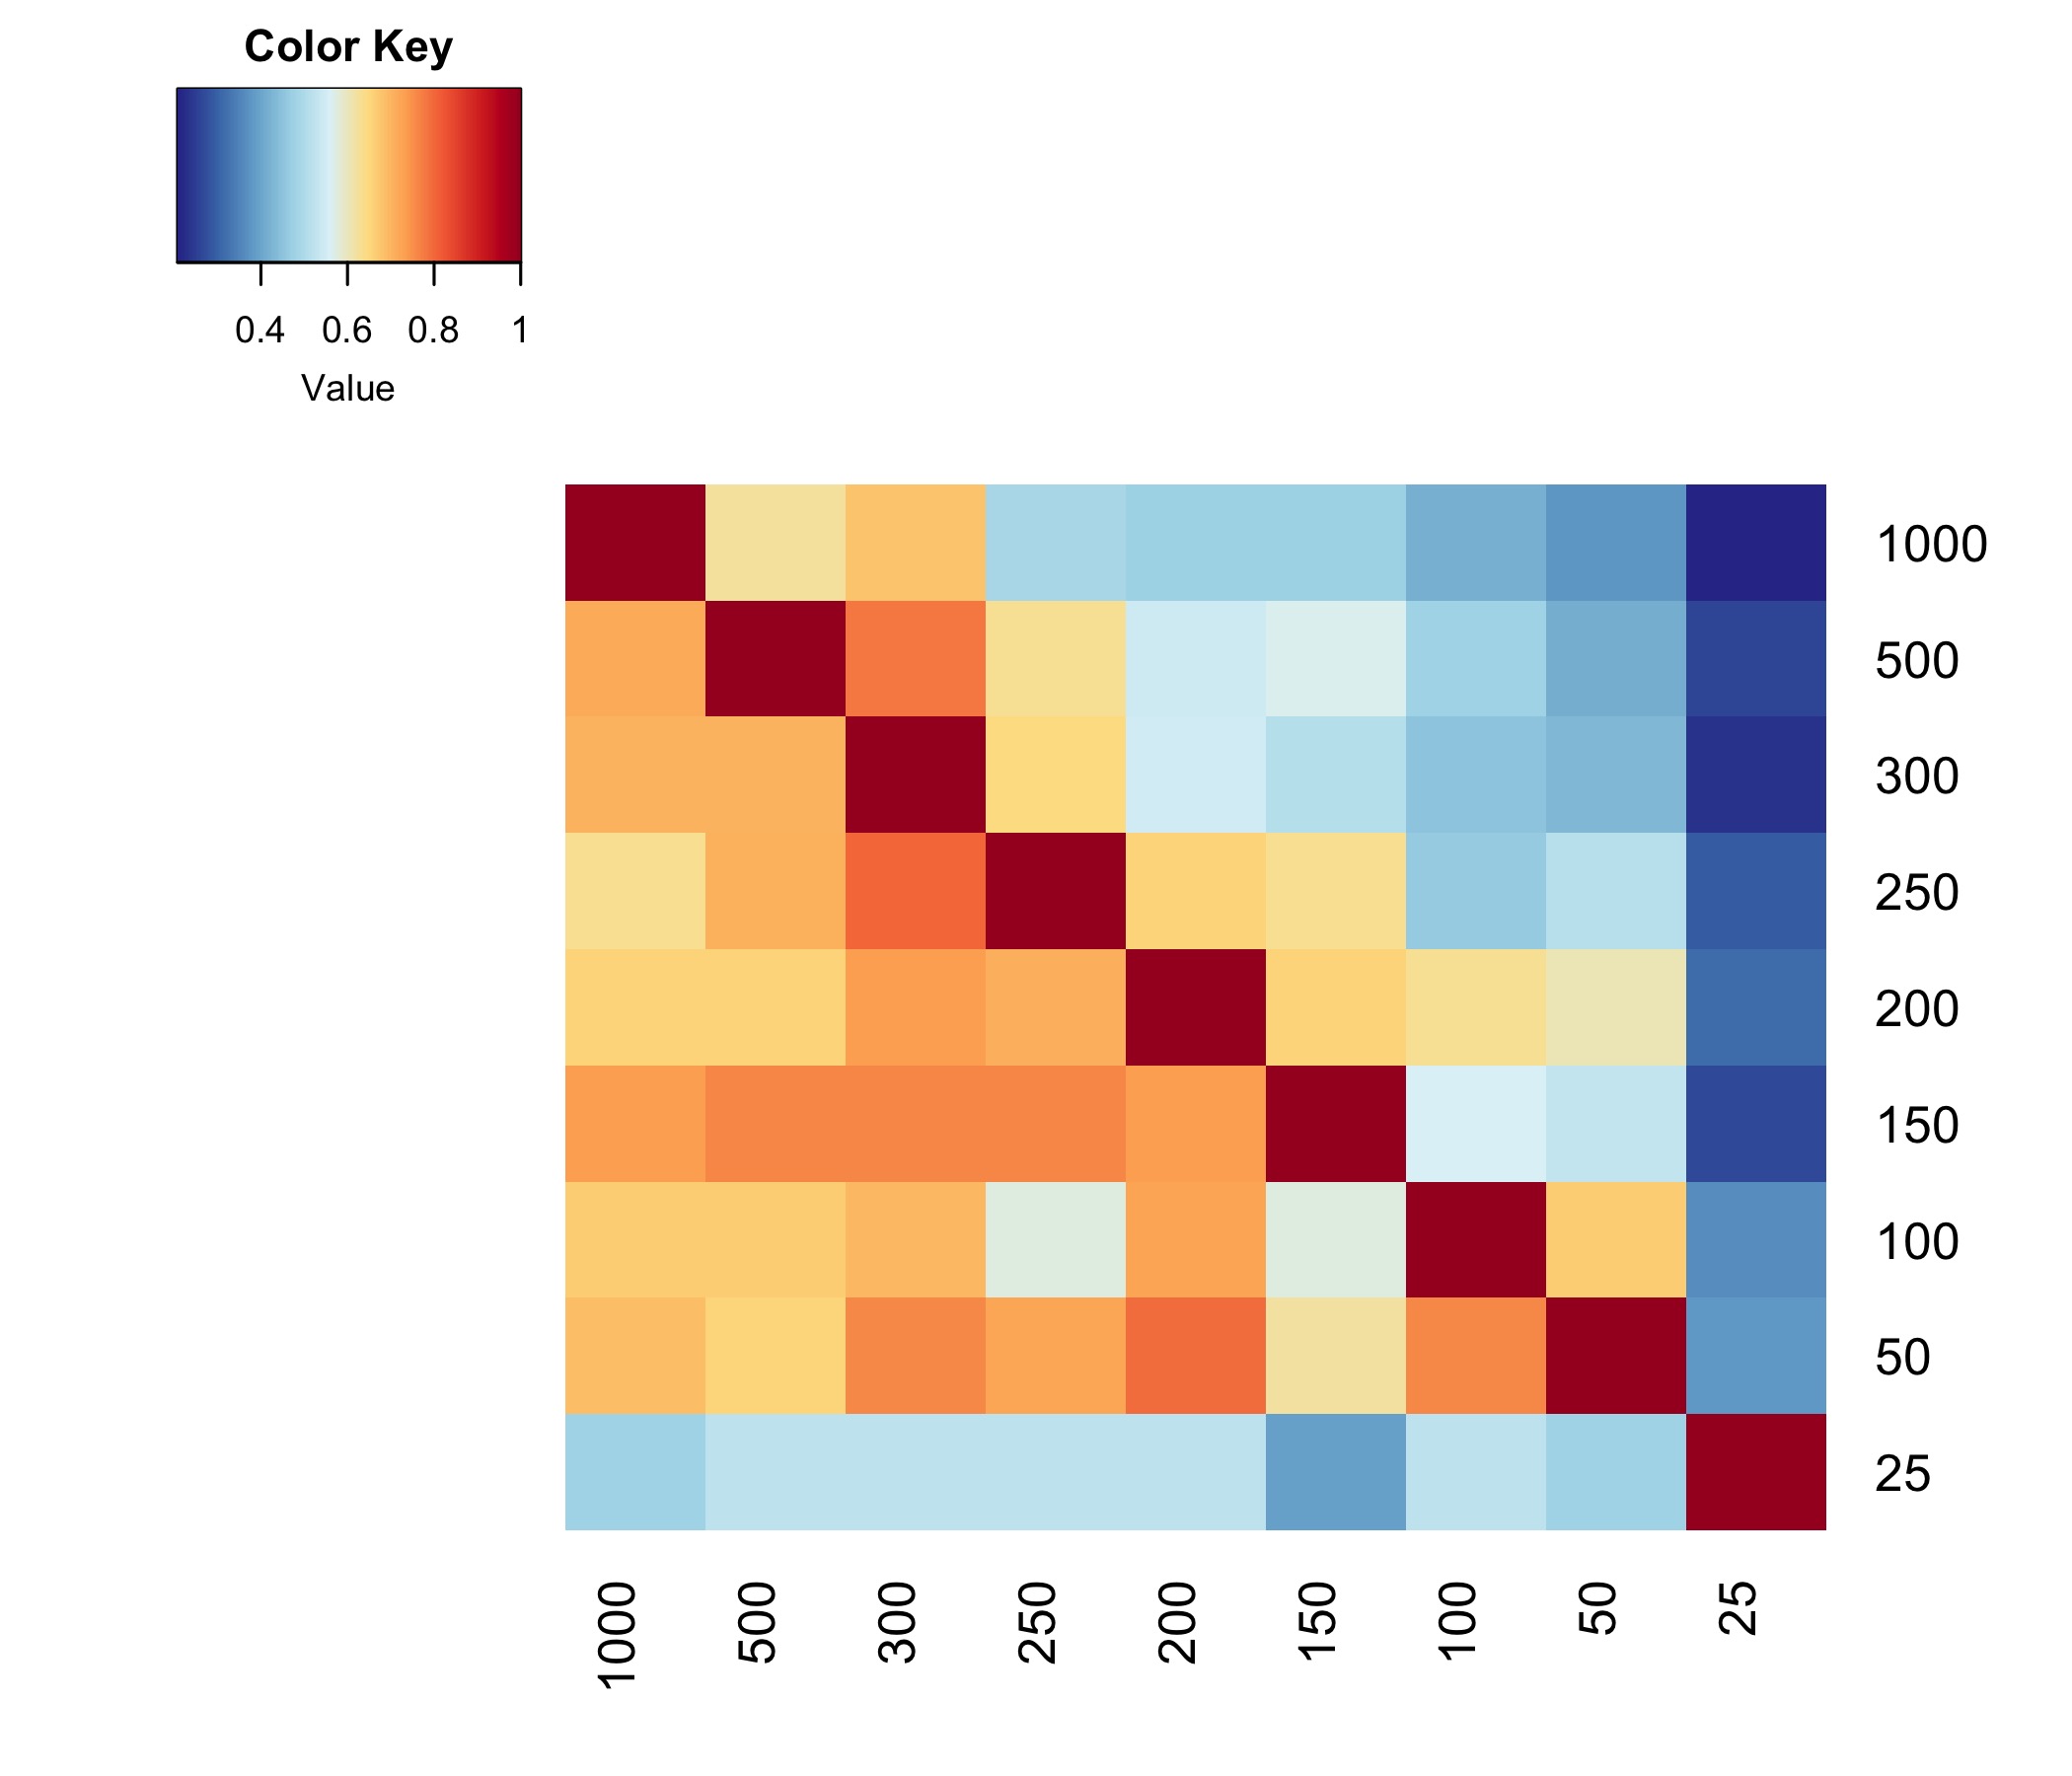
- Fraction of DMRs overlapping across different DMCpG proximity requirements. This is annotated below in the summary figure
-
- Summary Fig:
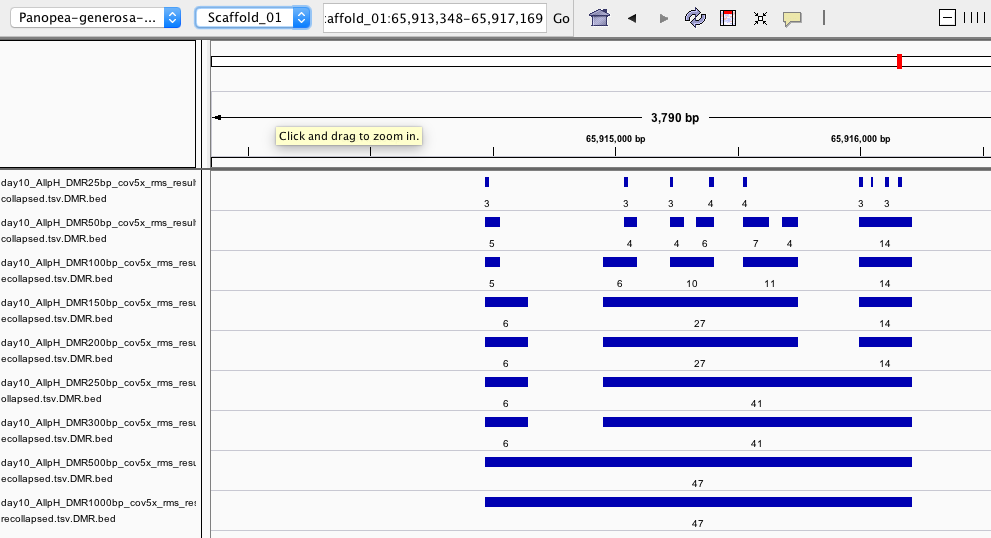
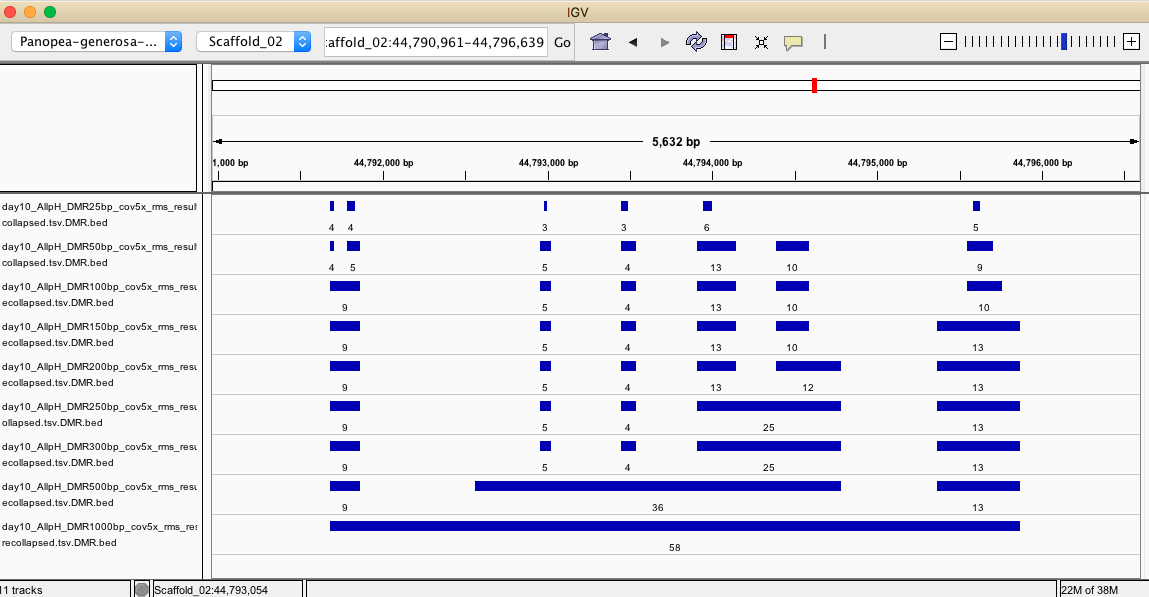
IGV
- IGV session to visualize regions identified by each iteration:
- https://github.com/shellywanamaker/Shelly_Pgenerosa/blob/master/analyses/20200415/IGV/igv_session.xml
- Below are some examples of regions identified from each DMRfind iteraction but have not been filtered for coverage across samples within treatment groups or for showing a significant treatment effect

- Here are some examples of significant DMRs identfied in R analysis compared to unfiltered DMRs
Rationale to look at DM regions:
-
Thought from Yupeng about the default ‘–dmr_max_dist’ parameter in DMRfind being 250bp (mentioned in this issue): “250bp is arbitrary to some degree but it can be justified by the observation that the methylation status of CpGs within ~200bp are correlated”
- methylation levels of neighboring CpGs are highly correlated
- more evidence here: We found that correlation of methylation levels between neighboring (i.e., adjacent CpG sites in the genome that are both assayed) CpG sites decreased rapidly to approximately 0.4 within ∼400 bp, in contrast to sharp decays noted within 1 to 2 kb in previous studies with sparser CpG site coverage. SO less than 400bp shows correlation > 0.4
- here’s more evidence https://www.sciencedirect.com/science/article/pii/S0888754319300175: they found CpGs within < 50bp so high methylation correlation
- individual CpG likely do not have a large impact on epigenetic function on their own, but rather through modification that involves serval loci (exception: khamis et al 2017)
- Regional DNA methylation levels are correlated with the expression levels of nearby genes
- methylation gain is associated with stable silencing of nearby genes (bird, 2002).
- DEGs were consistently more likely to be located near DMRs than DMLs (Aryee et al 2014)
-
requiring differentially methylated CpGs to be very close in proximity can lead to the identification of small, fragmented DMRs that may actually belong to the same region https://academic.oup.com/biostatistics/article-abstract/20/3/367/4899074?redirectedFrom=fulltext
-
The differences at an individual site could be small but may expand and persist across a region, which is a candidate DMR. Therefore, DMRs are determined with greater statistical power and are more informative. When comparing methylomes with weak differences, extending the testing scale from one C to a cluster of neighboring Cs can reduce the number of hypothesis tests to improve the statistical power [91] (e.g., BiSeq takes spatial correlation into account in DMR prediction [115]). Weak DNA methylation differences can be better measured by estimating the standard deviation from biological replicates to obtain more robust P values [91]. (From https://epigeneticsandchromatin.biomedcentral.com/articles/10.1186/s13072-016-0075-3)
- Why WGBS: WGBS is its ability to assess the methylation state of nearly every CpG site, including low-CpG-density regions, such as intergenic ‘gene deserts’, partially methylated domains and distal regulatory elements. (https://epigeneticsandchromatin.biomedcentral.com/articles/10.1186/s13072-016-0075-3)
Conclusions
This is arbitrary and since we don’t really understand the biological significance of methylation in invertebrates, we are going off vertebrate concepts.