Group stats on transformed data
Because I can’t easily generate the methylated and unmethylated C counts from which the percent methylation was generated (since I applied a parameter that summed counts from nearby bases and some other filtering parameters; see DMRfind script), Brent suggested transforming the data to make it more normal and then apply ANOVA.
- To transform proportion data, you use arcsin(sqrt(%)).
- I transformed the percent methylation DMR data in all 4 comparisons using this Rmarkdown script MCmax30_asinT_groupStats.Rmd and Rproj MCmax30_asinT_groupStats.Rproj.
- the percent methylation DMR data had already been filtered for those showing coverage across at least 3/4 individuals/group
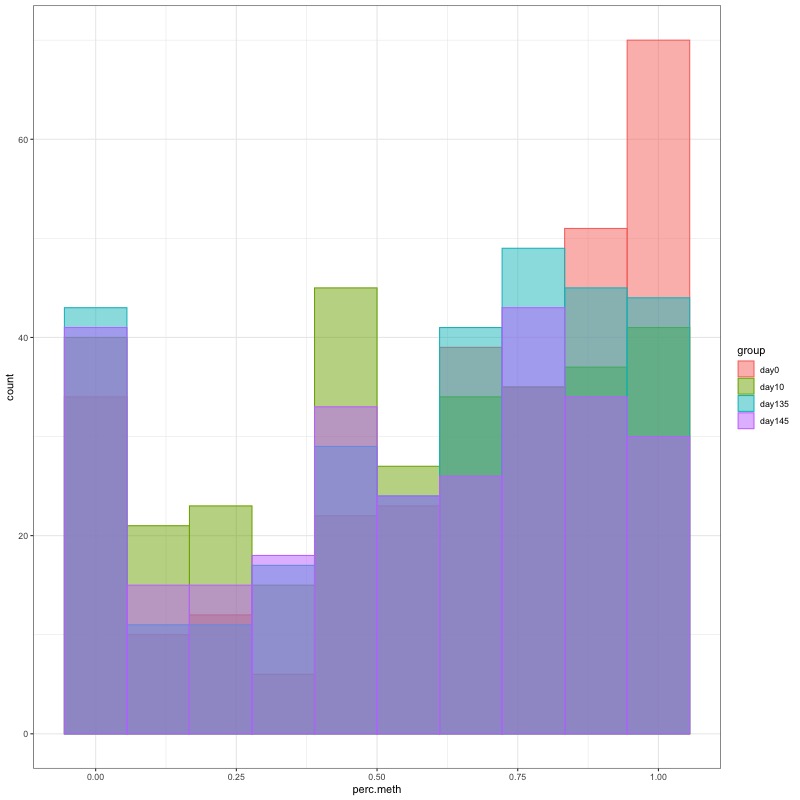
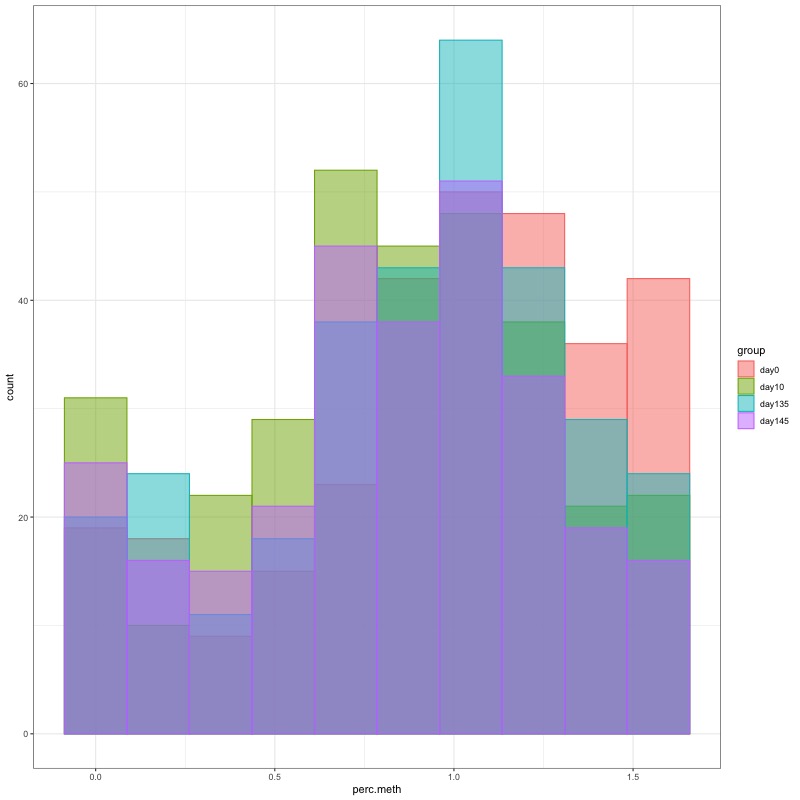
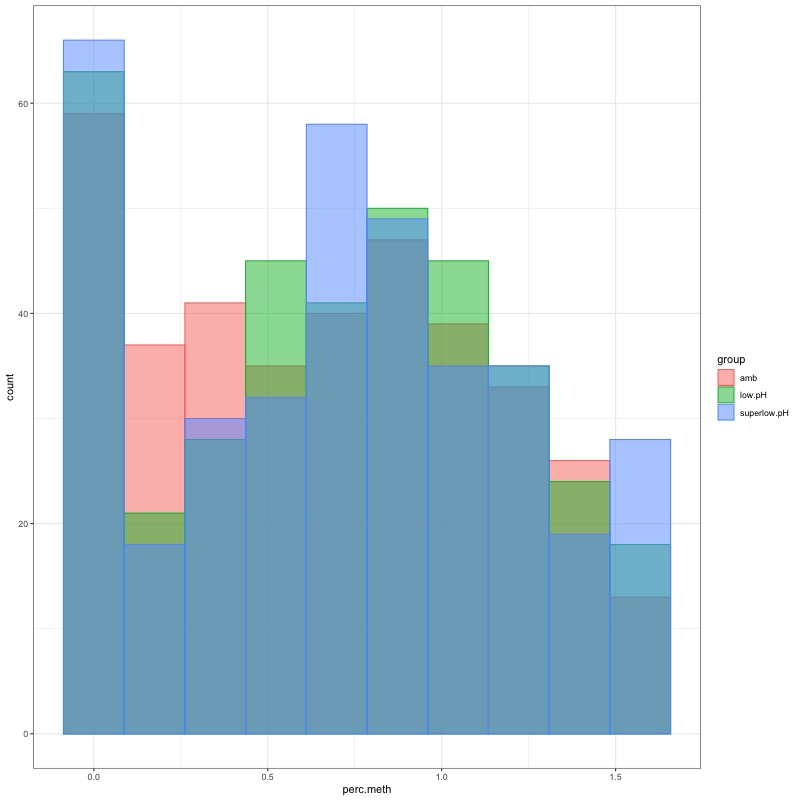
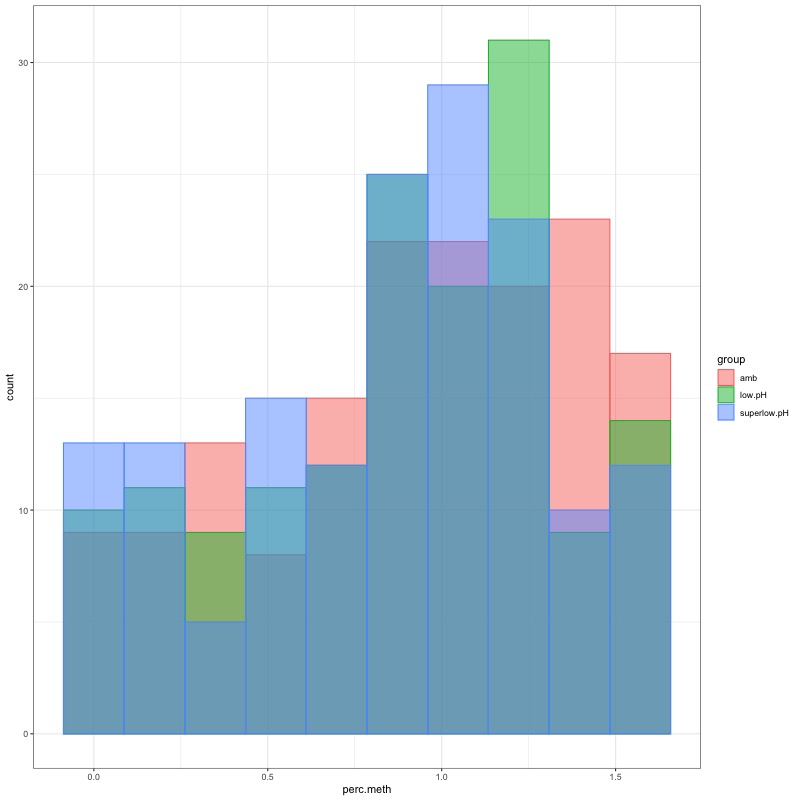
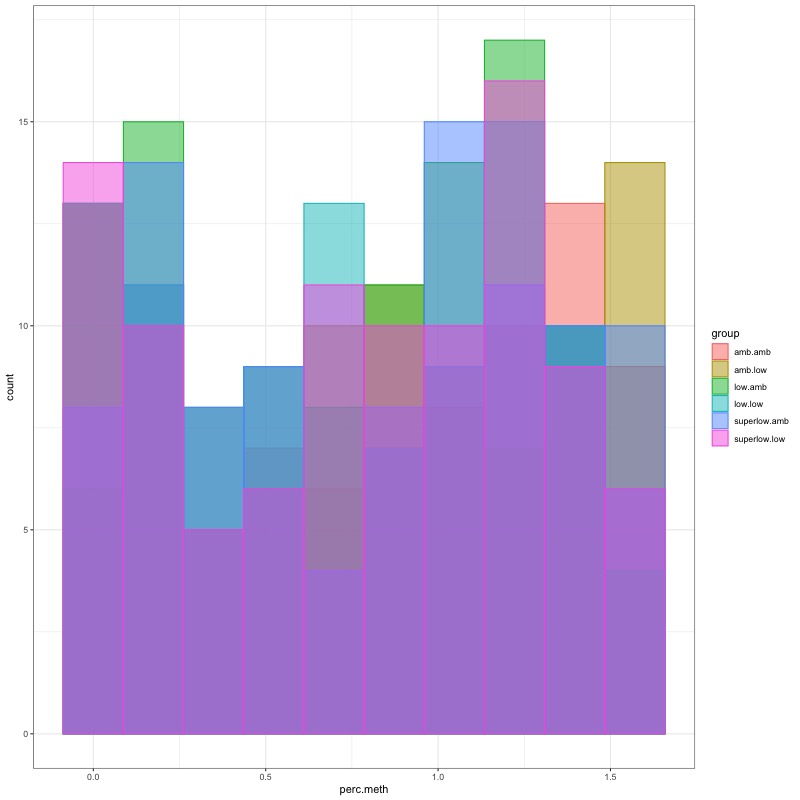
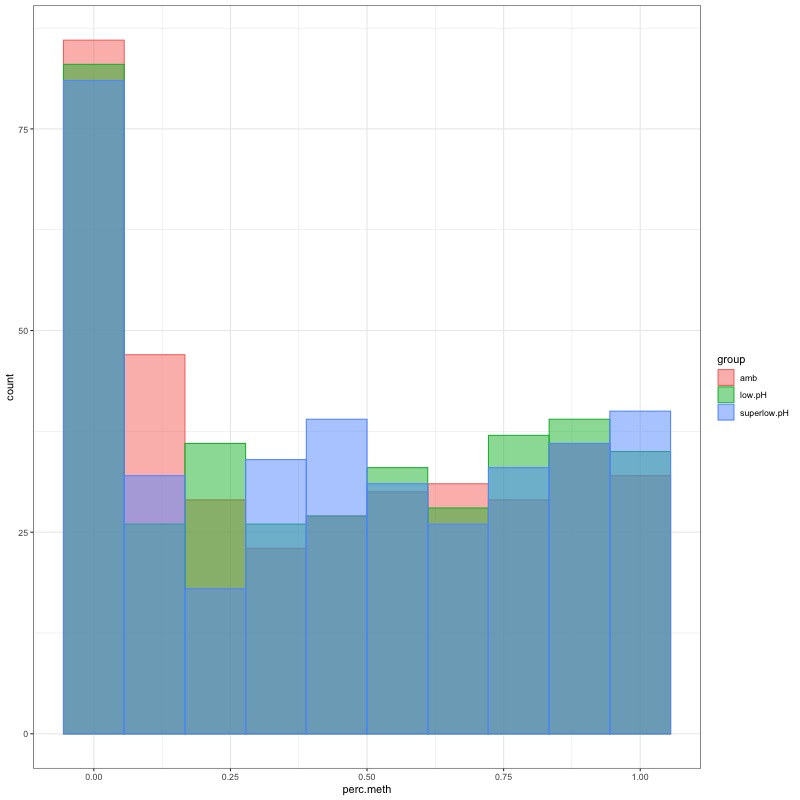
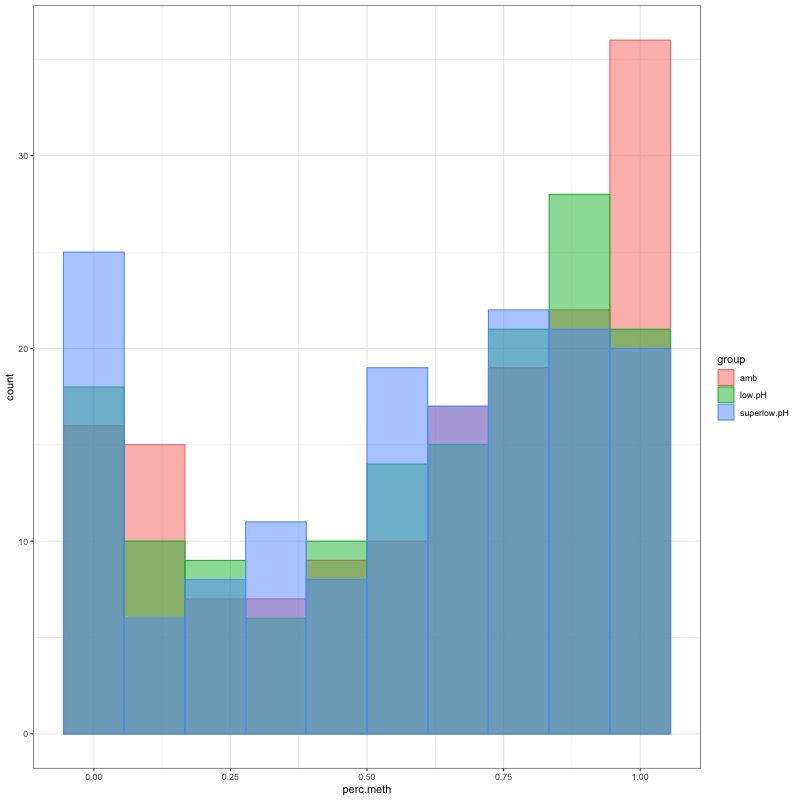
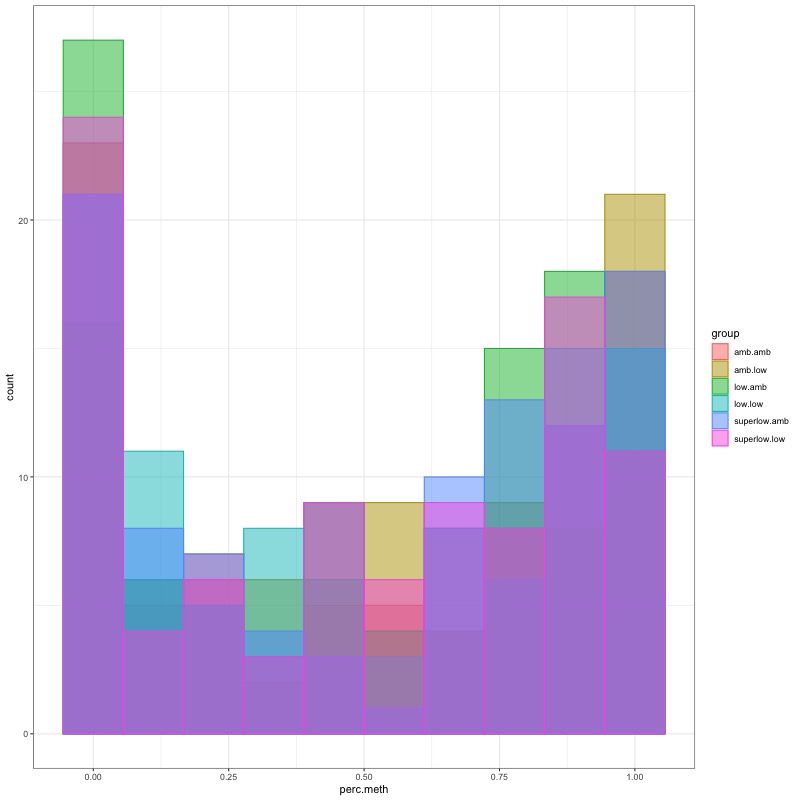
- Distribution of % methylation for each experimental group in each comparison before and after tranformation looked like this:
- all day 10 samples BEFORE:
- all day 135 samples BEFORE:
- all day 145 samples BEFORE:
- Ran ANOVA and saved summary result tables:
- all ambient samples: amb_MCmax30_aov_modelsumm.csv
- day 10 samples: day10_MCmax30_aov_modelsumm.csv
- day 135 samples: day135_MCmax30_aov_modelsumm.csv
- day 145 samples: day145_MCmax30_aov_modelsumm.csv
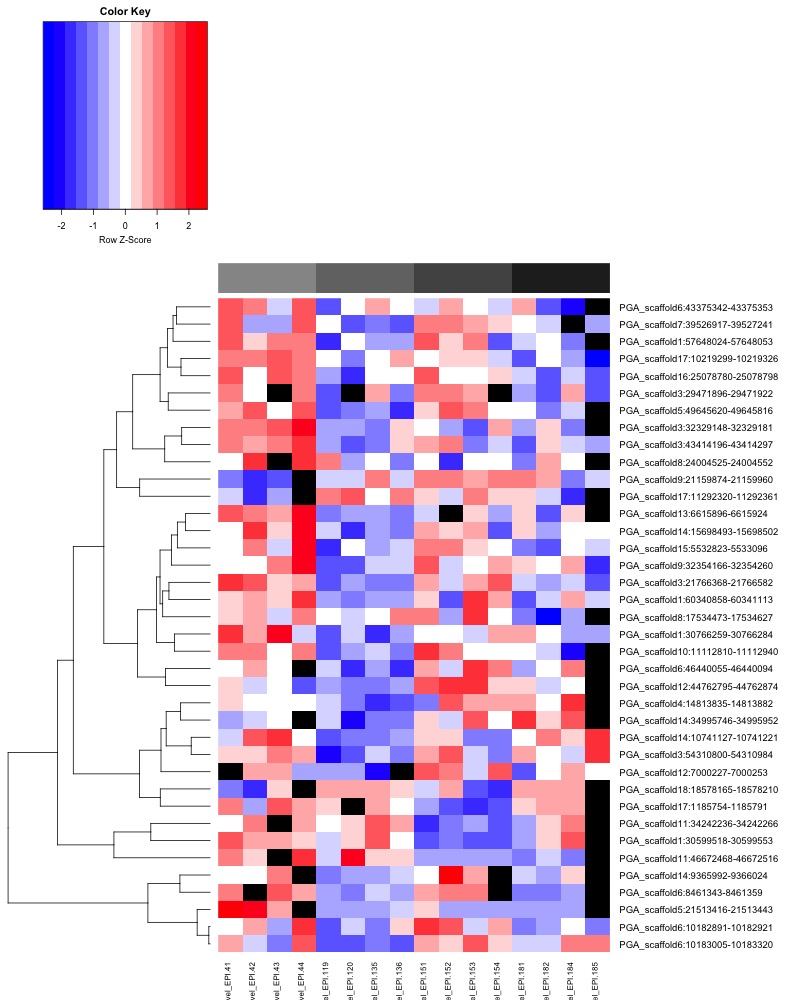
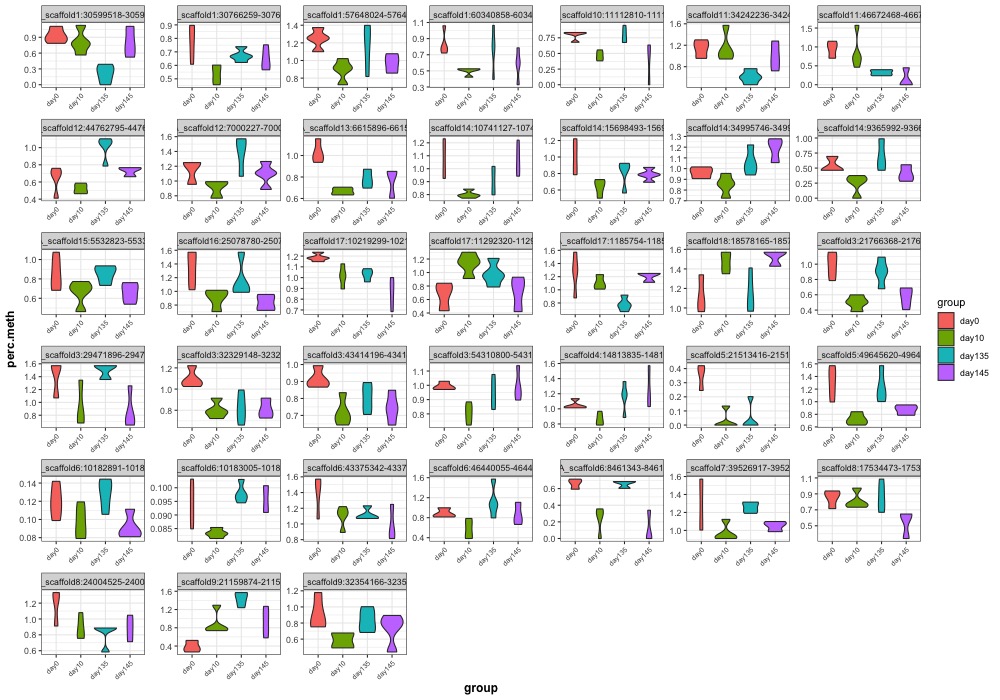
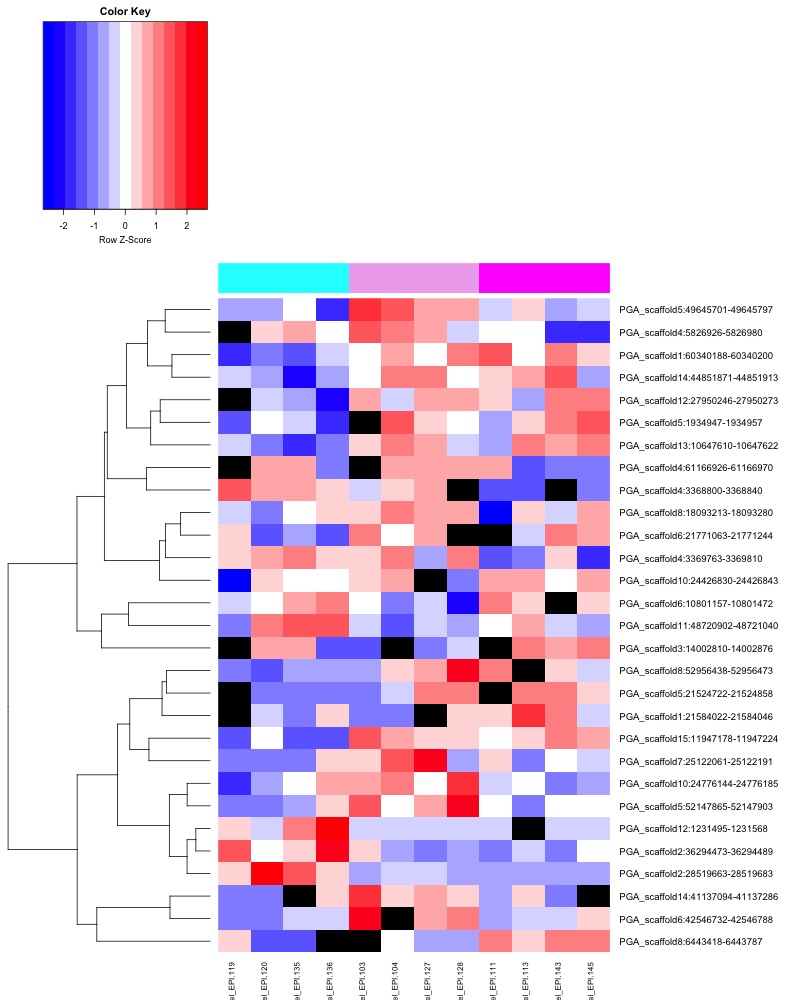
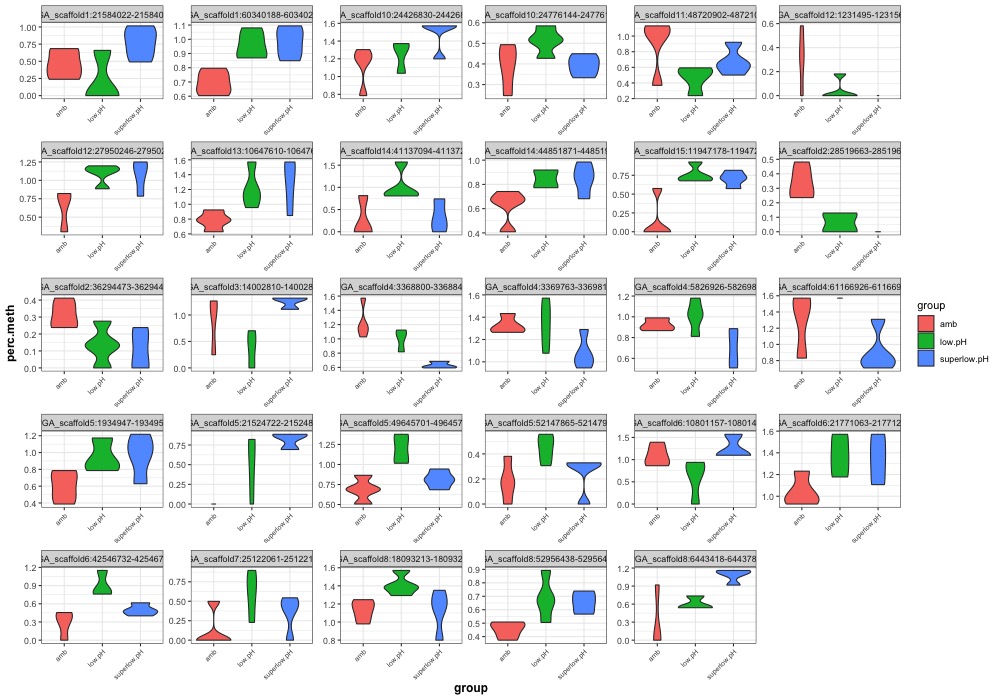
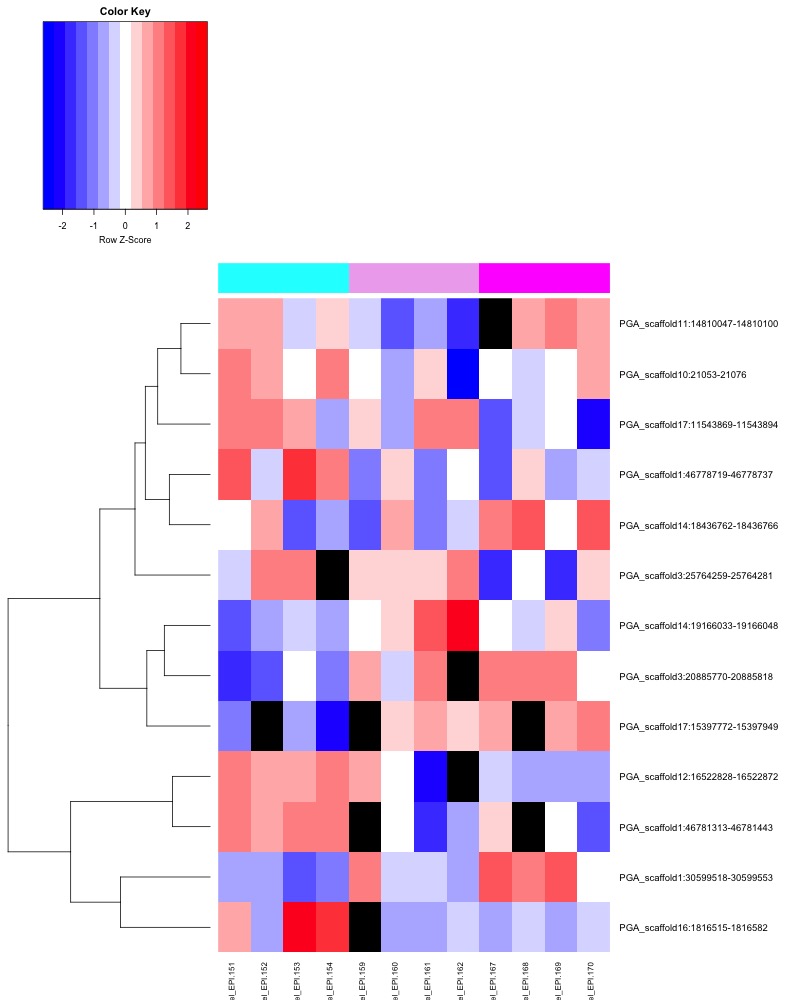
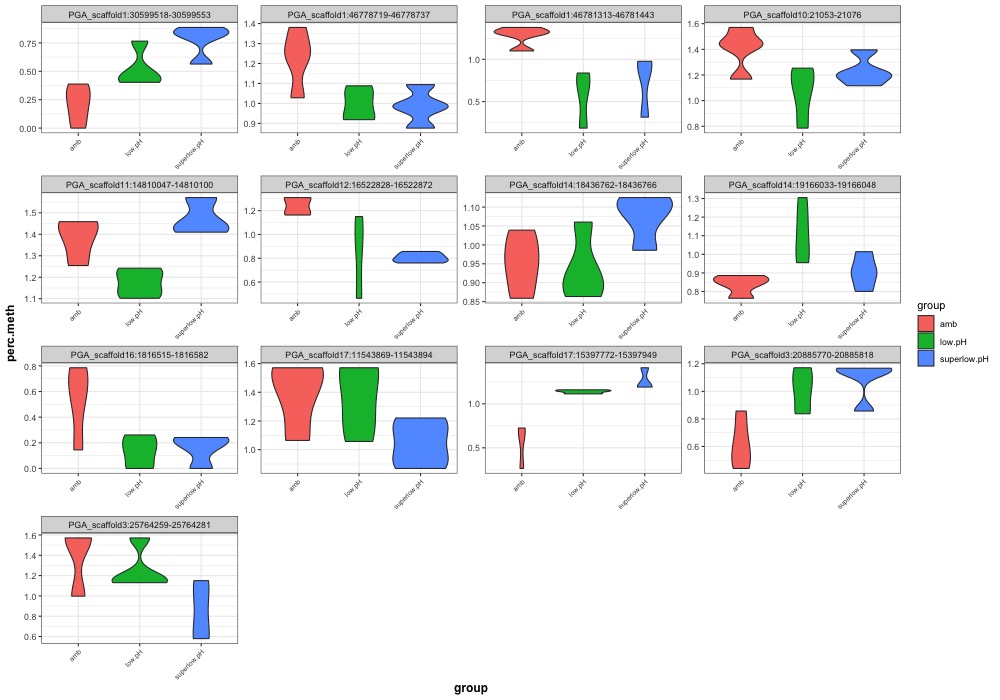
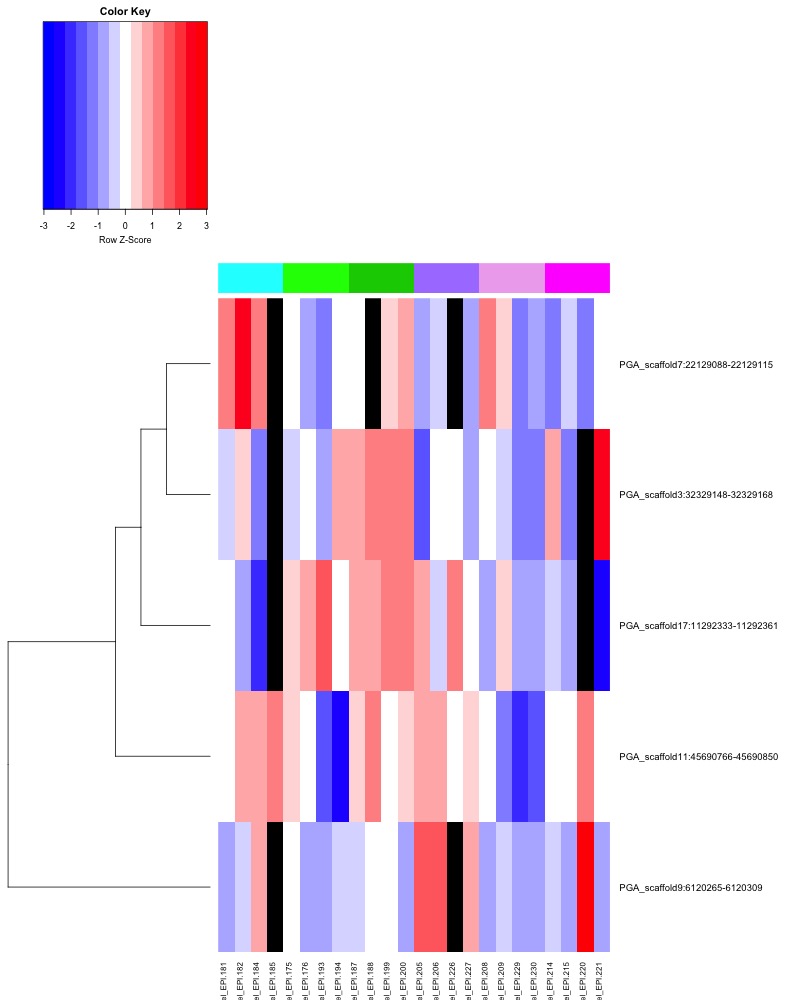
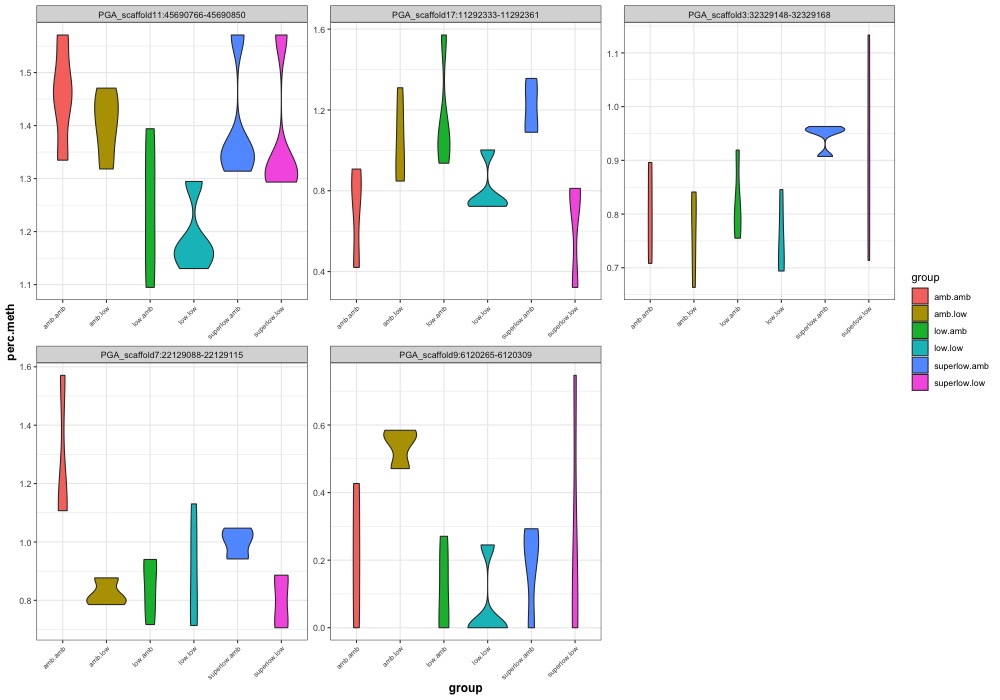
- Plotted heatmaps and violinplots of DMRs < 0.1 ANOVA p.value:
- created DMR bedfiles:
- used this jupyter notebook (20191102_DMRfind_allEPI_30bp.ipynb) to do this
- all ambient samples: amb_AllTimes_DMR250bp_MCmax30_cov5x_rms_results_collapsed_AOV0.1.DMR.bed
- day 10 samples: day10_AllpH_DMR250bp_MCmax30_cov5x_rms_results_collapsed_AOV0.1.DMR.bed
- day 135 samples: day135_AllpH_DMR250bp_MCmax30_cov5x_rms_results_collapsed_AOV0.1.DMR.bed
- day 145 samples: day145_AllpH_DMR250bp_MCmax30_cov5x_rms_results_collapsed_AOV0.1.DMR.bed
functional analysis
Match DMRs to genomic features
- did bedtools intersect on DMR bedfiles above and new annotation
- gff file: Panopea-generosa-vv0.74.a4-merged-2019-10-07-4-46-46.gff3
- jupyter notebook: 20191102_DMR_functional_analysis.ipynb
- created tab separated tables with the following columns:
- DMR chromosome
- DMR start position
- DMR end position
- number of DMS in DMR
- genomic feature
- Pgen gene
- Uniprot entry ID
- Uniprot entry name
- Protein name
- GO IDs
- GO Terms
- amb_AllTimes.GO.txt
- day10_AllTimes.GO.txt
- day135_AllTimes.GO.txt
- day145_AllTimes.GO.txt
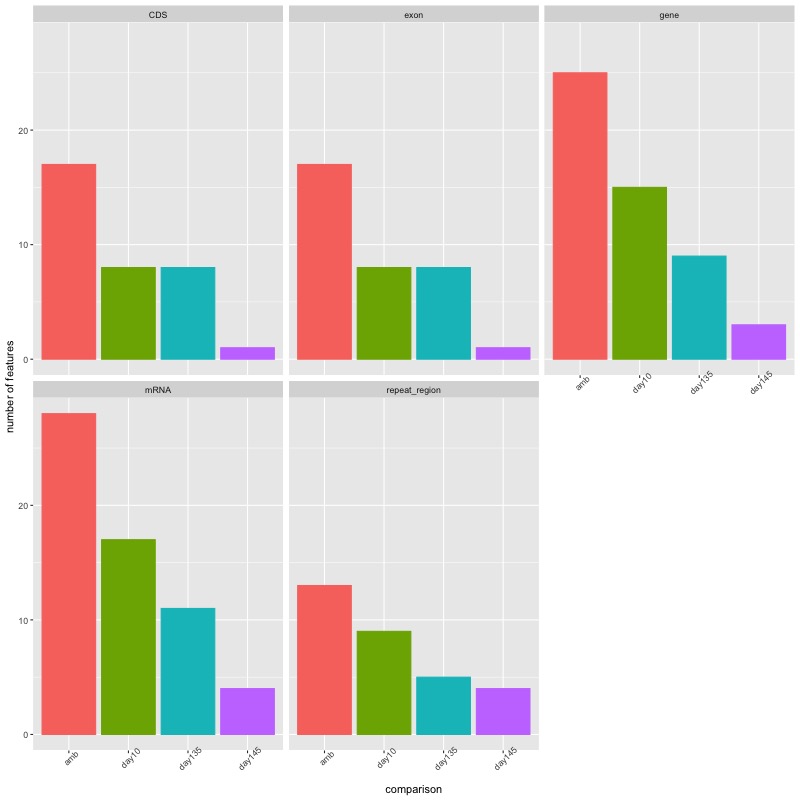
- DMRs from each group comparison x number of features facetted by feature type
- Feature type x number of features facetted by group comparison
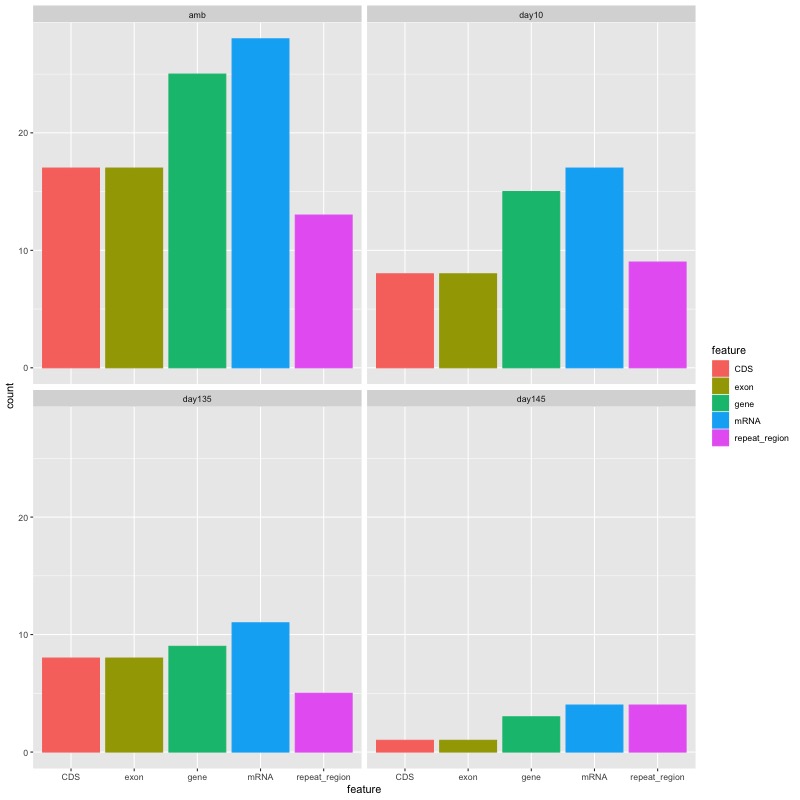
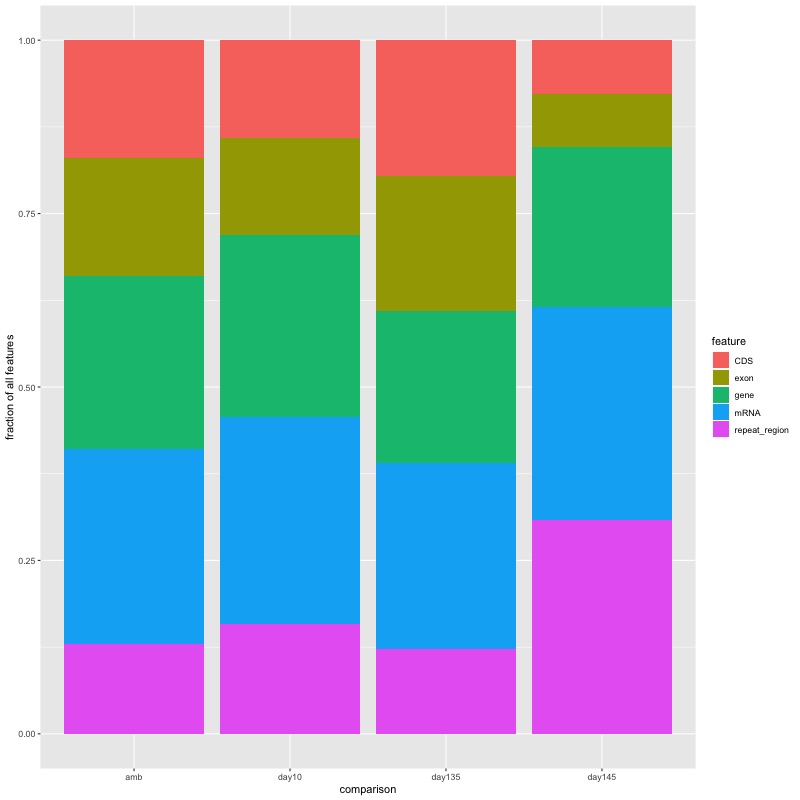
- Stacked bar plot showing the proportion of features that DMRs from each comparison fall into
