Mapping to SR lab GO slim terms
- I was unable to get simantic similarity for these terms (which is needed in order to relate proteins to one another through their terms) because they don’t map to terms in the goslim_generic.obo file or to the go data that ontologyX parses. So I’m not going to use these.
- refer to R script “Map2SRlabGOslims.R” for analysis
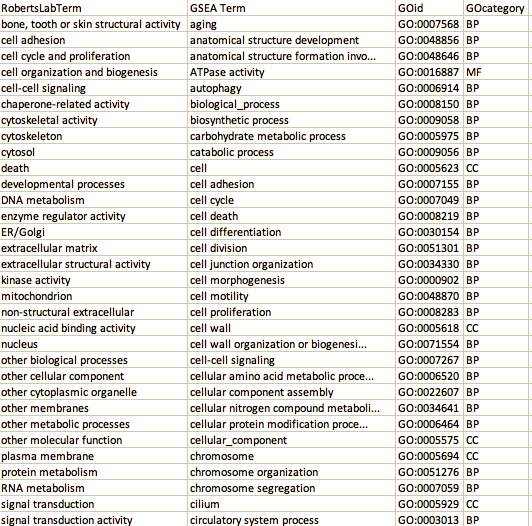
- example of SRlab slim terms not mapping to GO slim terms from goslim_generic.obo
Cleaning up analysis for poster figs
See analysis “CreateNodeAnd0.5GoSemSimEdgeAttr_ChiSqPval0.1_ASCA_EvalCutoff.R” to make files to import to cytoscape to generate poster figs.
quick summary of code:
make protein node attribute file
- read in fold-change and chisq pvalue data
- extract proteins that mapped to uniprot DB with an e-value cutoff of 10^-10
- select proteins with FDR-corrected ChiSq prop test pvalue < 0.1
- read in ASCA data and combine with ChiSq prop test pvalue 0.1 selected proteins to make a comprehensive list of selected proteins with their GO terms
- Translate all GO terms of selected proteins to GO slim terms:
- use GSEA to make a list of BP and MF GO slims in the data
- use OntologyX to make a list to GO IDs in the data and other GO IDs (ancester, parent, child) that they map to
- parse out GO slims from the ‘other GO IDs’ column to make a file that contains the original GO ID and the GO slim ID
-
ignore GO slim terms that are too broad (“GO:0008150 GO:0003674 GO:0005575”) - 130 unique proteins remain after steps above
make edge attribute file
- Calculate GO semantic similarities for all GO slim terms using OntologySimilarity function, and only select GO relationships that have >=0.5 similarity
made GO node attribute file
- Calculate magnitude foldchange normalized by number of proteins to use a GO node attribute
loaded data into cytoscape to make poster figs
Should all stat. methods (clustering, ASCA, and Chi sq. proportion test) be used for selecting altered proteins?
Going back to initial protein selection and determine which methods should be used by looking at the differences in protein abunadance between temperatures of the proteins each method identifies.
- Originally there were some proteins selected (either by ASCA, Clustering, or ChiSq prop test) that don’t appear to show a signifcant fold change between temperatures see fig in ppt. It would be good to see how these proteins were identified as significantly changed and determine if one method should not be used. Refer to VerifyStatsProteinSelection.R for analysis.
I plotted protein abundances as total number of spectra AND as average NSAF values because the Chi sq proportions test was done on total number of spectra and ASCA was done on NSAF values. There’s no reason ASCA or clustering couldn’t be done on total number of spectra, but we did it on average NSAF values per the pipeline developed by Emma.
Protein abundances (total number of spectra) of ASCA selected proteins
Protein abundances (average NSAF values) of ASCA selected proteins
Protein abundances (total number of spectra) of Chi sq pval 0.1 selected proteins
Protein abundances (average NSAF values) of Chi sq pval 0.1 selected proteins
Protein abundances (total number of spectra) of clustering selected proteins
Protein abundances (average NSAF values) of clustering selected proteins
-
interestingly, some average NSAF values show a different pattern over time than total num spectra do. I don’t really know what this means
-
also these plots show the proteins selected seem to show a difference at least on one day in abundances (whether avg NSAF value or TotNumSpec value) between treatments. So maybe something the first time I plotted this in cytoscape, it wasn’t displaying correctly?
-
clustering only identified one protein uniquely so we don’t gain much by including that method, except for the validation of other methods since 13/14 identified by clustering overlap with other methods
- kaitlyn proposed we could use clustering after ASCA and prop test selection of proteins
- we could take all proteins, mapped and unmapped and cluster, then assign a cluster number that can be used in network mapping
- this might be cool for trying to infer functions of unknown proteins:
- for each cluster, we could calculate the normalized magnitude foldchange and convert from protein to GO term (for unknown proteins, we would assign the same GO terms as are in the cluster and see how including magnitude FC of unknown compounds changes GO networks. This could be too much of a tangent though.
- we could take all proteins, mapped and unmapped and cluster, then assign a cluster number that can be used in network mapping
- kaitlyn proposed we could use clustering after ASCA and prop test selection of proteins