Visualizing filtered DMRs in IGV
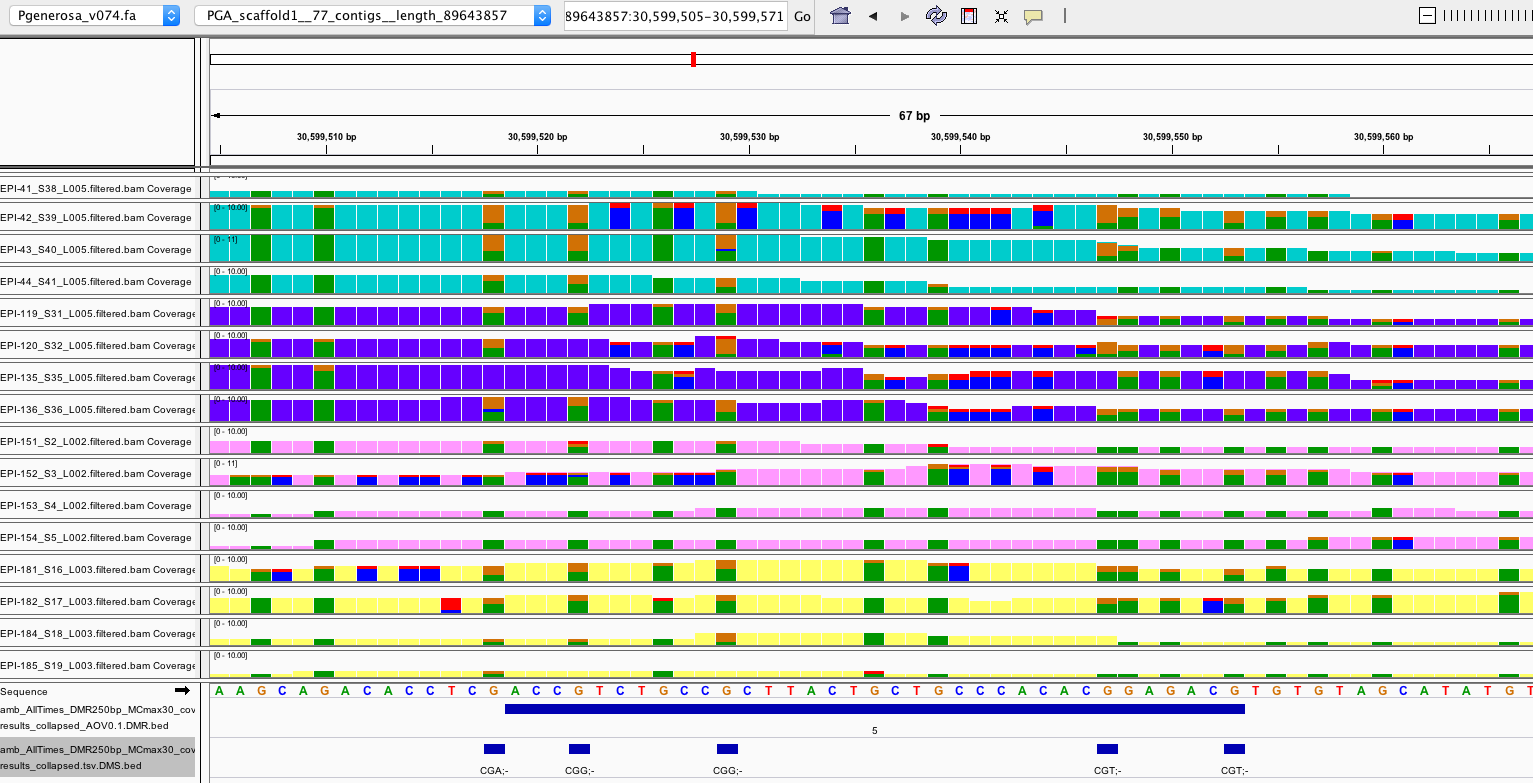
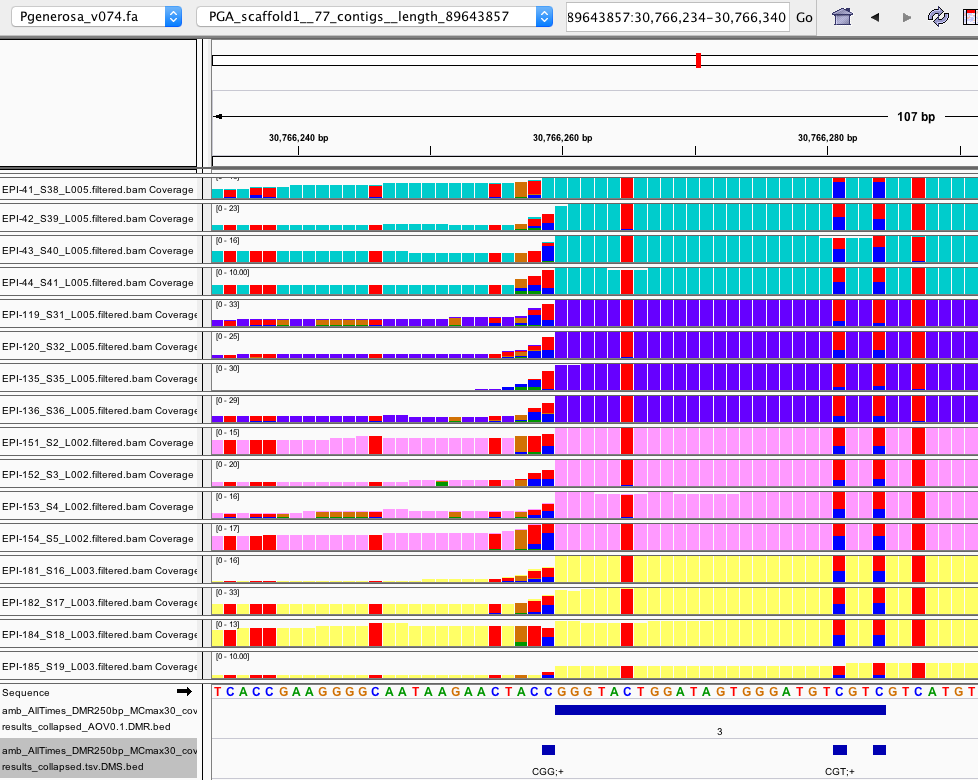
DMRs have been filtered for 5x coverage in at least 3/4 samples per experimental group, then further filtered for showing a significant difference in % methylation across experimental groups at an uncorrected ANOVA p.value < 0.1
- IGV session here (I just added the new DMR track to previous session): amb_AllTimes_IGV_20191024.xml
- files loaded:
- filtered bam files here: https://gannet.fish.washington.edu/metacarcinus/Pgenerosa/analyses/20190926/allAmb/
- filtered DMR bed file here: amb_AllTimes_DMR250bp_MCmax30_cov5x_rms_results_collapsed_AOV0.1.DMR.bed
- DMS bed file (not filtered) here: amb_AllTimes_DMR250bp_MCmax30_cov5x_rms_results_collapsed.tsv.DMS.bed
- files loaded:
- IGV screenshot key:
- bar height is relative to coverage (# reads)
- background color = same base as the reference
- teal = Day 0 samples
- purple = day 10 samples
- pink = day 135 samples
- yellow = day 145 samples
- background color @ reference C positions = methylated Cs (or non-converted Cs; need to know conversion efficiency to determine)
- blue = methylated C
- red = unmethylated C (converted to T during BS treatment)
- orange = reverse strand methylated C (G)
- green = reverse strand unmethylated C (converted to A during BS treatment)
- In general, DMRs filtered by ANOVA p.value < 0.1 seem legit (comparing proportions of blue:red and green:orange across groups )


-
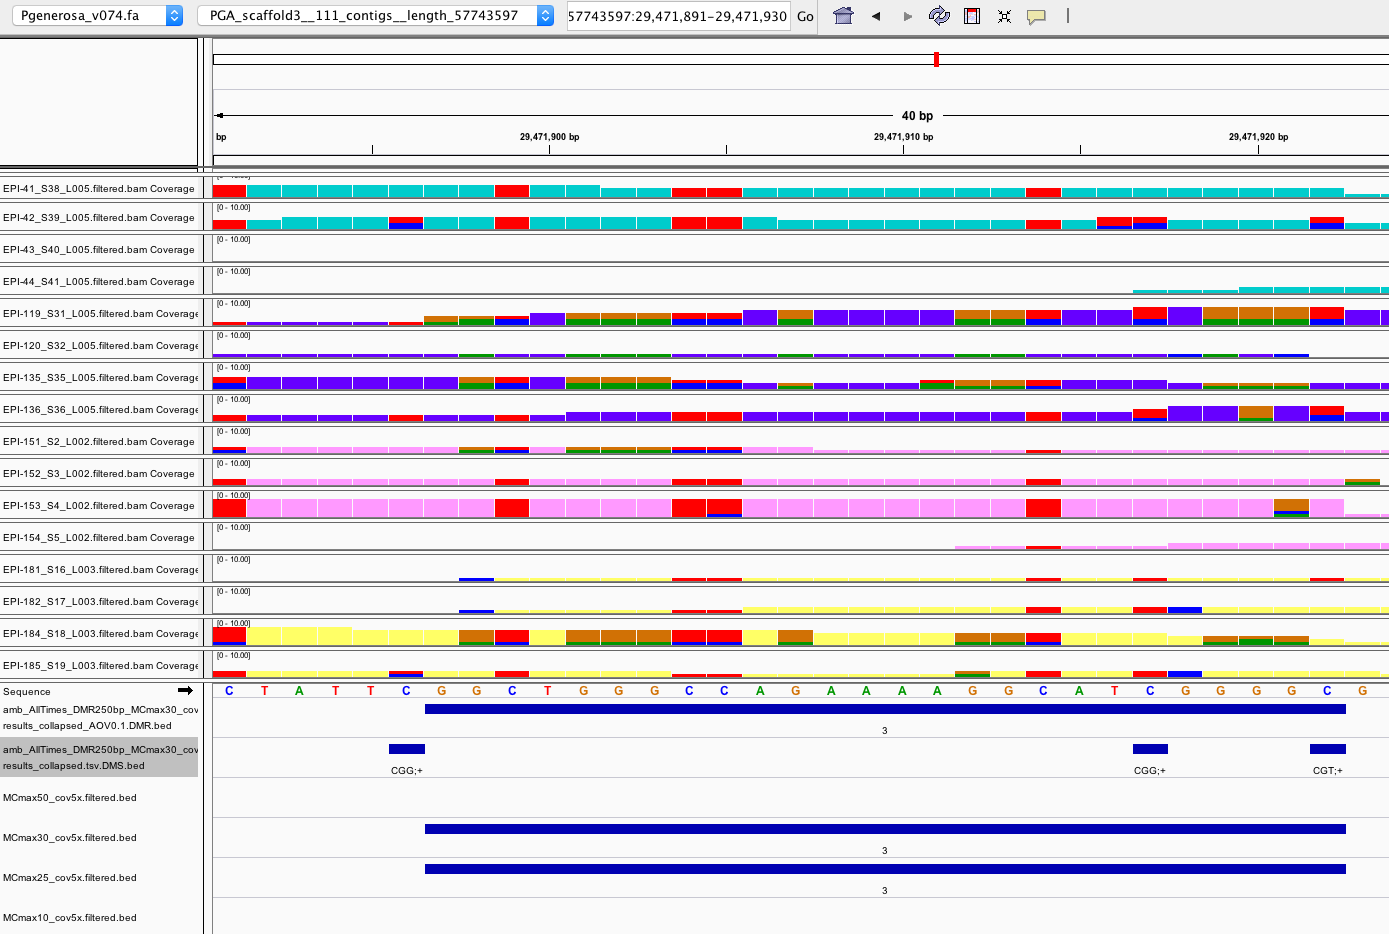
more examples here
- A couple DMRs seem questionable


- One explanation is that the filtered bam files I’m using in IGV were filtered for MAPQ30 and could be missing reads. The data I used to generate DMRs was filtered at MAPQ20 (see jupyter notebook used to generate filtered bam files section “This analysis below was done on “9/26/19”, and Oct 1 post ). I realized I never made filtered bam files after deciding to go with MAPQ20 reads for finding DMRs (whoops!). I’m currently filtering bam files on mox (20191030_BamFilterMAPQ20_pgen.sh) to do a more accurate QC.
…QC to be continued…