Check for overlapping DMRs across comparisons
- using original parameters with min individual/sample category set to 2, compare DMRs across Day 10, Day 135, and Day 145
-
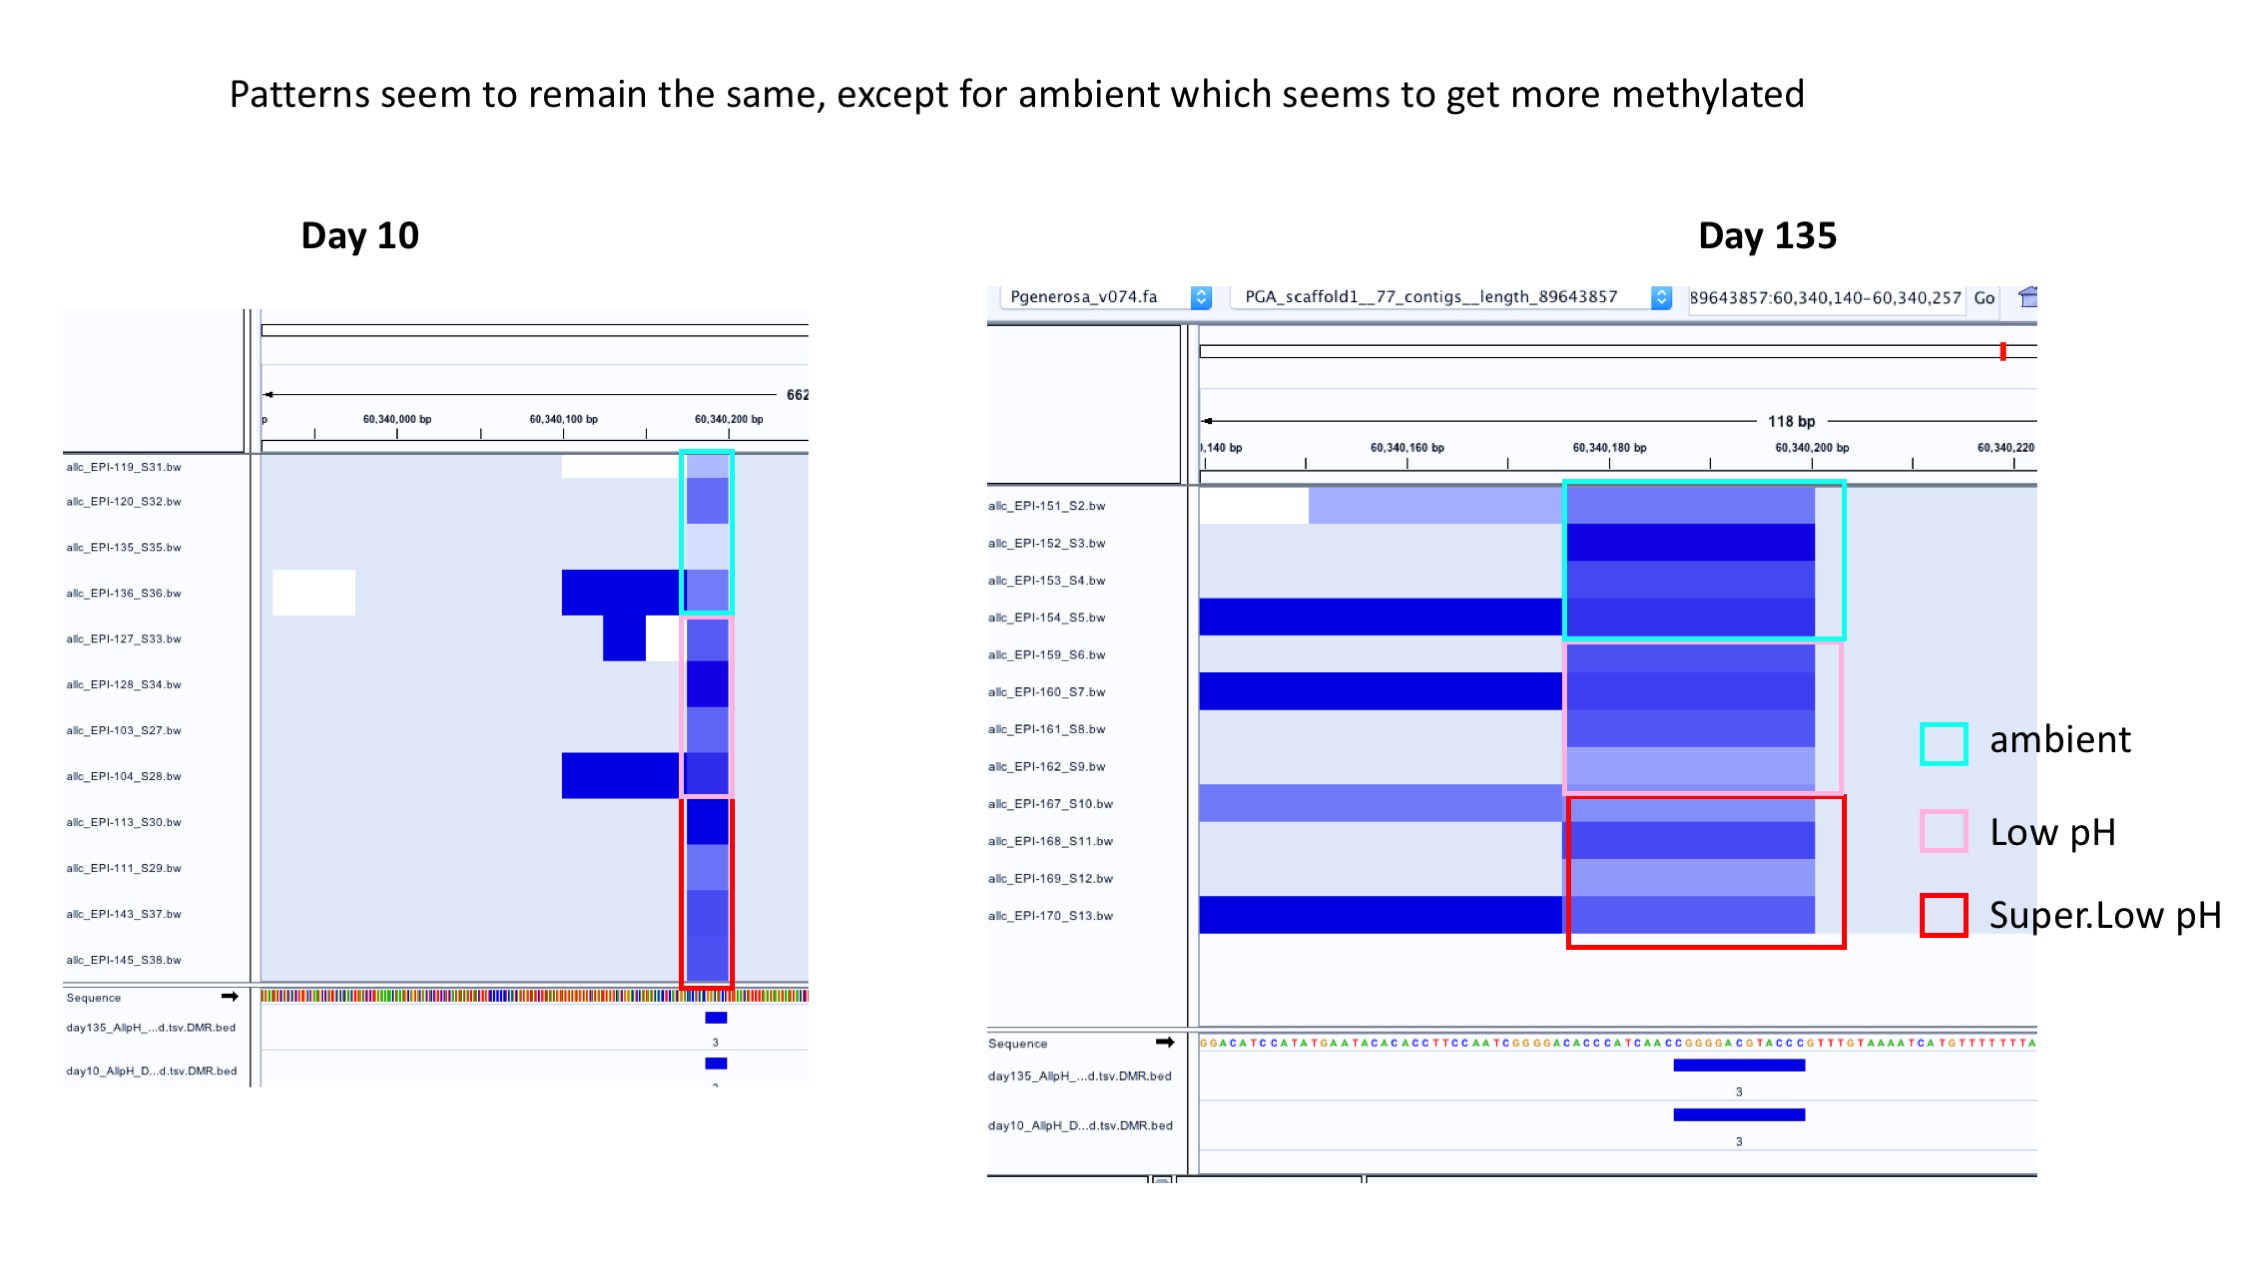
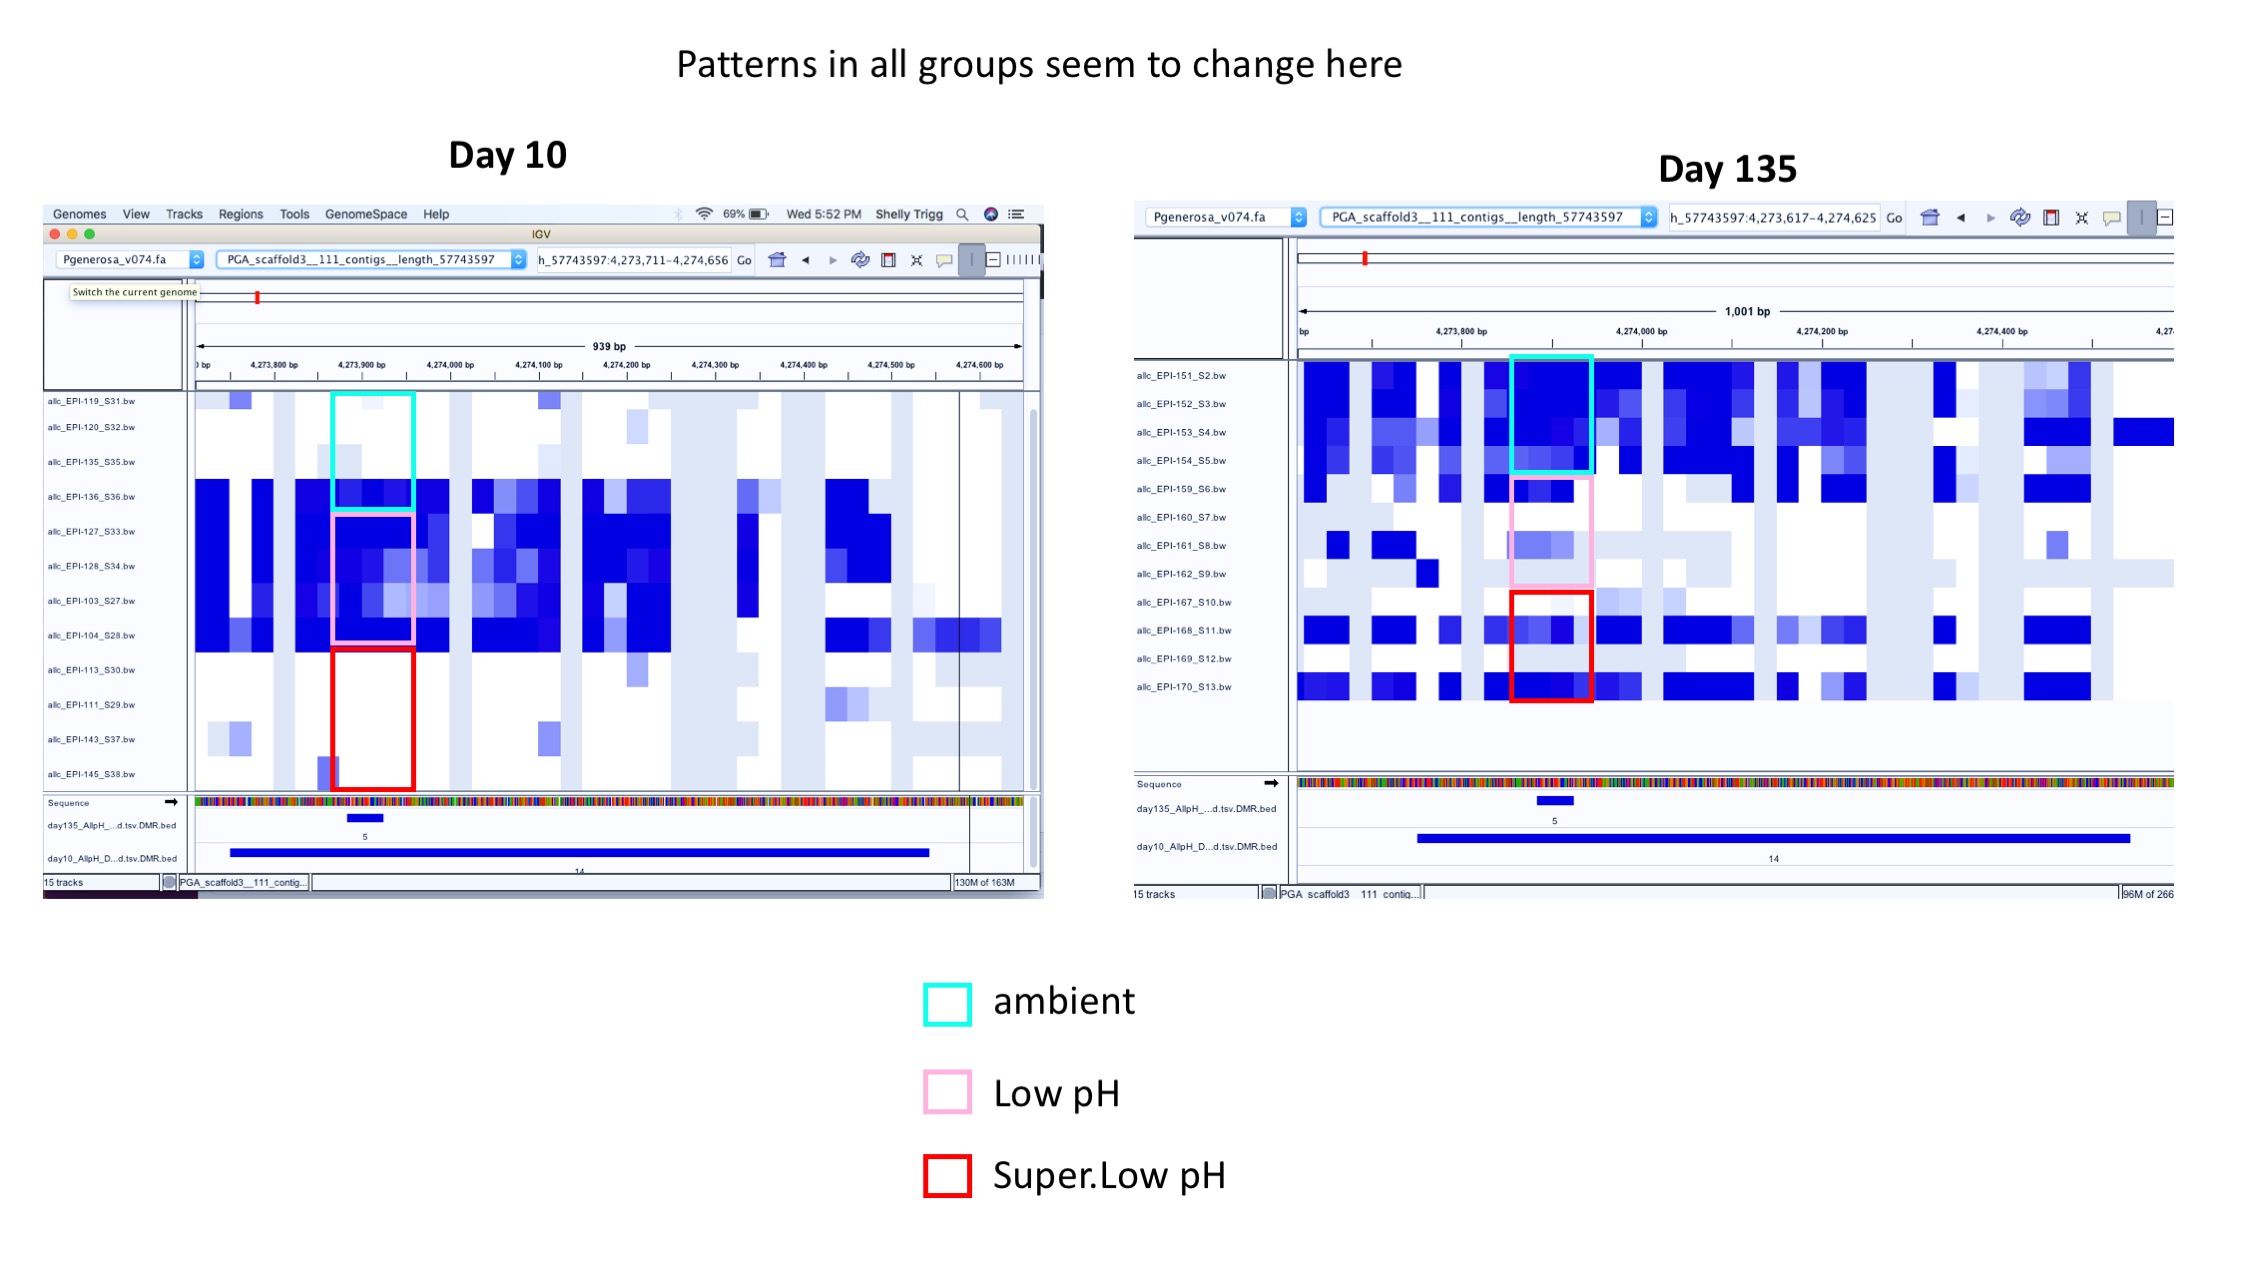
goal: see if DMRs arising at Day 10 persist across time, specifically patterns in low pH groups compared to ambient
- STEP 1: use bedtools closest to find DMRs overlapping between day 10 and 135
- STEP 2: Look at overlapping/close DMRs in IGV
- IGV session for day 10: https://gannet.fish.washington.edu/metacarcinus/Pgenerosa/analyses/20190822/day10_DMRs_minClst2.xml
- IGV session for day 135: https://gannet.fish.washington.edu/metacarcinus/Pgenerosa/analyses/20190822/day135_DMRs_minClst2.xml
-
- DMR files loaded:
- Day10 pH comparison
- Day135 pH comparison
- Bigwig (.bw) files loaded into IGV are here: https://gannet.fish.washington.edu/metacarcinus/Pgenerosa/analyses/20190822/
- These files contain %mCG in every 25bp chunk of genome
- Day 10 samples: EPI-103 EPI-104 EPI-111 EPI-113 EPI-119 EPI-120 EPI-135 EPI-136 EPI-127 EPI-128 EPI-143 EPI-145
- Day 135 samples: EPI-151 EPI-152 EPI-153 EPI-154 EPI-159 EPI-160 EPI-161 EPI-162 EPI-167 EPI-168 EPI-169 EPI-170
- Bigwig (.bw) files loaded into IGV are here: https://gannet.fish.washington.edu/metacarcinus/Pgenerosa/analyses/20190822/
- DMR files loaded:
- Day10 pH comparison
- Day135 pH comparison
- RESULTS:
- summary of results saved in this powerpoint: https://github.com/shellywanamaker/Shelly_Pgenerosa/blob/master/analyses/PersistantDMR_analysis/PersistantDMR_analysis.pptx
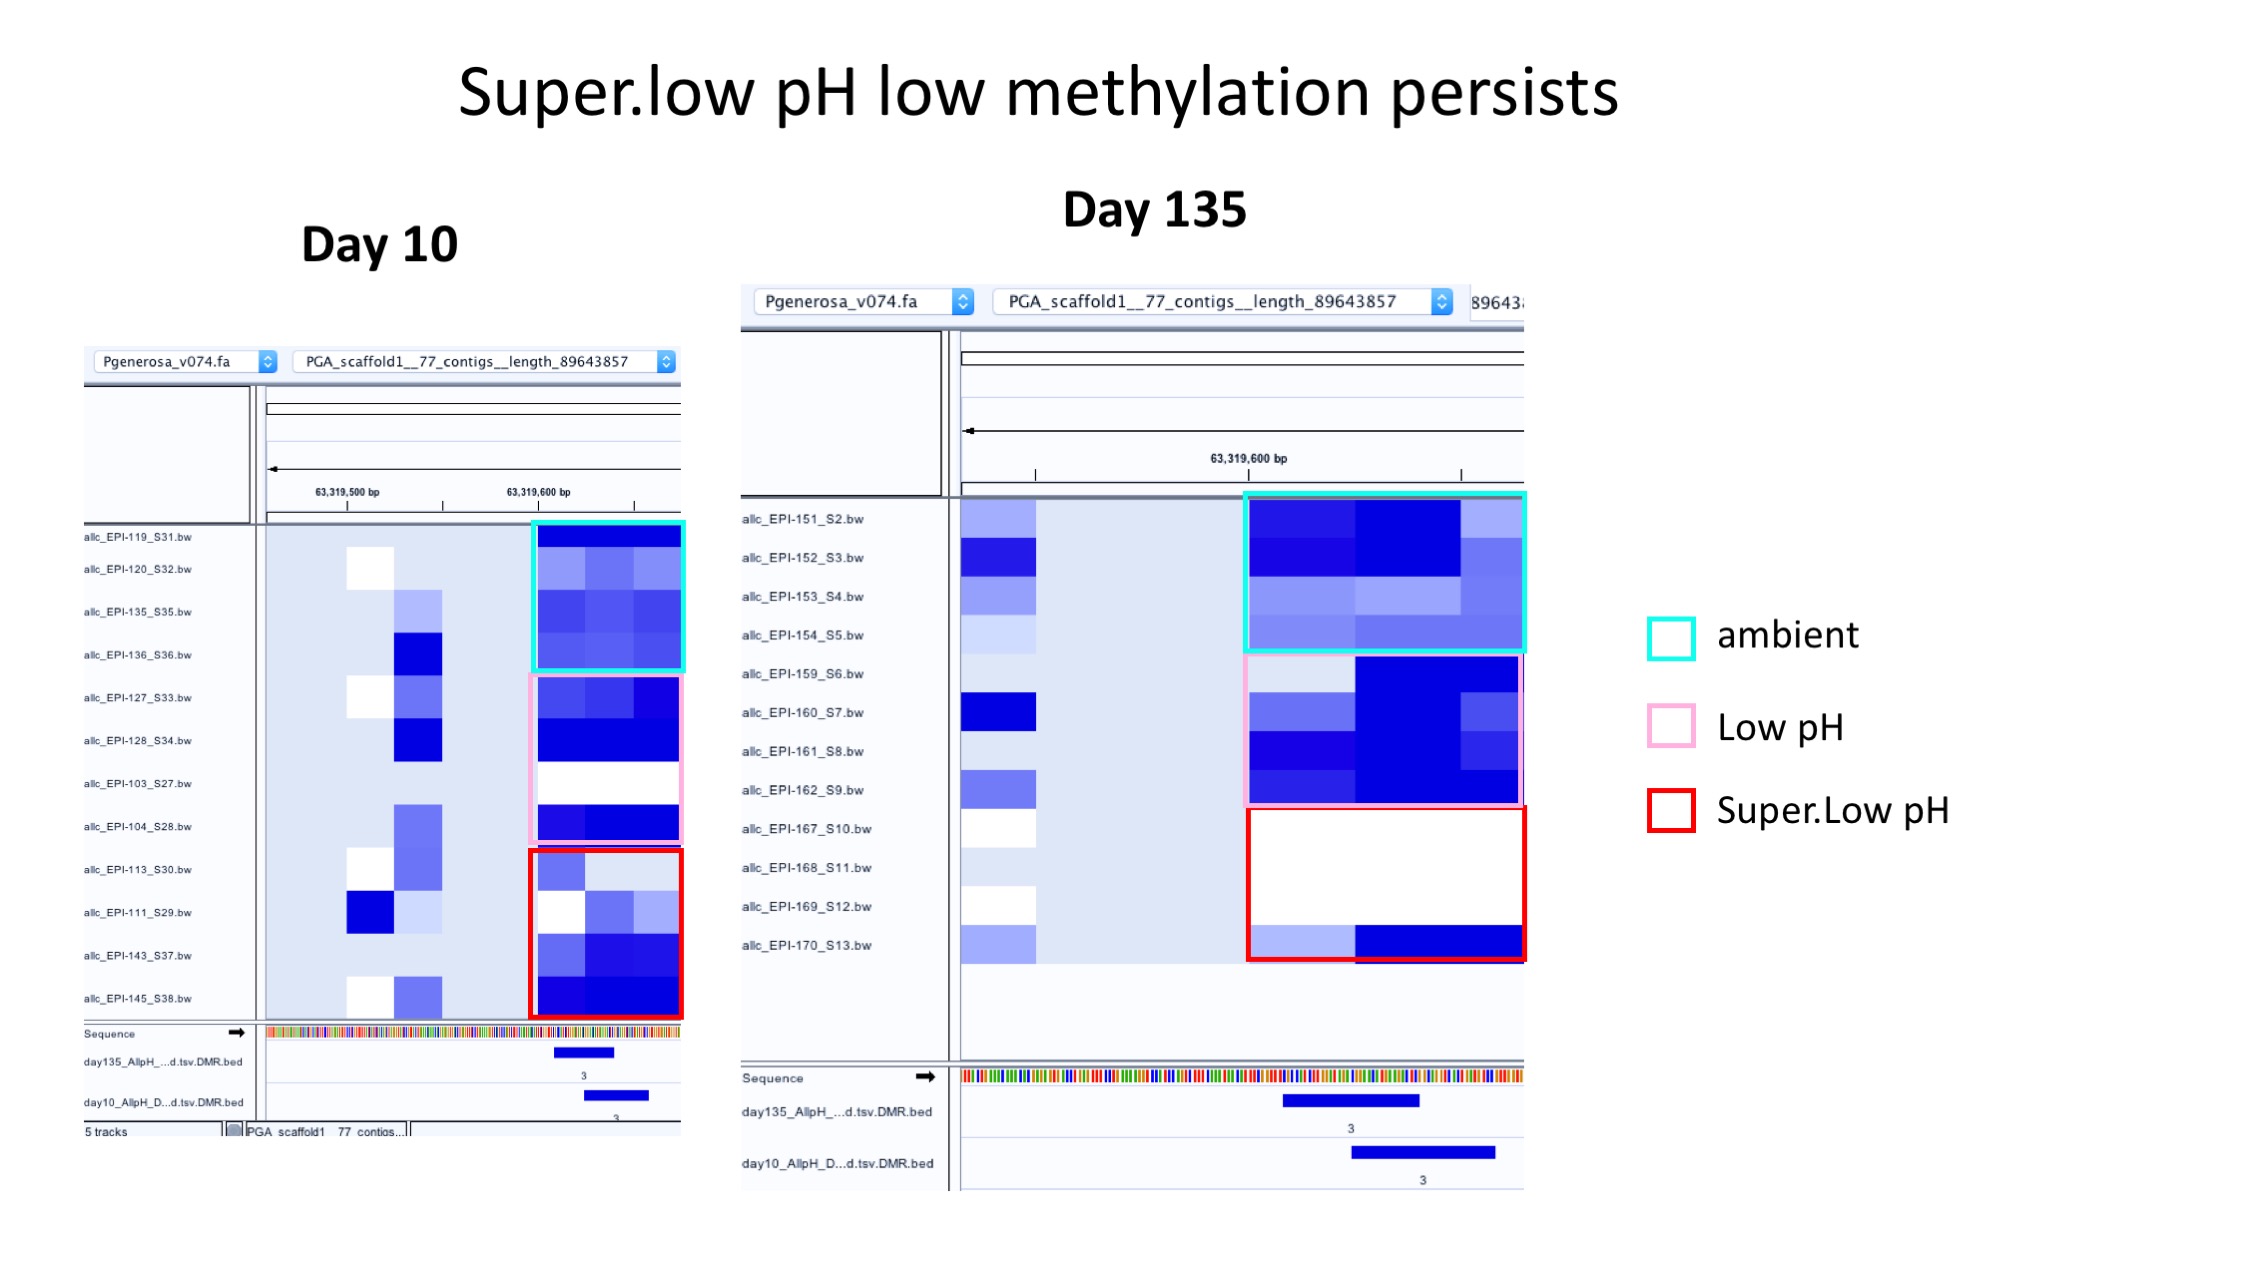

- Example of patterns staying generally the same over time:
- Example of patterns changing in all groups over time:
Next steps:
- determine if there are better (more appropriate) parameters to be using when calling DMRs (see section below). Then redo the bedtools closet on DMRfind output if different than current output.
Compare outputs of different DMRfind parameters
Ambient sample DMRfind result files to compare
- min-cov = 5; mc-max-dist = 25, min-cluster = 2
- min-cov = 5; mc-max-dist = 25, min-cluster = 3
- min-cov = 5; mc-max-dist = 50, min-cluster = 3
- merged allc; min-cov = 5; mc-max-dist = 25, min-cluster = 3
Bigwig files to load into IGV
Creating bigwig files:
- ran the following command on Ostrich from the allc directory I created on the desktop because my mox scripts kept failing (still unsure why)
find allc*.tsv.gz | xargs basename -s .tsv.gz | xargs -I{} methylpy allc-to-bigwig --allc-file {}.tsv.gz --output-file {}.bw --ref-fasta /Volumes/web/metacarcinus/Pgenerosa/GENOMES/v074/Pgenerosa_v074.fa --mc-type CGN --bin-size 25- this splits the genome into 25bp chunks and calculates %CG methylation of each chunk
- copied .bw files here: https://gannet.fish.washington.edu/metacarcinus/Pgenerosa/analyses/20190822/
Summary table of comparison:
| parameter | –min-cluster | –mc-max-dist | –min-num-dms | –dmr-max-dist | –min-cov | |
|---|---|---|---|---|---|---|
| descr | min #samples/group | #bp between sites where mCG counts can be summed | min #DMS for DMR to be reported | max distance signif. sites can be to be included in same DMR | min #reads for DMS to be considered | #DMRs called |
| 2 | 25 | 3 | 250 | 5 | 192 | |
| 3 | 25 | 3 | 250 | 5 | 22 | |
| 3 | 50 | 3 | 250 | 5 | 32 | |
| merge all samples/group | 25 | 3 | 250 | 5 | 716 |
IGV session: https://gannet.fish.washington.edu/metacarcinus/Pgenerosa/analyses/20190822/merge_allc/amb_compareDMRfindParams.xml
- Files loaded:
- Bigwig (.bw) files loaded into IGV are here: https://gannet.fish.washington.edu/metacarcinus/Pgenerosa/analyses/20190822/
- samples: EPI-41 EPI-42 EPI-43 EPI-44 EPI-119 EPI-120 EPI-135 EPI-136 EPI-151 EPI-152 EPI-153 EPI-154 EPI-181 EPI-182 EPI-184 EPI-185
- DMR files loaded are linked above
- Bigwig (.bw) files loaded into IGV are here: https://gannet.fish.washington.edu/metacarcinus/Pgenerosa/analyses/20190822/
- RESULTS:
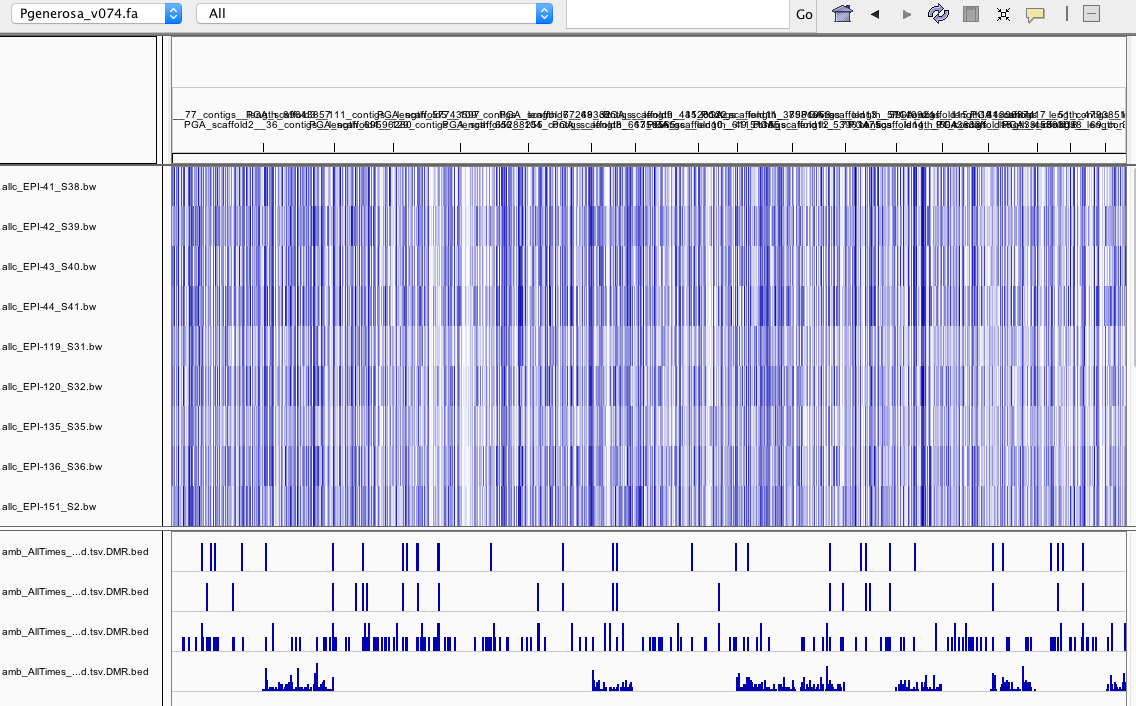
- DMR.bed files are ordered as follows:
- –min-cluster 3, –mc-max 25
- –min-cluster 3, –mc-max 50
- –min-cluster 2, –mc-max 25
- all samples merged per group, –mc-max 25
- interesting that some chromosomes have no DMRs when all samples are merged
- DMR.bed files are ordered as follows:
- Next Steps:
- visualize with 5x cov. filtered bedgraphs to confirm DMRs are not false positives
- create .bw files from merged allc files to see how .bw files from individual samples compared to merged sample files.
- this is to mainly understand what is going on during merging. From what I understand, the allc files are combined and overlapping CpG counts are summed across samles