ASCA analysis with oyster proteomics temperature x time series dataset
Goal: To determine if proteins drive difference between temperature groups over time
we need to understand the model that ASCA creates from the data so we want to extract the loadings from the temperature factor ASCA and try to understand the behavior of the proteins with high loadings values
PC1 explains 100% of the variation; this seems strange so need to understand what is up with that
first I checked that protein column names match up with the rows in the ASCA R function SVD output
then I saved a csv file with the protein names and PC1 loadings values
two factor time series, peak intensity table,samples in rows
no data filtering
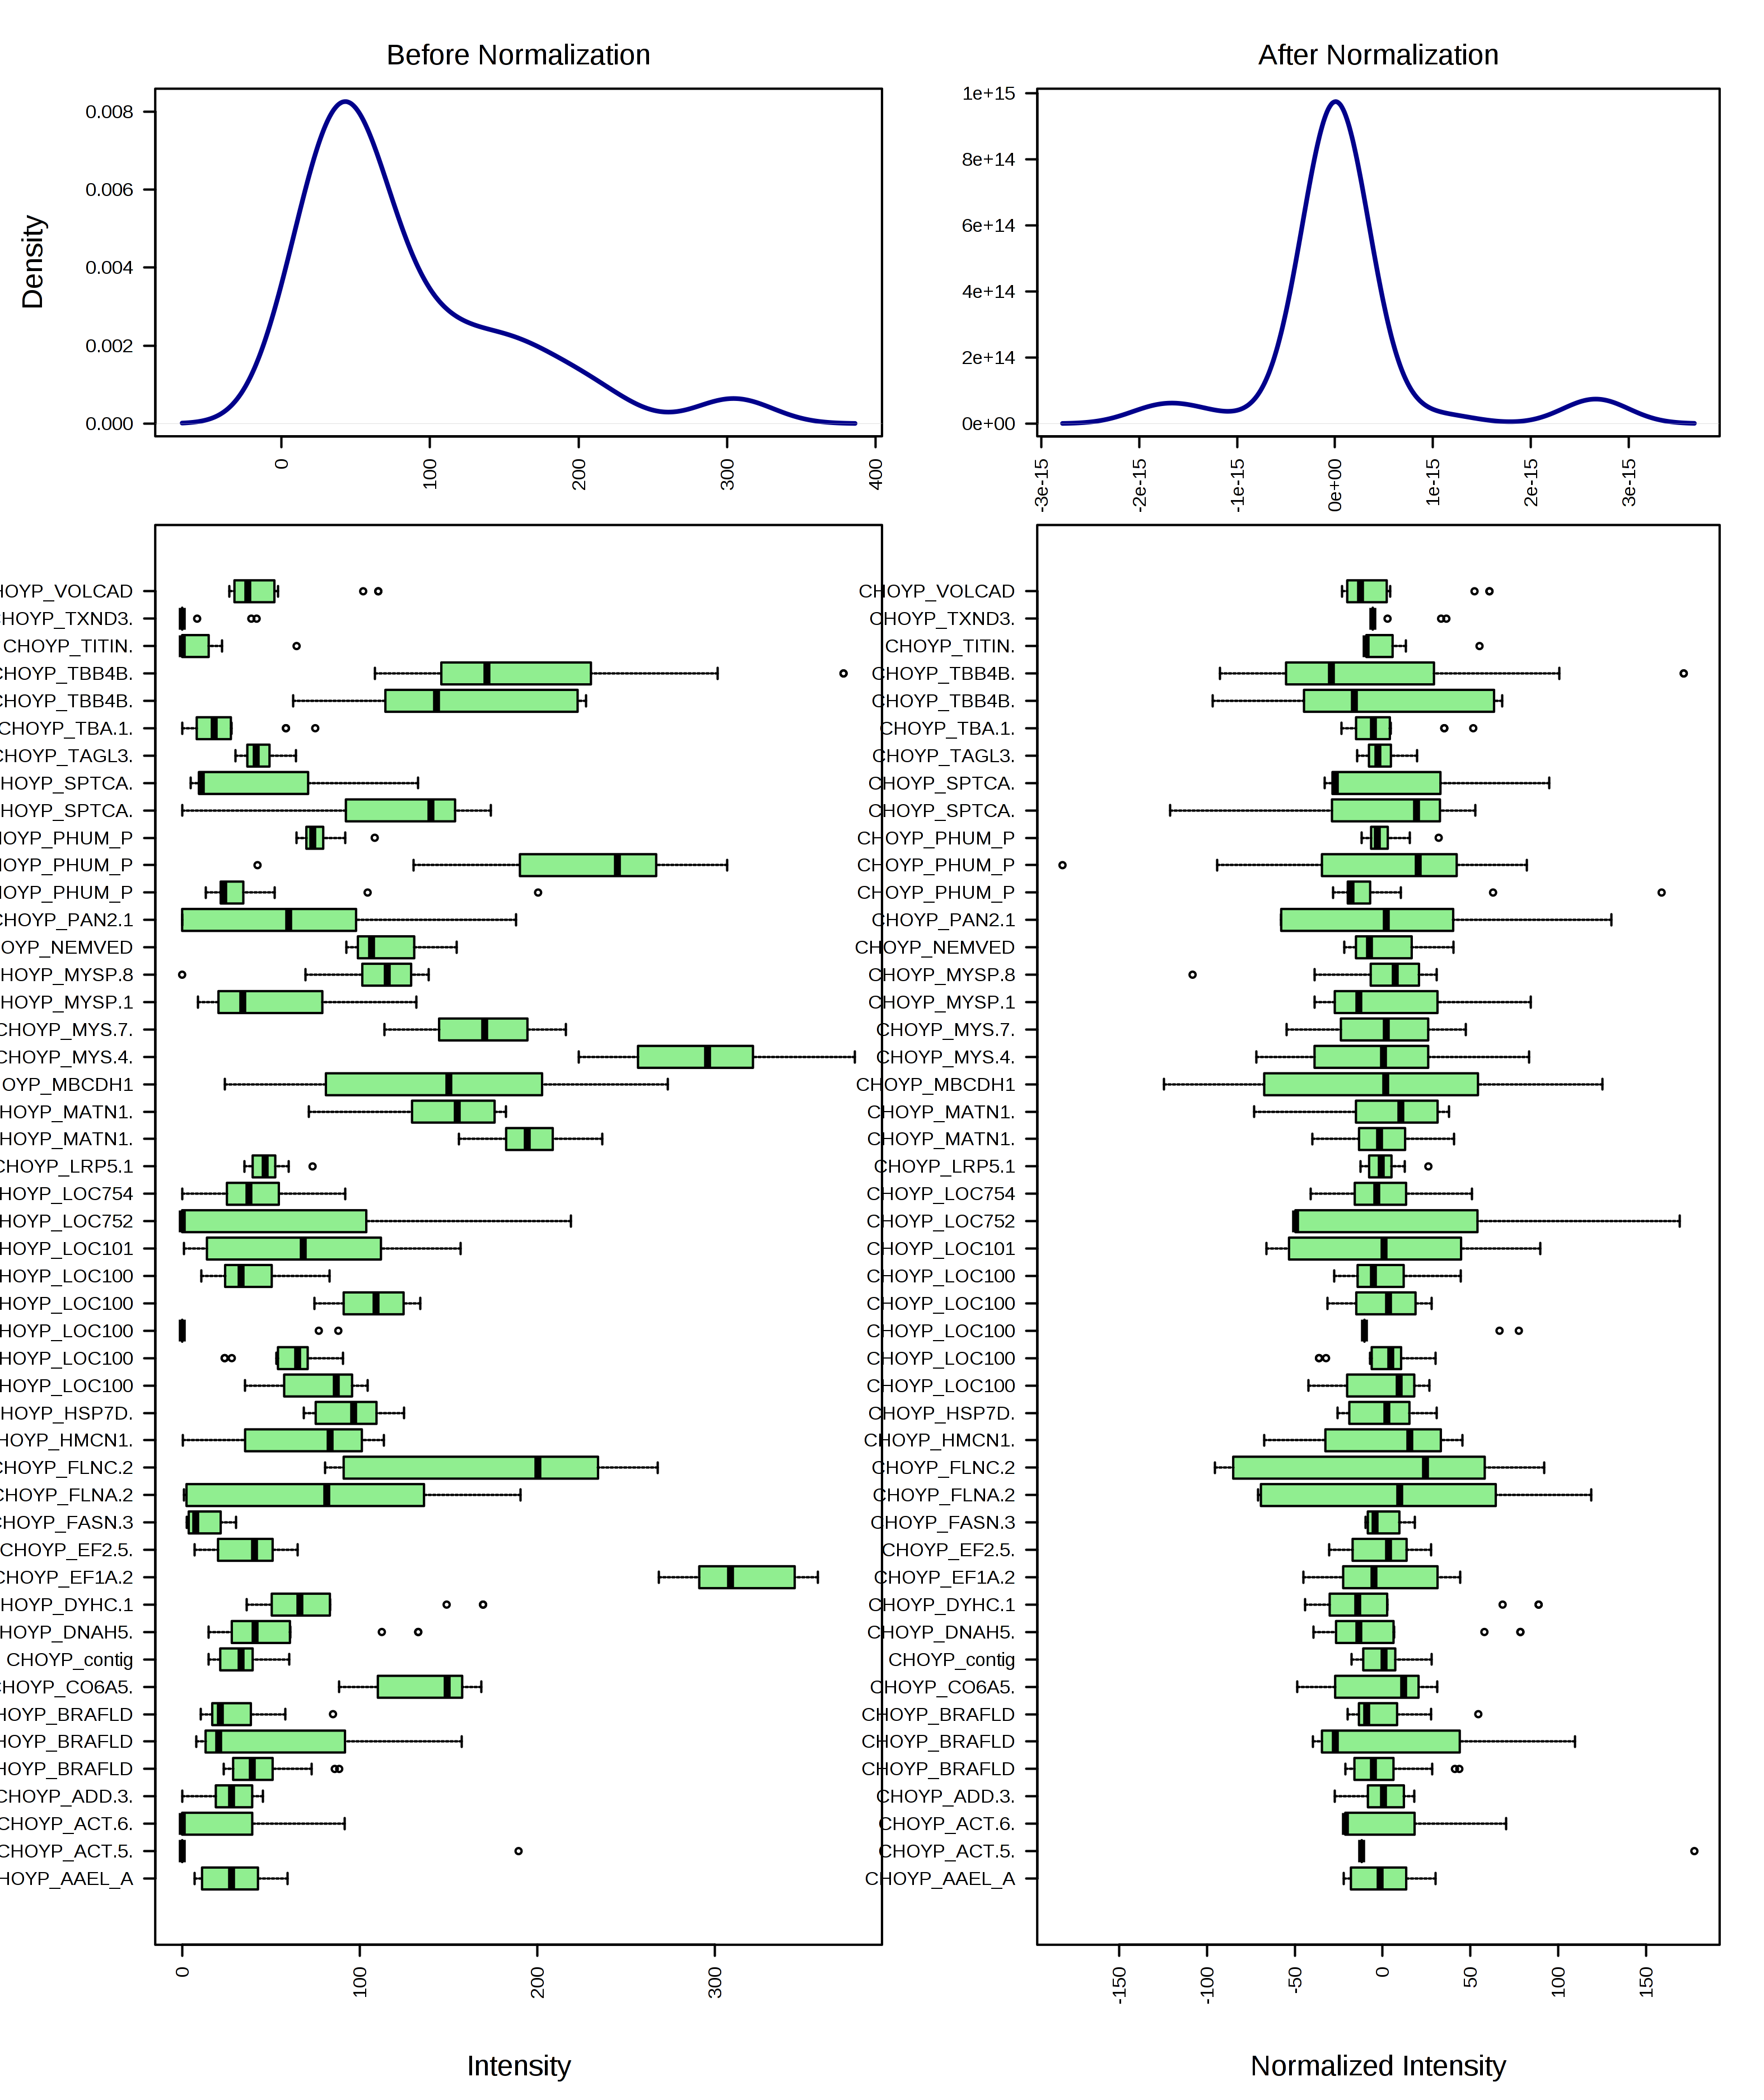
mean-centering
ran ASCA
-model performance is worse than before and not different from random
ran heatmap function to get a better idea of the behavior of the protiens
i’m not sure what to think of the proteins that don’t show any abundance except in two samples (ACT.527m15, LOCI100497129, and TXND3.2.4m2). Should these really be included in the analysis?
conclusions:
It seems like there are some clusters in the heatmap that are different between temperature treatments, but I don’t know what this means if the ASCA model of these proteins is really poor
I’m not sure I really understand the whole ASCA feature selection process so need to read this paper to understand it better: https://academic.oup.com/bioinformatics/article/23/14/1792/189939


")